Metrics Stata Interpretations
0.0(0)
Studied by 0 peopleCard Sorting
1/3
There's no tags or description
Looks like no tags are added yet.
Last updated 3:09 AM on 5/18/26
Name | Mastery | Learn | Test | Matching | Spaced | Call with Kai |
|---|
No analytics yet
Send a link to your students to track their progress
4 Terms
1
New cards
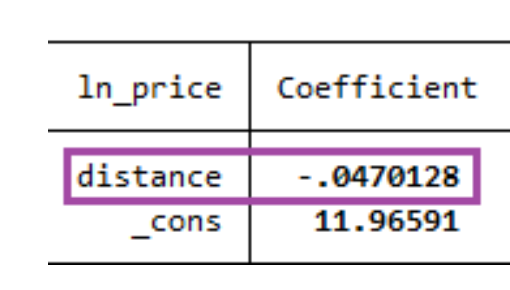
When the y is in an ln, how do you interpret stata output?
(e.g., ln(pricei) = α+ βdistancei + εi), how do you interpret the image
take the β^ , x 100, add % sign:
“A 1 unit increase in distance is associated with a 4.7% decrease in house price”
2
New cards
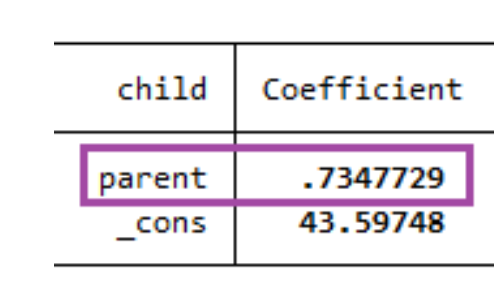
When the y is normal, how do you interpret stata output?
(E.g., childi = α+ βparenti + εi)
No adjustments, just use the correct unit:
“A 1 cm increase in parent height is associated with a 0.735 cm increase in child height”
3
New cards
Filler2
Filler2
4
New cards
Filler3
Filler3