4.1.4 - Production, costs and revenue
1/61
There's no tags or description
Looks like no tags are added yet.
Name | Mastery | Learn | Test | Matching | Spaced | Call with Kai |
|---|
No analytics yet
Send a link to your students to track their progress
62 Terms
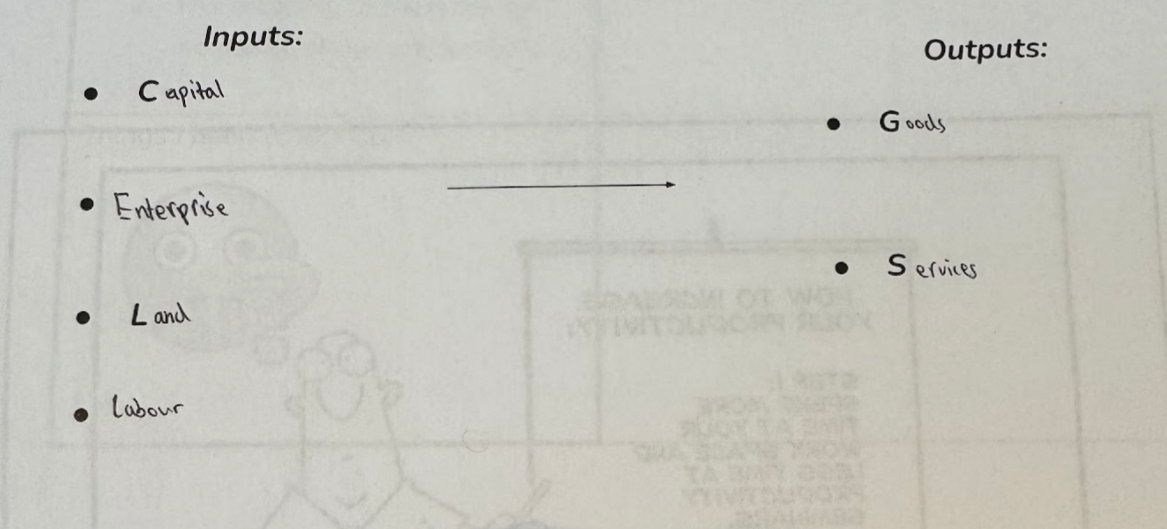
Production =
The combination of factor inputs (CELL) being used to create outputs (goods & services) that can be sold, usually for profit.
Productivity =
Quantity of Output per unit of Input, per period of time
= Output / Input
Labour Productivity =
Quantity of output per worker, per period of time
Capital Productivity =
Quantity of output per unit of capital, per period of time
Productivity Gap =
The difference between productivity in one economy compared to another.
Factors causing a RISE in Productivity
Better training for labour
Investing in new machinery
Better worker morale (thru improving working conditions, wage, job security, rights, job rotation)
Specialisation - workers get better at their job
Factors causing a FALL in Productivity
Lack of technological adoption
Low capital investment (machinery getting old)
Low worker morale
Skill gaps - lack of training
Specialisation =
When a factor of production is devoted to a narrow range of tasks for which it is well-suited.
Division of Labour =
The action of splitting up a large and complex production process into separate tasks which are each given to a specialised worker.
Why is Specialisation Useful?
Workers given a narrow range of tasks suited to their skill set →
Workers do the tasks that they are most productive in (no wasted time doing things they’re bad at)
Workers get better / more productive at their job (as only practicing that one task)
No time wasted switching between tasks
Why is an efficient means of exchanging g&s necessary for specialisation?
When people specialise, they only do tasks they are good at.
This makes them reliant on others for other things (e.g. a farmer needs a mechanic to fix their car)
If there was not a medium of exchange, it would be a Barter Economy, which requires a double coincidence of wants.
This would making exchanging goods & services very difficult.
Therefore, need to use money as a medium of exchange.
Short Run =
The time period in which at least one factor of production is fixed.
Only way to increase production is to add variable FoP to the fixed one
Long Run =
The time period in which all factors of production are variable.
To increase production, can raise any FoP
Total Returns =
Total volume of the firm’s output
Average Returns =
Returns (output) per unit of input
Marginal Returns =
Additional output produced from one extra unit of input
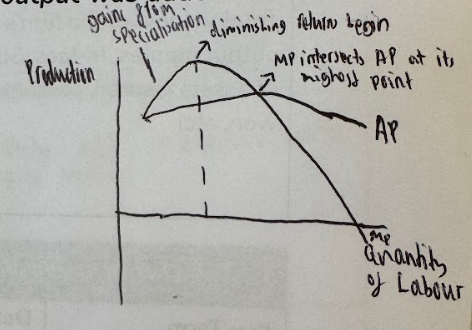
Law of Diminishing Returns
Adding more of a variable input (e.g. worker) to a fixed one (e.g. capital) causes progressively smaller rises in output.
Diagram showing Diminishing Marginal Returns
Does the law of diminishing returns apply in the SHORT or LONG RUN
Only in short run
Returns to Scale =
How the output of a production process changes as all inputs are increased by the same proportion.
Increasing Returns to Scale =
When a proportional increase in all inputs (capital and labor) results in a more than proportional increase in output.
Leads to lower long-run average costs (economics of scale)
Decreasing Returns to Scale =
When a proportional increase in all inputs (capital and labor) results in a less than proportional increase in output.
Leads to higher long-run average costs (diseconomies of scale)
Constant Returns to Scale =
When a proportional increase in all inputs (capital and labor) results in an identically proportional increase in output.
Leads to same long-run average costs
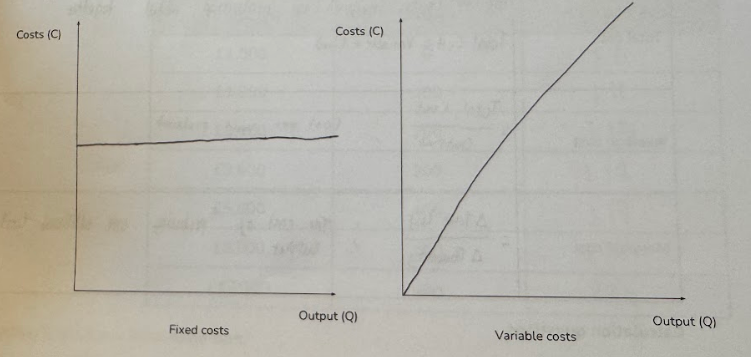
Fixed Costs =
Costs that don’t change as a result of a change in output in the short run
Variable Costs =
Costs that change as a result of a change in output, even in short run
Diagram showing Fixed vs Variable Costs
Total Cost =
All the costs involved in production added together
= Fixed + Variable Costs
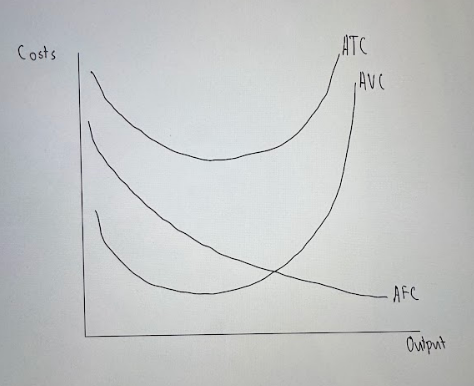
Average Cost =
Cost per unit produced
= Total Cost / Output
Marginal Cost =
The additional cost of producing one extra unit of output
= Change in Total Cost / Change in Quantity of Output
Diagram of Average Total Cost, Average Variable Cost, Average Fixed Cost
Economies of Scale =
Cost savings that arise because producing more output reduces average cost.
Internal Economies of Scale =
Cost savings that result from the growth of the firm itself.
Types of Internal EOS
Please Try Find Money
Purchasing - As firm increases output, it buys more inputs. Buying at higher quantity allows firm to access bulk-buying discounts.
e.g. cotton for clothing manufacturer
Technical - Larger firms can afford to invest in more & better capital.
e.g. Industrial dishwashers are 2x more energy efficient.
Financial - Larger firms can borrow more funds and on more preferable terms because lender perceives lower risk for larger firms
e.g. Lower interest rates on loans, longer repayment time
Managerial - Larger firms can employ more specialist managers who can raise the productivity of other workers
e.g. Experienced football manager
External Economies of Scale =
Cost savings that result from growth in the industry in which the firm operates.
Types of External EOS
Better or closer Supply Chains - Suppliers may open locations that serve clusters of firms in a particular industry → lower costs of delivery.
Better Transport or Communication Infrastructure - Better infrastructure in the area where firms of a particular industry cluster.
e.g. more car parking, wider roads → lower transport costs
Local pool of Trained Labour - Education or training related to an industry may occur intensively in one particular area → firms can focus their recruiting efforts to just that area → lower recruitment & training costs
Diseconomies of Scale =
When producing more output increases average cost
Types of Diseconomies of Scale
Communication - More difficult & costly to communicate effectively with all workers in large firms. Messages can get distorted/lost as they are passed down → worsens productivity
e.g. Messages from HQ to individual stores get changed → workers do wrong thing → worsens productivity
Coordination - Harder to coordinate and supervise tasks of each worker
e.g. Workers may duplicate tasks or do wrong tasks
Motivation - As firms increase in size, workers feel more distant from owners. Lack of incentive to help the business grow → less productive
e.g. Running a family-owned coffee shop with only one branch means workers are closer to the owners so feel more motivated to help the business grow
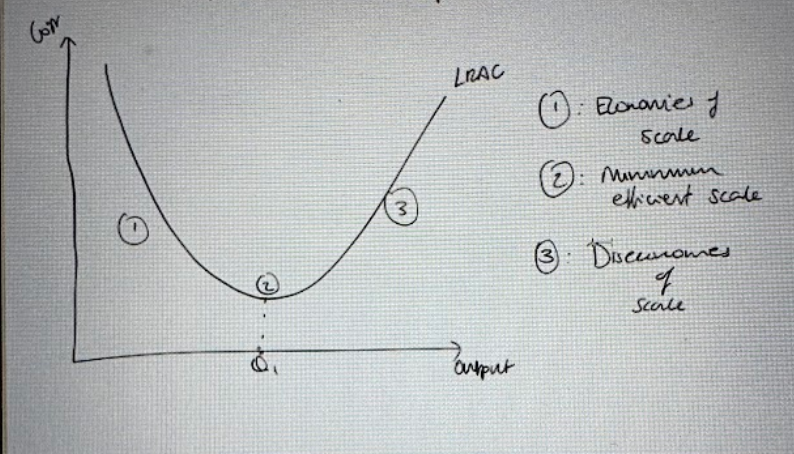
LRAC Diagram (showing E/DOS & MES)
L-Shaped Average Cost Diagram
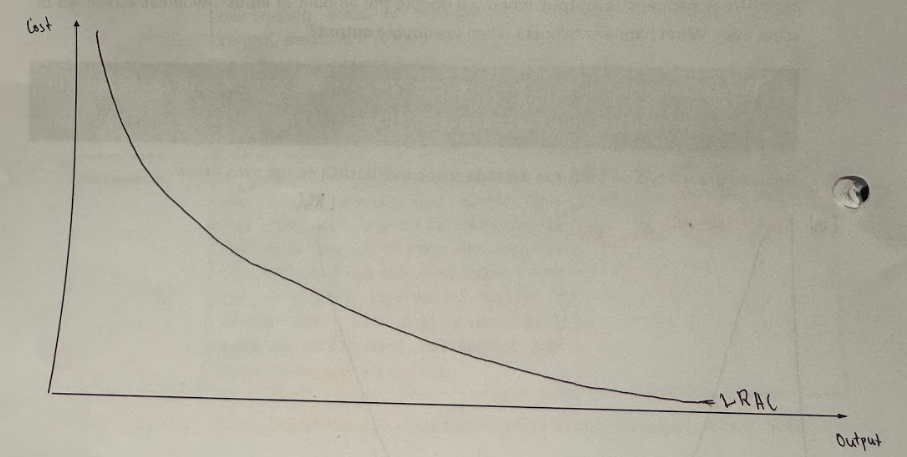
Why do some firms have an L-Shaped LRAC
Firms with very large startup costs (e.g. licences, infrastructure like train tracks) means that average costs always fall as output rises, even in the LR.
Minimum Efficient Scale =
The lowest level of output at which the long-run average cost is at its lowest.
minimum point on LRAC curve
Total Revenue =
All the money made from all sales
= Price x Quantity
Average Revenue =
Money from sales per item sold
= Total Revenue / Quantity
Why is the average revenue curve the same as the firm’s demand curve
Average Revenue is the same as Price.
Since the demand curve maps the price consumers are willing to pay for given quantities, AR and demand are the same, with both representing the price per unit at any output level.
Profit =
Total Revenue - Total Costs
Marginal Revenue =
Additional money made from each extra item sold
= Change in Total Revenue / Change in Quantity
AR & MR on Diagram
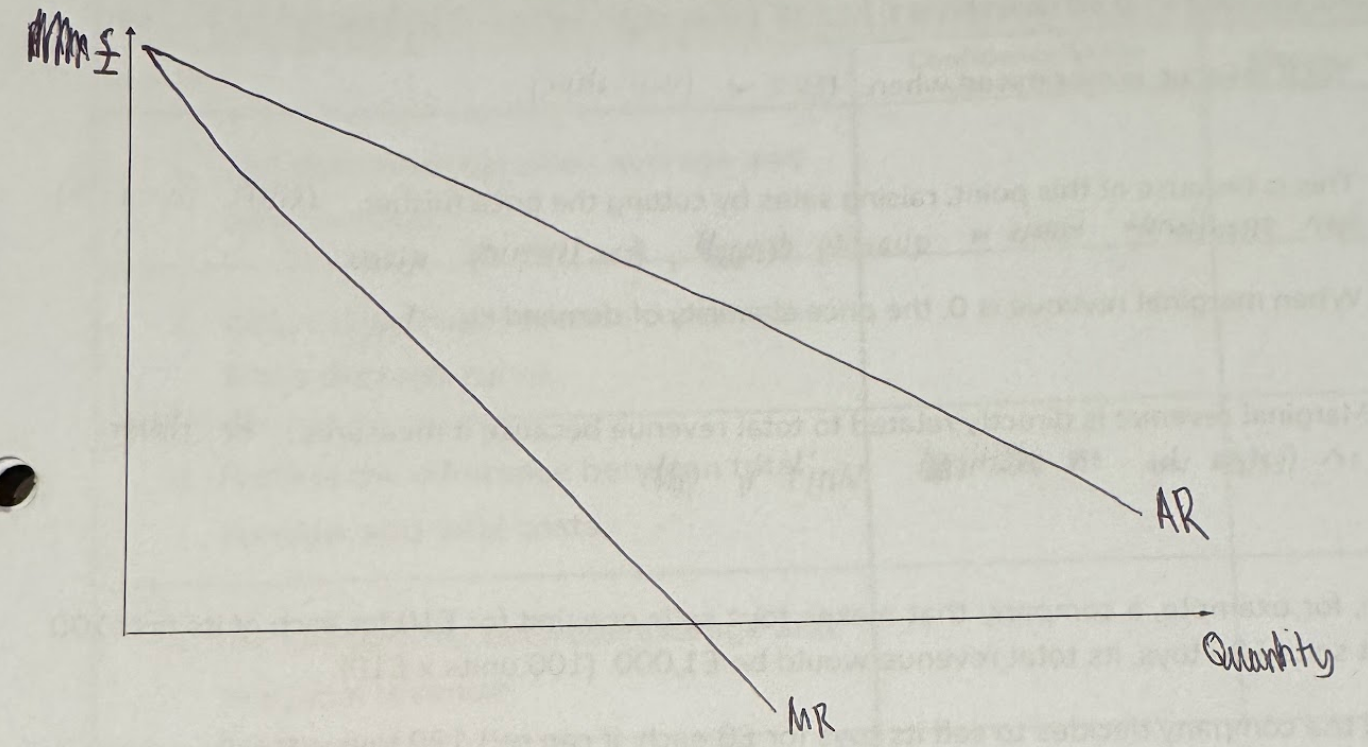
Why is the MR curve below/steeper than AR
Because to sell one additional unit, the firm has to lower the price on ALL units sold, not just the additional one.
So marginal revenue is lower than the price of the additional unit sold.
When is Total Revenue Maximised?
When MR = 0 or PED = -1
Profit =
Difference between revenu and costs when revenue exceeds costs
= Total Revenue - Total Costs
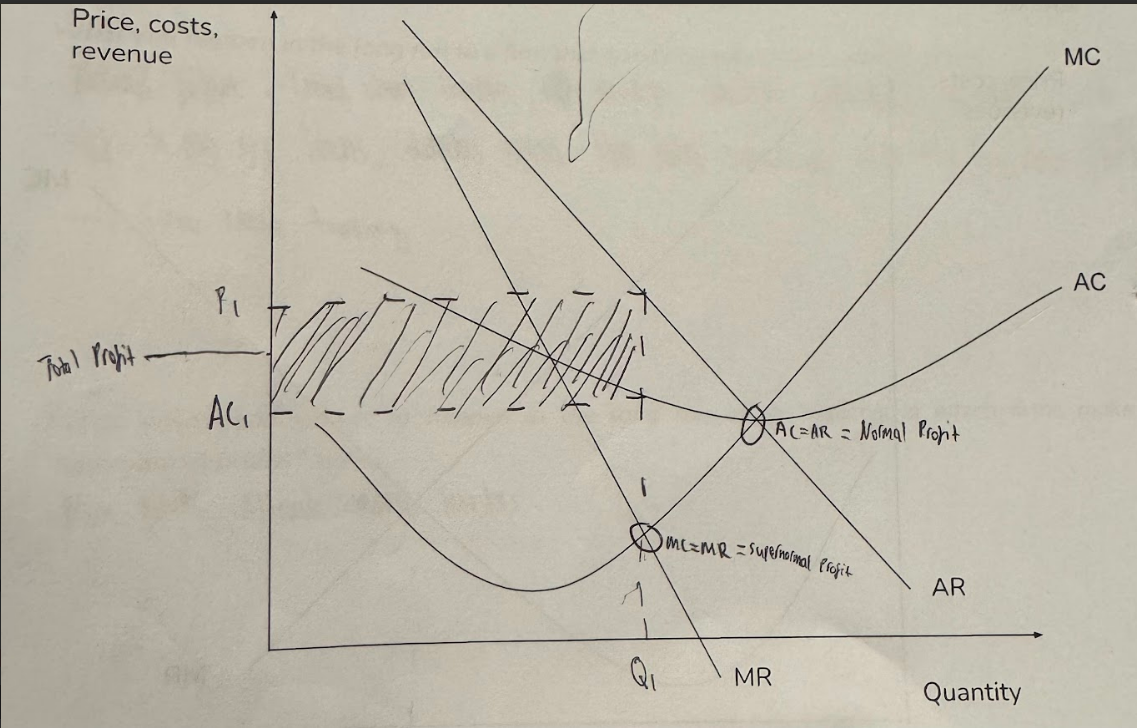
Normal Profit =
The quantity of profit sufficient to compensate investors for their opportunity cost
AR=AC
Supernormal Profit
Profit left over after compensating investors for their opportunity cost
AR>AC
Subnormal Profit
Not enough profit to compensate investors for their opportunity cost
AR<AC
Supernormal & Normal Profit on Monopoly Diagram
Area of Total Profit?
Roles of Profit in a market economy
Reward for taking risks:
Dividends paid to shareholders → compensates investors for their opp cost
Rewards for other stakeholders:
Bonuses paid to leaders/executives
Bonuses paid to workers → acts as incentive to work harder → increases worker productivity
Source of Finance for Spending:
Supernormal profit can be reinvested back into the business to grow
e.g. R&D to improve QQE of CELL
Promote a more efficient allocation of resources:
Signalling function of price mechanism - As consumer demand ↑, price of good ↑ → Higher price signals a high profit being made
→ Incentive function → As firms are profit-seeking, this signal acts as an incentive for firms to enter the market or for incumbent firms to increase production
More resources now allocated to a market where consumer demand is high, increasing allocative efficiency → ↑ social welfare
Tax revenue for gov:
Corporation tax charged on profit
Invention =
Discovery or creation of something brand new
Innovation =
Improvement of something that already exists, or implementation to another problem.
i.e. Taking an invention and applying it in a way that creates value by improving upon it, or finding new uses for it.
Technological Change =
The overall effect of invention, innovation and the diffusion/spread of technology in an economy over time.
Technological Change Effects on Production
Methods of Production:
More switch from labour intensive to capital intensive production
More automation (where production process is controlled by machinery)
Productivity:
Increases labour productivity - workers have better technology to work with
Increases capital productivity - improved machinery
Costs of Production:
Average costs of production will fall over time
Shift DOWNWARDS of AC
Different Types of Innovation (definition, effect on markets, example)
Sustaining = New products or methods are similar or complementary to existing ones.
→ Existing markets are developed (e.g. more competition, cheaper products, more variety)
e.g. Refrigeration allows more sale of perishable food,
Disruptive = New products or methods replace or are substitutes for existing ones.
→ Existing markets are destroyed, new markets are developed
e.g. Video streaming (Netflix) made video rental shops (Blockbuster) obsolete
Technological Change Influence on Market Structures
Makes markets MORE COMPETITIVE:
Lowers entry costs → lower barriers to entry
e.g. Invention of internet enabled e-commerce - retail businesses no longer need to set up physical shop
Undermines economies of scale - Allows firms to access cost savings regardless of size
e.g. Music making - previously had to rent expensive studio sessions to record music, now can just use apps on phone/laptop
Lower costs of production → Lower fixed costs allow more small firms to survive and more to enter the market → Supply shifts right
Makes markets LESS COMPETITIVE:
Large firms may have exclusive access to innovations - they have the capital to purchase these specialised machinery
→ May actually widen barriers to entry
e.g. Apple has well-established technical expertise