STATS OCR A LEVEL MATHS
 Note
Note Call Kai
 Learn
Learn Practice Test
 Spaced Repetition
 Match
Match Flashcards
 Knowt Play
1/46

There's no tags or description
Looks like no tags are added yet.
Name | Mastery | Learn | Test | Matching | Spaced | Call with Kai | Chat |
|---|
No analytics yet
Send a link to your students to track their progress
47 Terms
Statistical Sampling:
What is a census and what are the downfalls
A question asked of the whole population
It is expensive, time consuming, and sometimes biased if certain people do not respond
Statistical Sampling:
Discrete data means
Distinct categories
Aka shoe sizes
Statistical sampling:
Continuous data means
Ever increasing levels of accuracy
Aka the exact length of your foot
Statistical sampling
Quantitative data
Has a numerical value
Statistical sampling:
Qualitative data
Is worded
Statistical sampling:
The Simple Random method
Downfalls + positives
-assign numbers to everything in a population
-select random numbers with a raffle or random number generator
-remove any repeats
Ideal for self-contained areas, but time-consuming with large populations
Statistical sampling:
Systematic method
Downfalls and positives
-Assign numbers to everything
-pick every nth person
Has a periodic nature so is useful for finding patterns
Could be biased if every nth item is the same.
Statistical sampling:
Stratified method
Downfalls and positives
Select a sample of n that proportionally represents all categories
Can be costly trying to find populations from different categories
Can focus attention on particular areas to see if that influences results
Statistical sampling:
Quota method
Downfalls and positives
Find people from two categories
Make them do the questionnaires to meet the quota
Not randomly selected, must fill quota before finishing sample
It is cost effective
Statistical sampling:
Opportunity method
Downfalls and positives
Stand in the street with a clipboard
Very biased
Self contained, fast, cost efficient, no quota
Statistical sampling:
Cluster method
Downfalls and positives
Split the samples of people into clusters (group similar items together)
Easy but there could be a key difference in the clusters you are comparing
Statistical sampling:
Self-selection
Volunteered responses
Cost efficient, fast
Can attract a certain type of opinionated people
Probability:
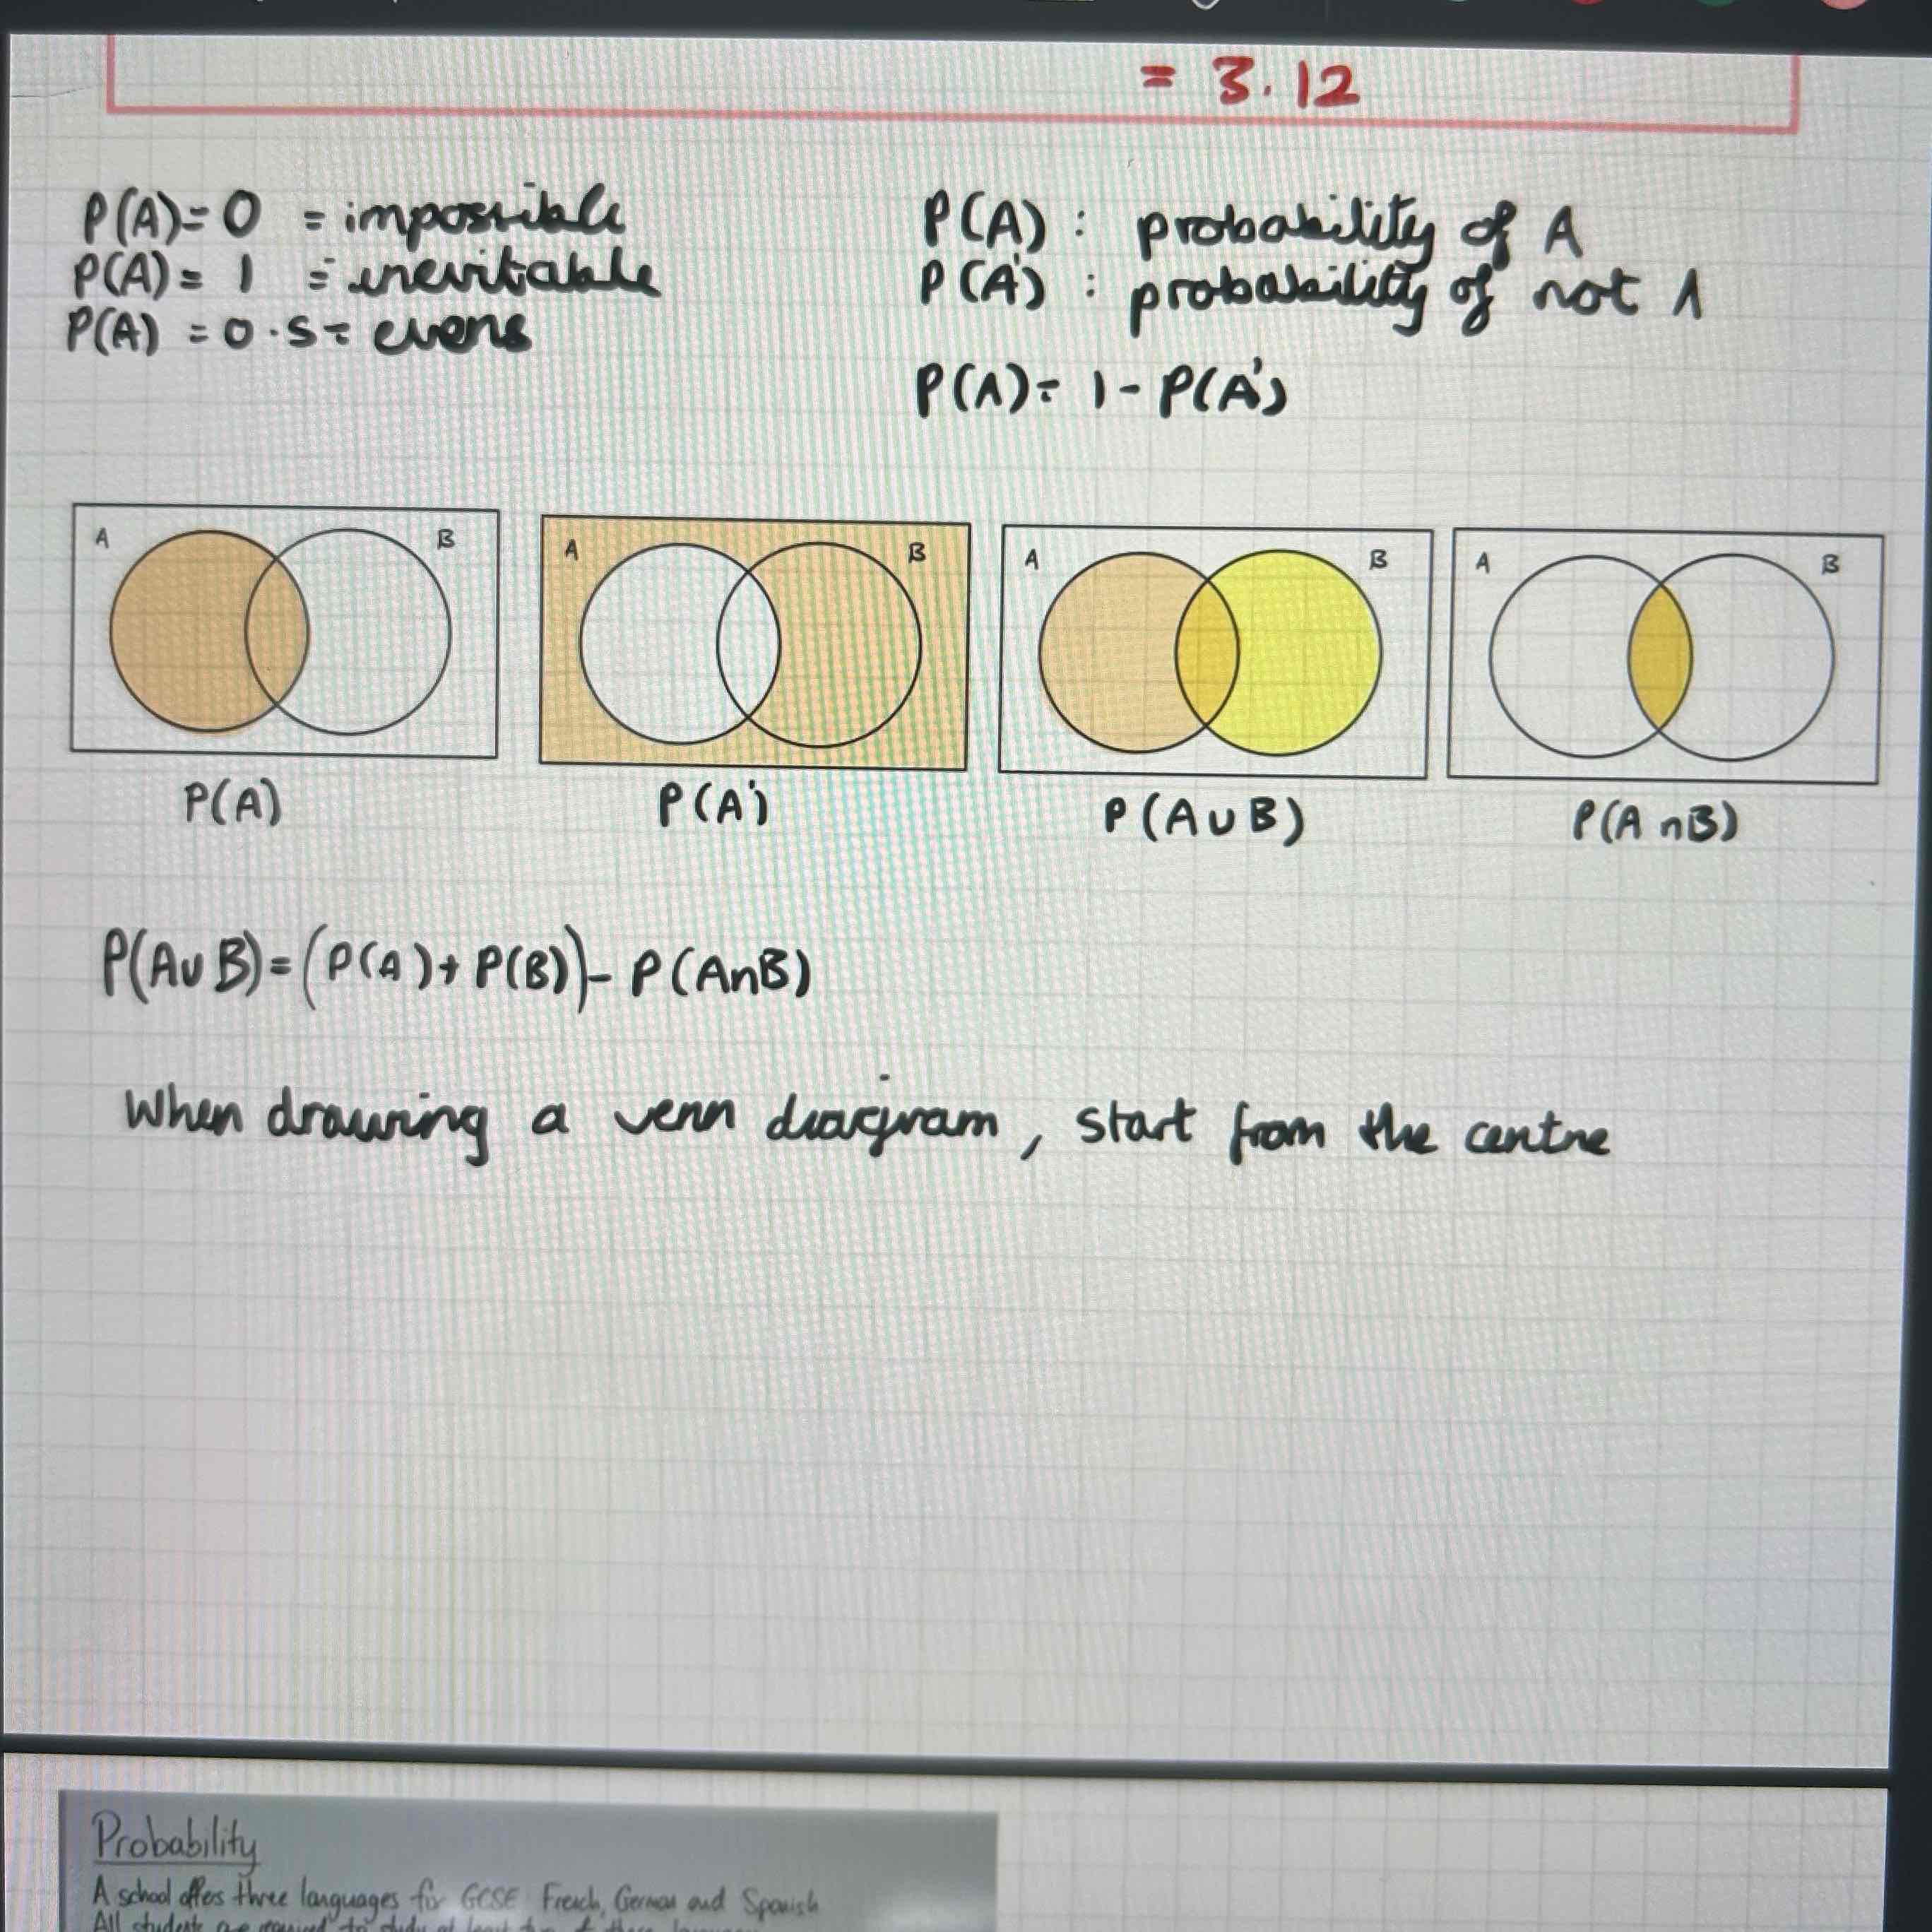
P(AuB)=
(P(A)+P(B))-P(AnB)
Probability:
When drawing a venn diagram, writing in values, start with
The central overlap
Probability:
P(AnB)=
(P(A)+P(B))-P(AuB)
Or use a venn diagram visually
Or P(A) x P(B)
Probability:
If two events are independent
P(AnB)= P(A) x P(B)
P(A|B)=P(A)
Probability:
Two events are mutually exclusive
P(AnB)=0
Probability:
P(A|B)=P(AnB)/P(B)
Probability:
For binomial distribution to be valid
There must be a fixed no. of trials
Two outcomes
Each event must be independent
Probability must be constant
Presentation:
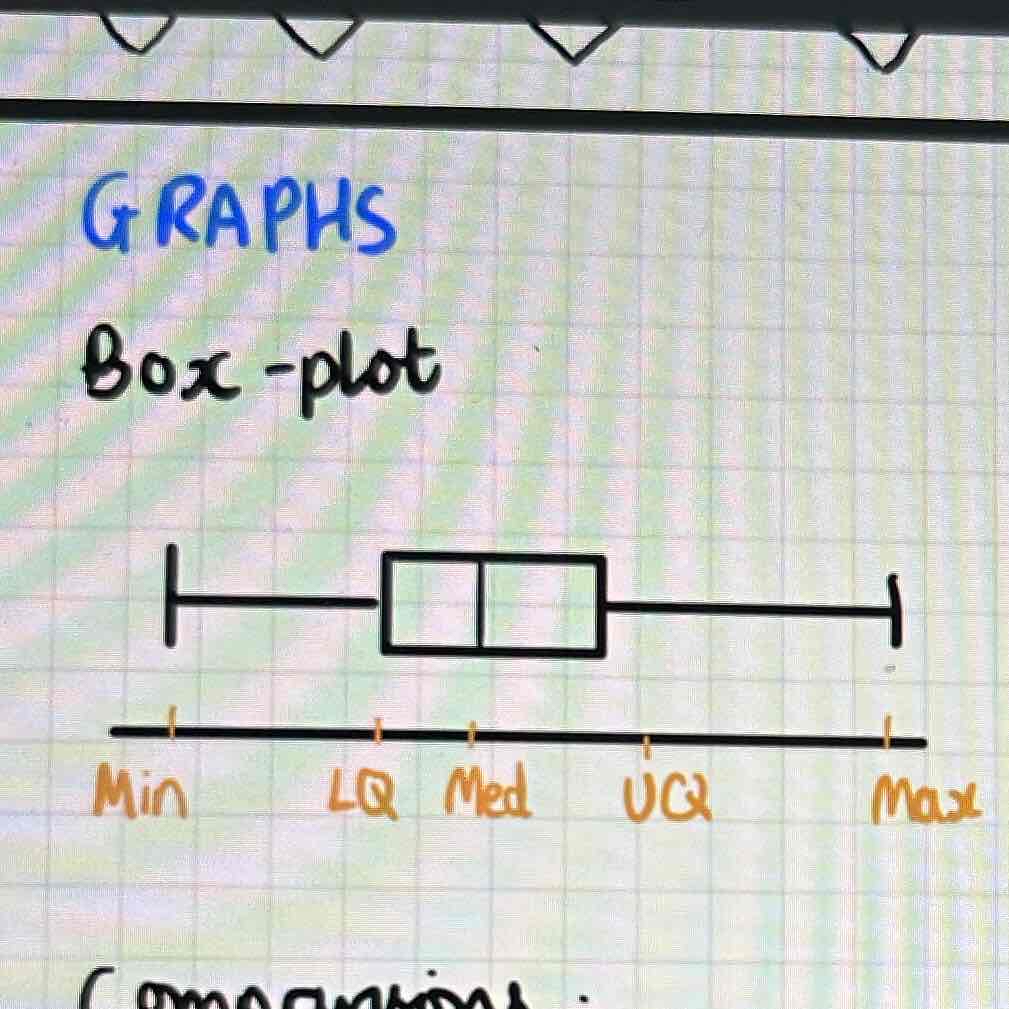
Box plot
Has min, LQ, median, UQ, max
Graphs:
how to find outliers on a box plot
Upper outliers: UQ+1.5(IQR)
Lower outliers: LQ-1.5(IQR)
Graphs:
Comparing box plots
Compare medians to discuss average
Compare IQR to discuss consistency
Compare difference in min and max to discuss performance
Graphs:
Drawing cumulative frequency curves
Find the cumulative frequency by adding the frequencies going along the table of x values
Plot CF-x and find the curve
Graphs:
Finding the median, LQ and UQ of the cumulative frequency graph
Median: CF/2 so find the x-value at CF/2
LQ: CF/4 so find the x value
UQ: CF x ¾ so find the x value
Graphs:
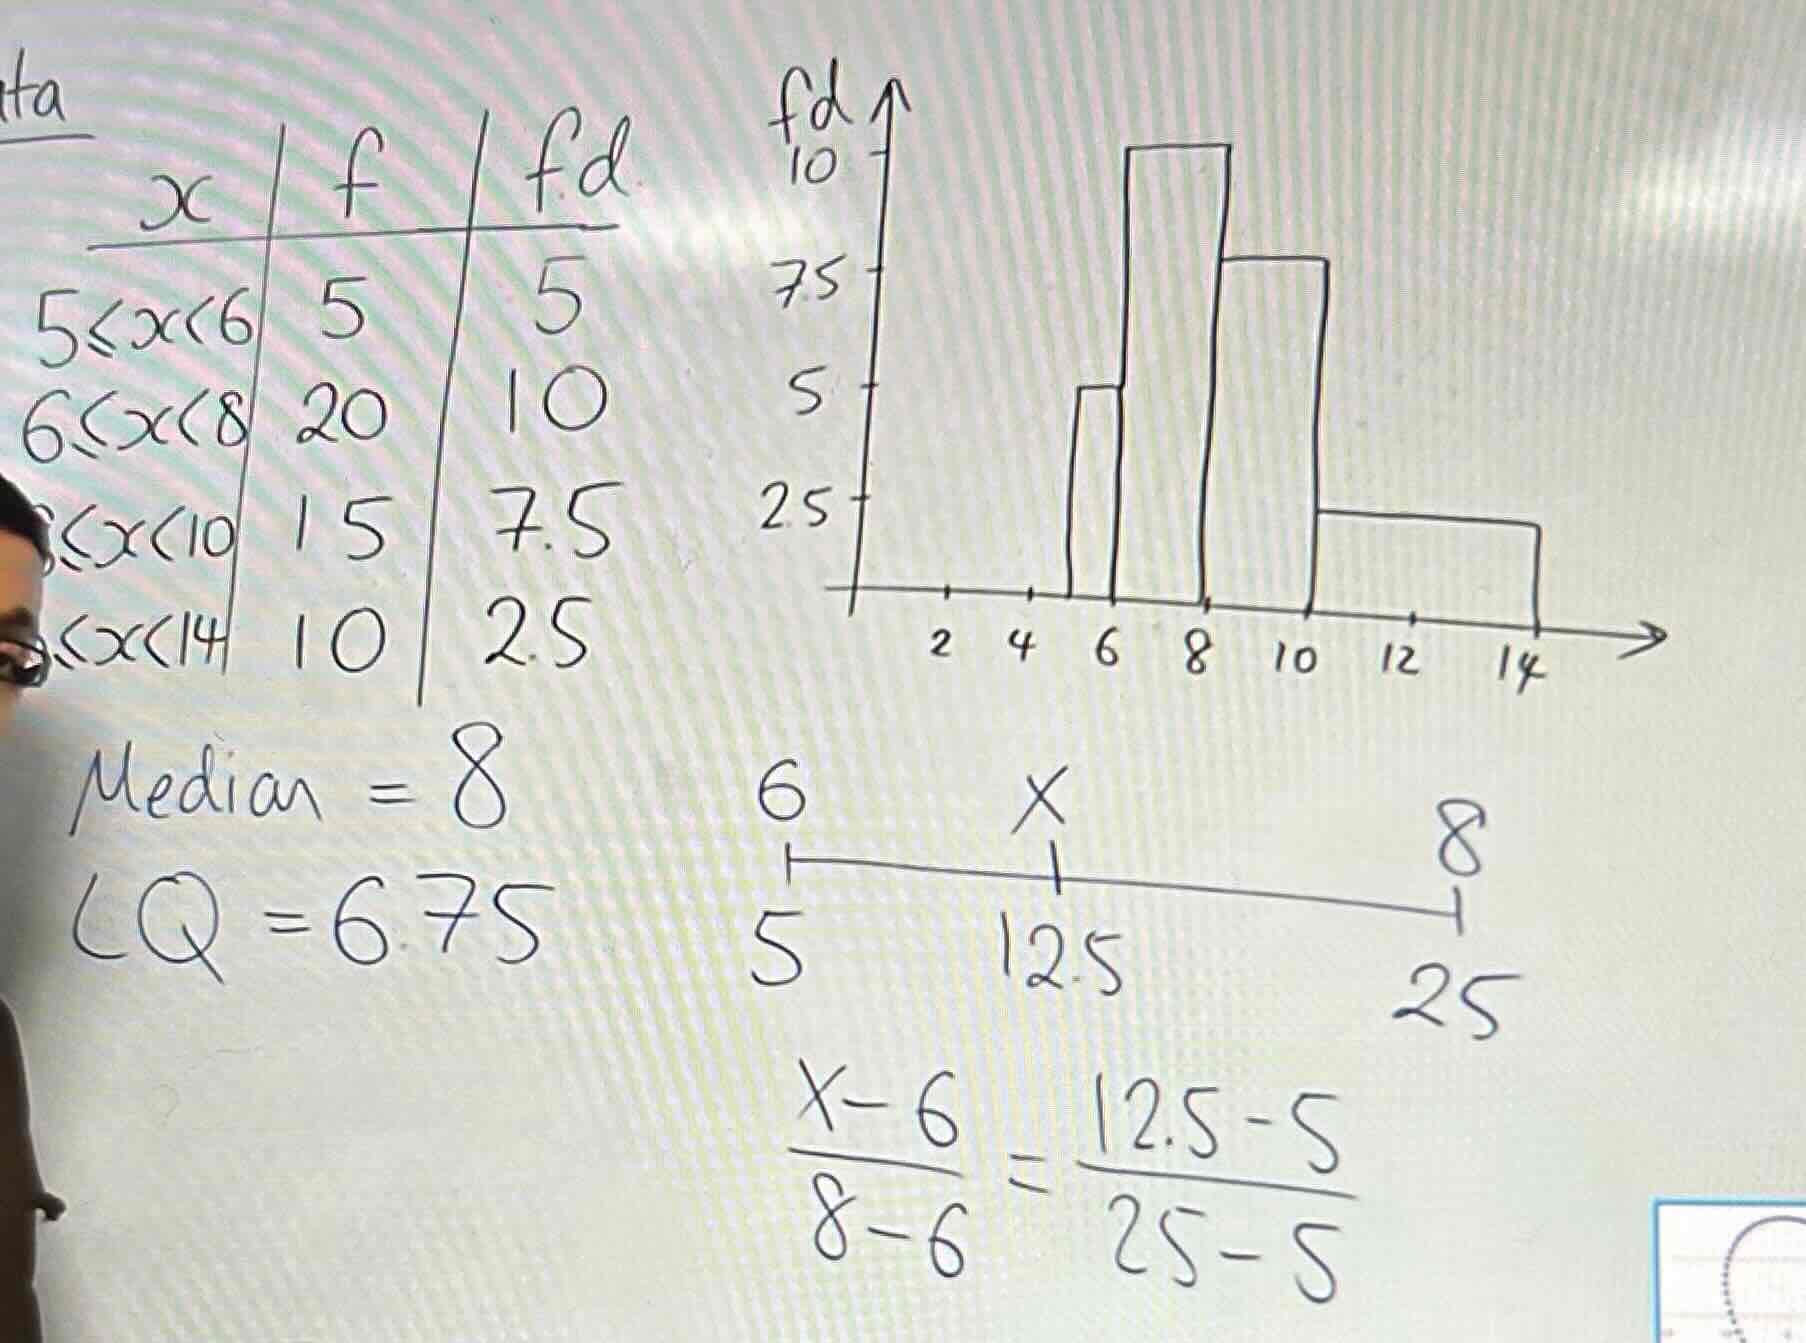
Drawing a histogram
Find the frequency density for the table
Frequency density= f/class width
Plot fd-x
Area of the boxes= k (frequency)
Often k is 1 but check
Graphs:
Find median, LQ and UQ for a histogram
Find the the sum of the frequencies
find the sum of F/ 2 which equals a constant a
So the a^th value along is where the median lies
So do (X-lower part of inequality)/( upper - lower part of inequality)= (a-lower value of inequality)/(upper- lower value of inequality)
LQ: sum of F/4
UQ: sum of F x ¾
Bivariate data:
Definition and how to plot
Two variables, generally plotted with a scatter graph, with the independent variable horizontal and the dependent variable vertical
Bivariate data:
Correlation
-1<=r<=1
Where -1 is strong negative
1 is strong positive
0 is no correlation
Bivariate data
How to find PMCC
Use given formula in booklet
Sxy/ (sqrt Sxx Syy)
Or
Calculator:
Stats, x in left column, y in right column, CALC, REG, X, a+bx, r=…
Or
Guess between -1<=r<=1 looking at correlation
Bivariate data:
Regression line is .. and how to find it
An optimal line of best fit
y-y_=b(x-x_)
find x_ and y_ therefore the regression line must go through (x_,y_)
Find b on calculator using STATS, x first column, y second column, CALC, REG, X, a+bx, b=…
Draw the regression line using y=b(x-x_)+y_
Bivariate data:
Interpolation and extrapolation meaning
Interpolation: anything inside the region is valid
Extrapolation: extending the region to guess a value
Discrete data:
Find the mean, mode, median, variance from discrete data
Mean= sum of x . Frequency/ n
Calc: STATS, first column x, second column F, CALC, SET, 1 var freq: List 2, exit, 1-VAR, x_=…
Discrete data:
Find the mode from discrete data
Look at the highest frequency
Discrete data:
Find the median, LQ, UQ
Find the sum of the frequencies
(Sum+1)/2= position of the median
Find the CF column
Identify where the median is and find its value
LQ: (sum/2 +1)/2= position of LQ
UQ: sum/2 + position of LQ
Grouped data:
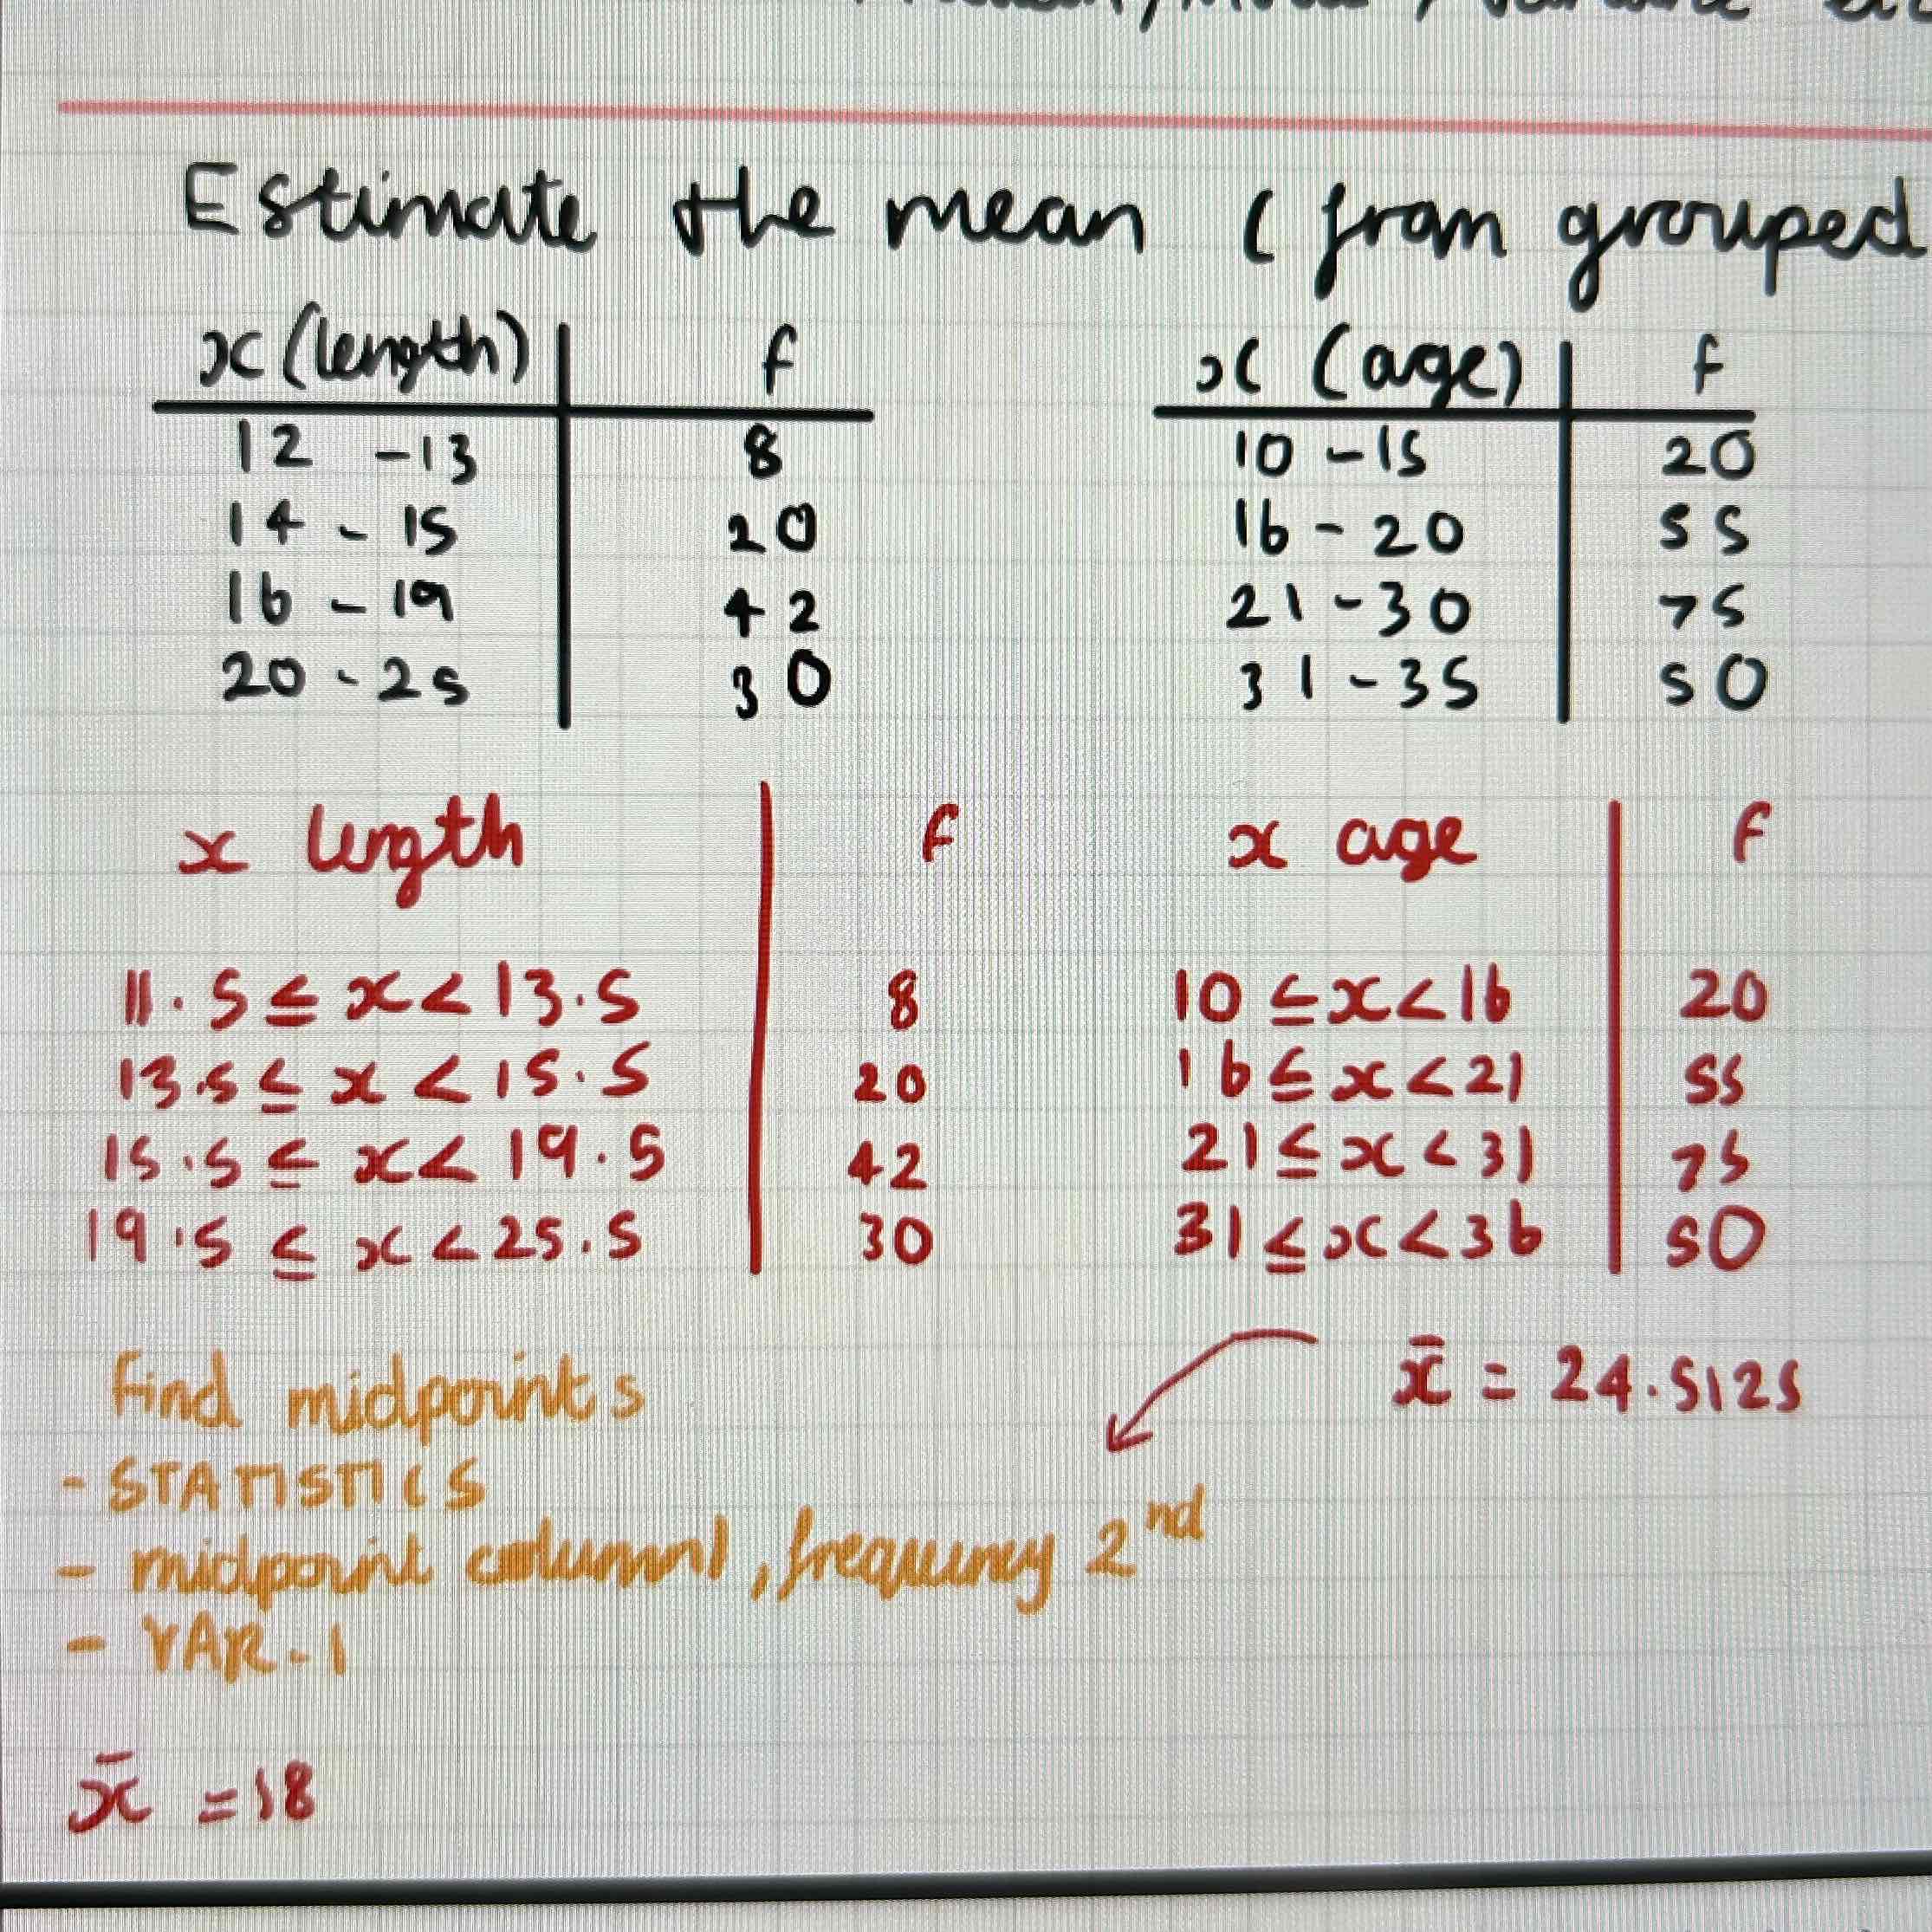
Estimate the mean
Estimate the mean is in the middle of the group
So find the midpoint for each inequality, use STATS, to find mean with midpoints in column 1 and frequency in column 2
If the inequalities aren’t continuous, rewrite so they are
With age always change the inequality aka 10<=x<=15 should be 10<=x<16
Grouped data:
Estimate the median, LQ, UQ
Find the cumulative frequency
Divide the cumulative frequency by 2 to find the position of the median
Find the median using linear interpolation
LQ: cumulative frequency/4
UQ: cumulative frequency x ¾
Comparing data sets:
What to say about median, IQR, variance
Median: discuss their average
IQR: discuss consistency
Standard deviation: discuss consistency
Variance and standard deviation:
Find the variance and s.d from a table of x values
Find the mean
Find the distance of each value from the mean
Square the distances
Find the sum of the squares of the distances
Divide by n=variance
So sqrt the variance= standard deviation
Use calc or given formula or remember this method
Standard deviation and variance:
Difference between ōx and sx
ōx is for population
sx is for a sample
linear coding:
Convert the mean and standard deviation from celsius to F’
Find the mean and standard deviation in terms of celsius
The mean should be effected by the multiplication and addition in the conversion formula
The standard deviation should only be multiplied or divided by the value in the conversion formula
Outliers:
Find outliers using quartiles
Find outliers using mean and standard deviation
Quartiles:
LQ-1.5(IQR)=outlier
UQ+1.5(IQR)=outlier
Mean and s.d:
mean-2(s.d)= outlier
mean+2(s.d)=outlier
Omit them if they are an outlier
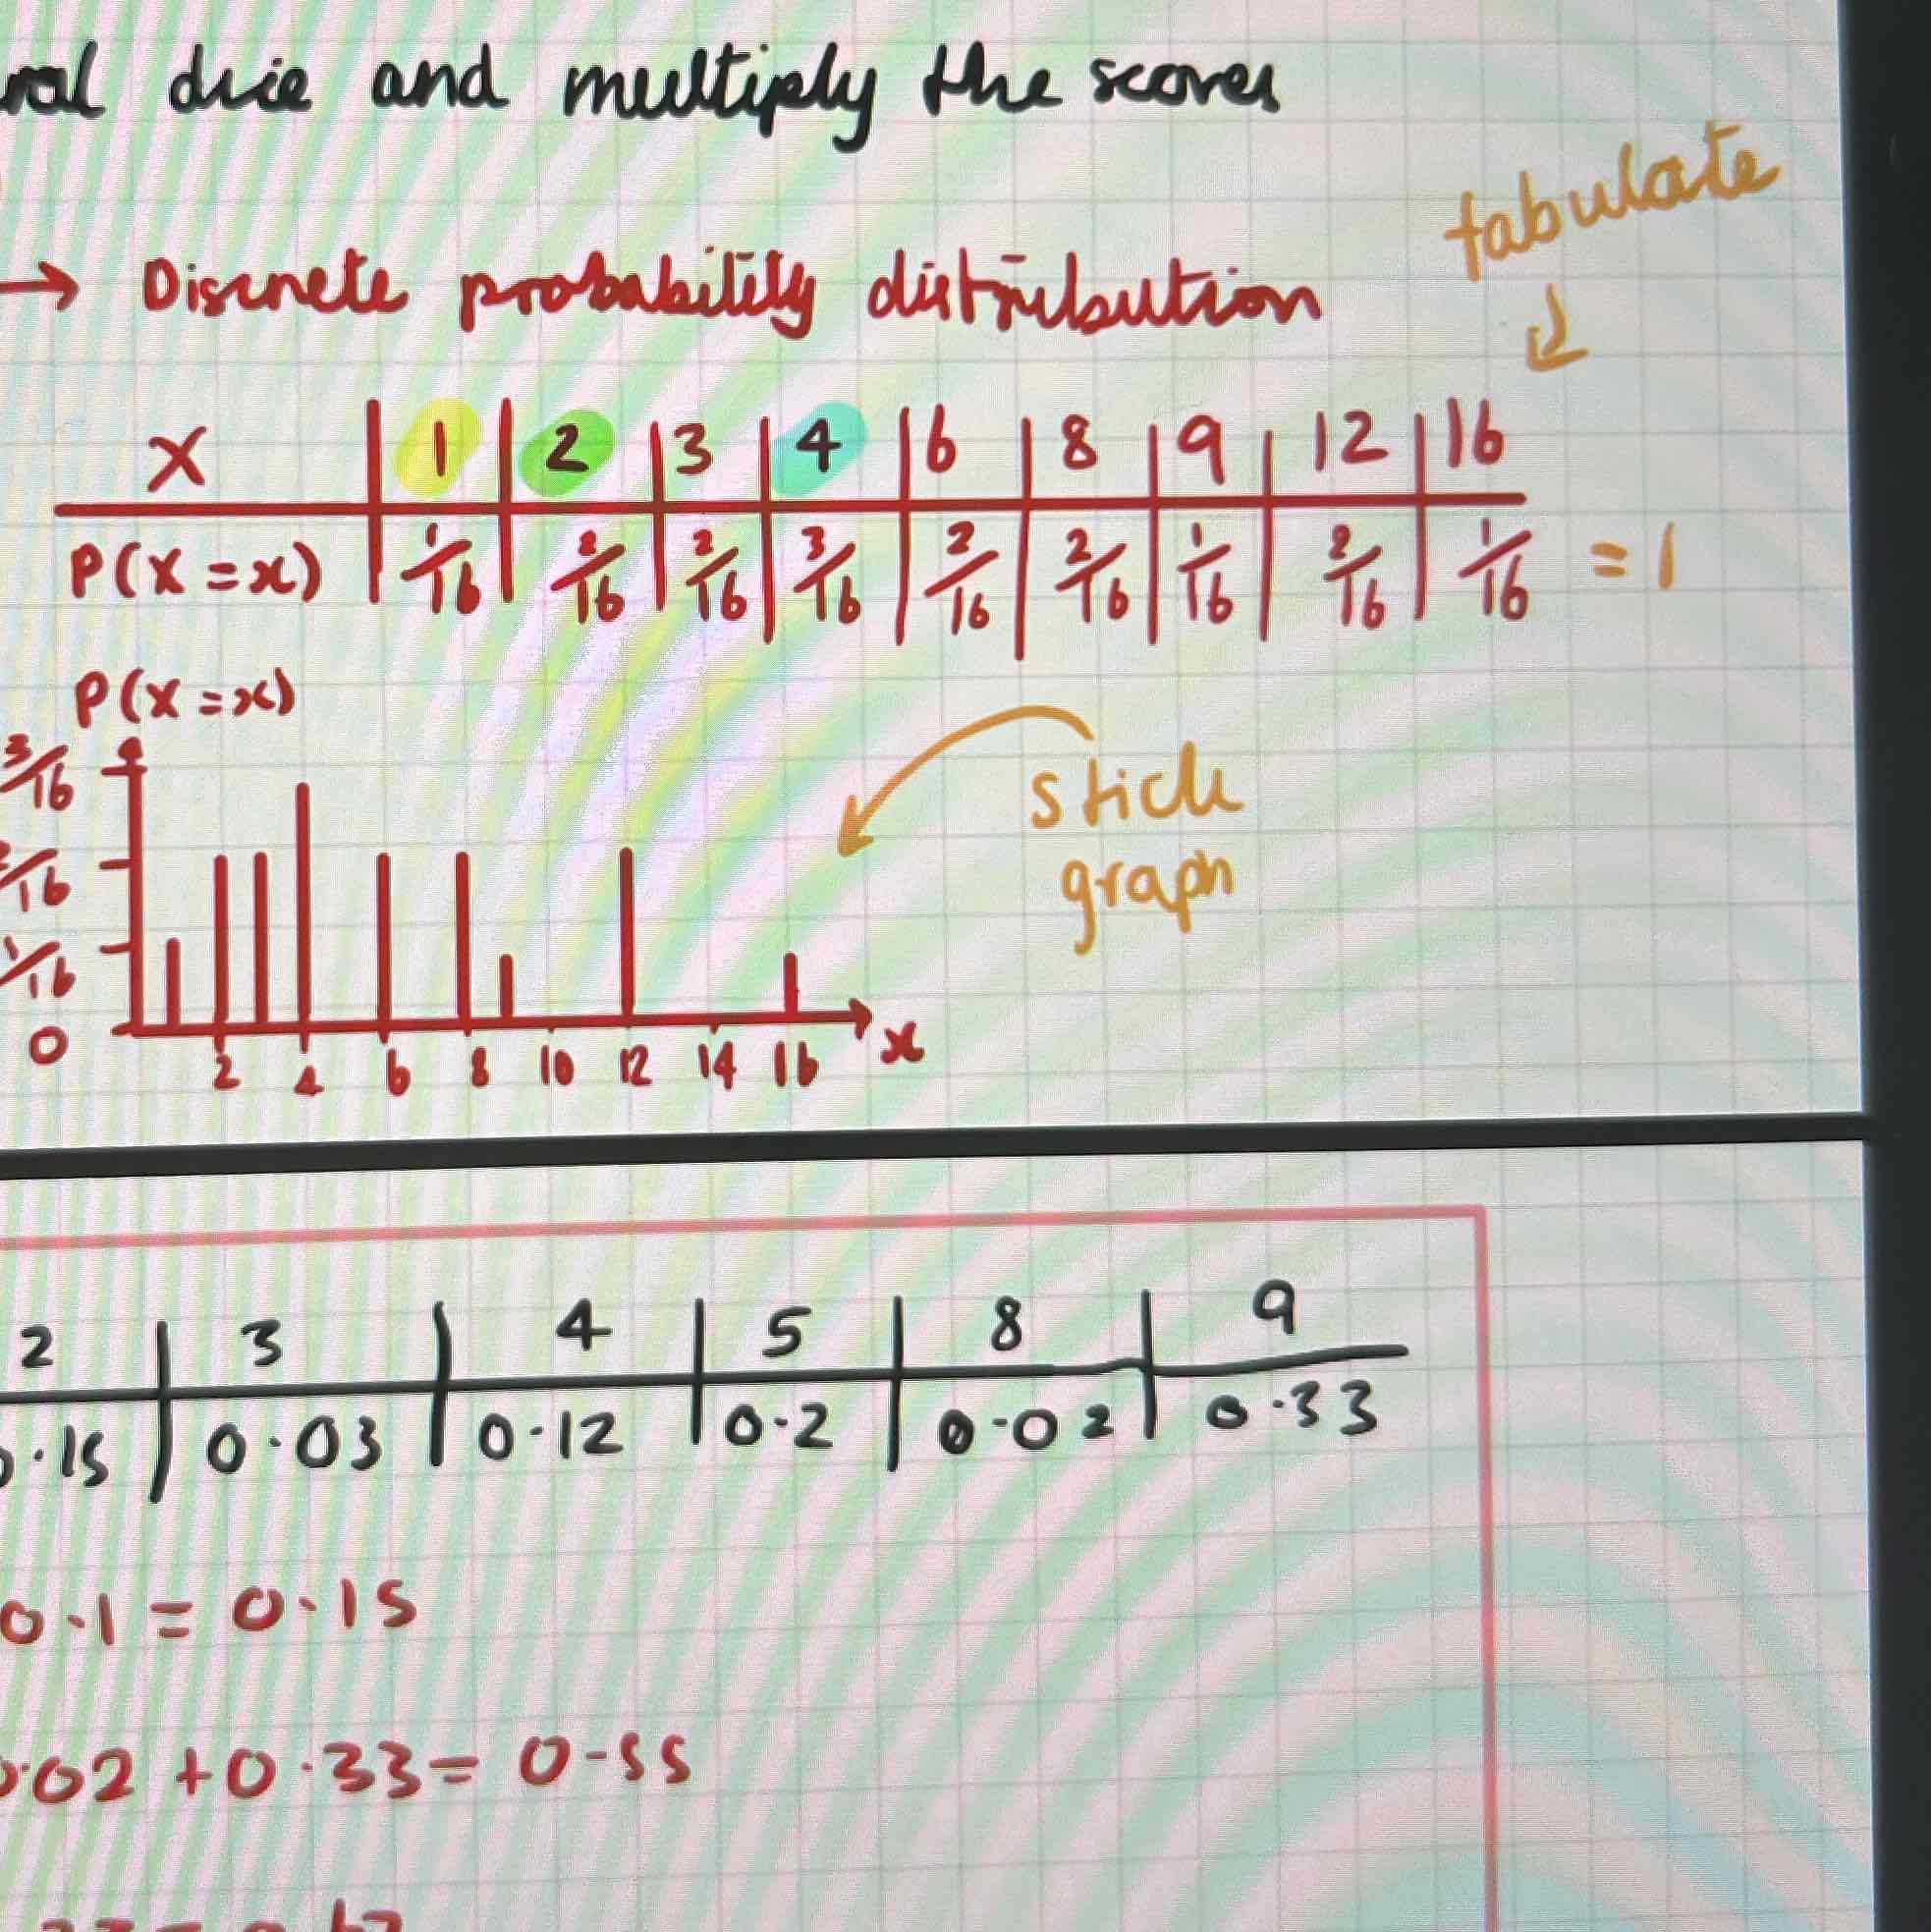
Discrete random variable:
Tabulate data
X (possible outcomes)
P(X=x) (probabilities) sum should= 1
Discrete random variables:
Stick graph
Tabulate data
Y-axis is P(X=x)
x-axis is X (outcomes)
Discrete random variables:
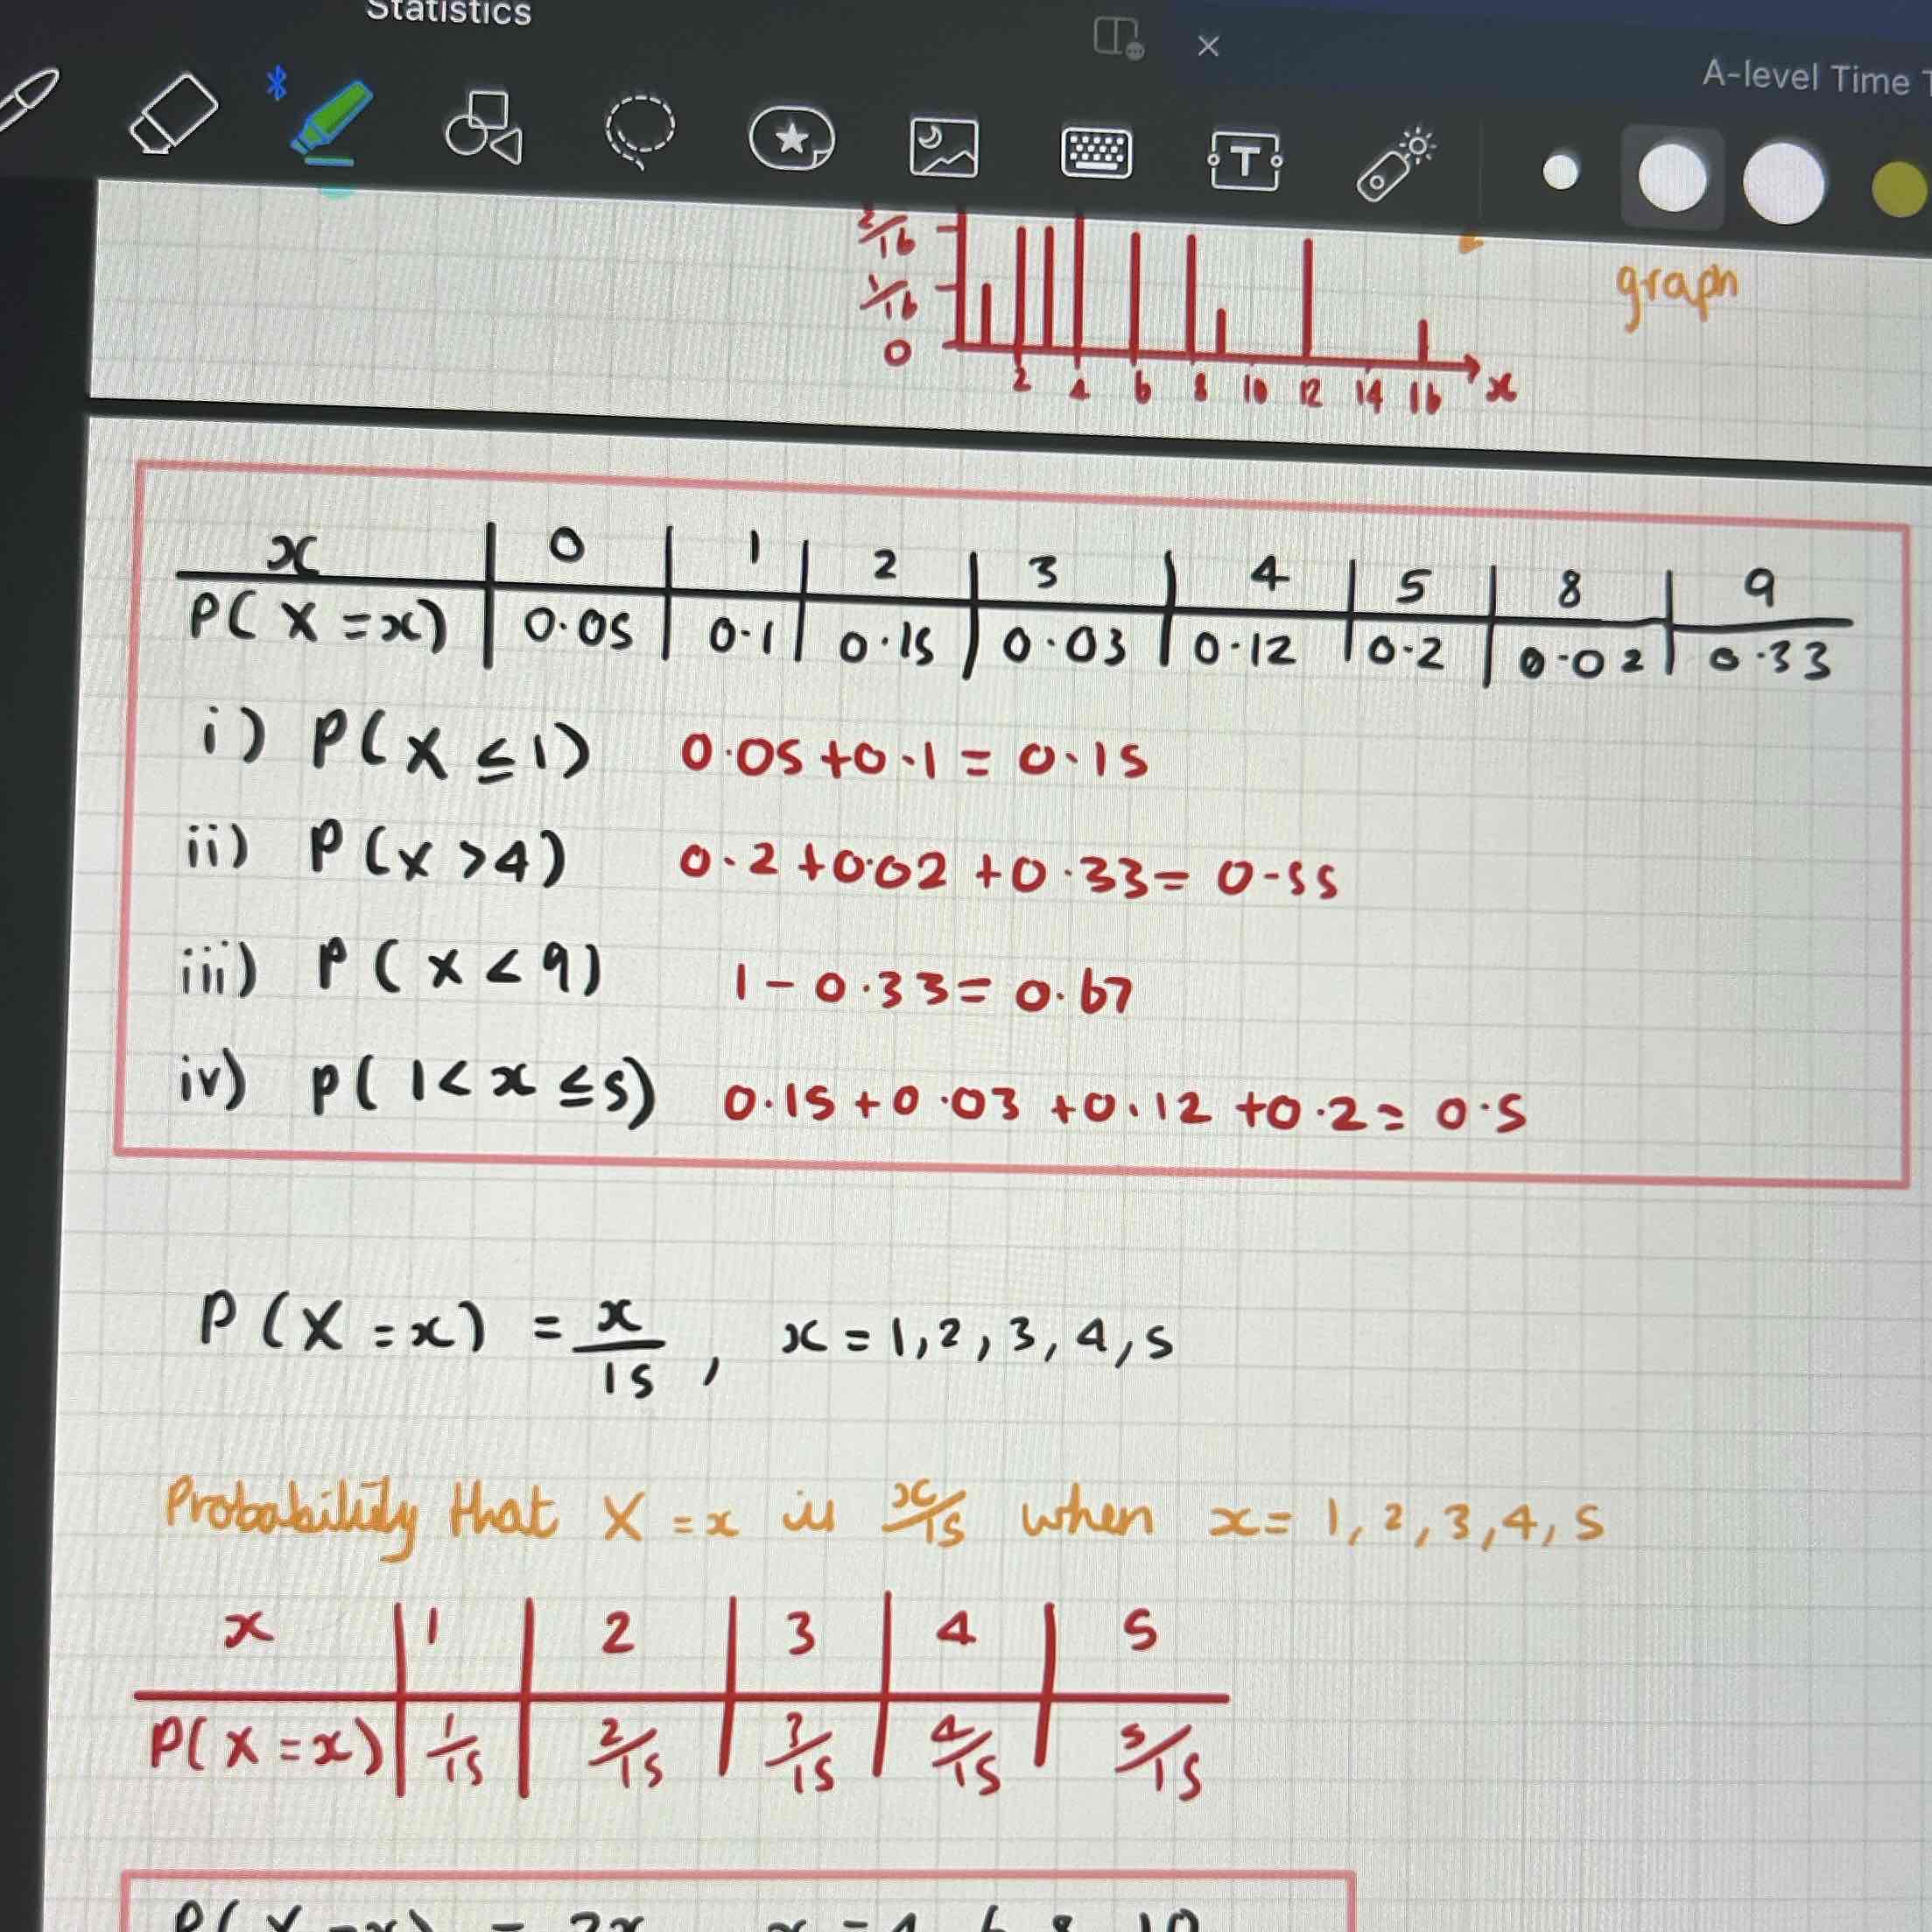
Find data from tabulated data
Discrete random variables:
Notation P(X=x)=x/15, x=1,2,3,4,5
Probability X=x is x/15 when x=1,2,3,4,5
Cumulative distribution function:
Tabulate
x (outcomes)
P(X=x) (probabilities)
F(x) (cumulative probabilities) with the last value in the row being 1
x must be whole for discrete data!!