2-02 Dealing with Data
0.0(0)
Studied by 0 peopleCard Sorting
1/8
There's no tags or description
Looks like no tags are added yet.
Last updated 5:21 PM on 6/4/26
Name | Mastery | Learn | Test | Matching | Spaced | Call with Kai |
|---|
No analytics yet
Send a link to your students to track their progress
9 Terms
1
New cards
Metric
A system of measurement using 10 as a base.
2
New cards
Data
Facts, observations and measurements collected for the purpose of analysis.
3
New cards
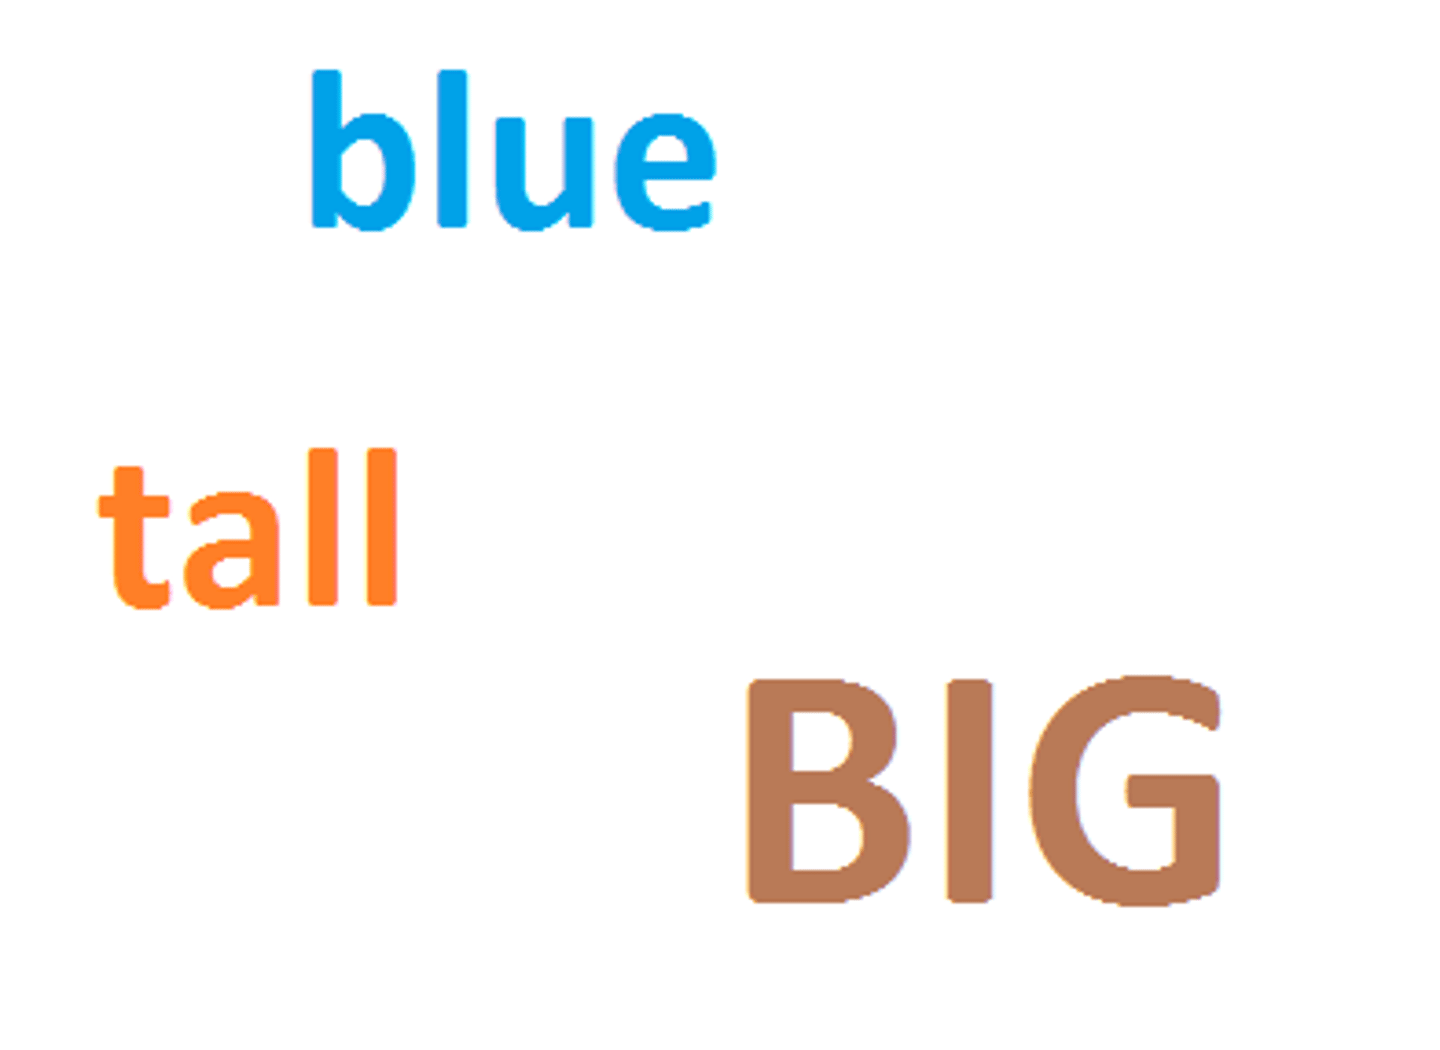
Qualitative Data
Descriptive data which indicates qualities observed.
4
New cards
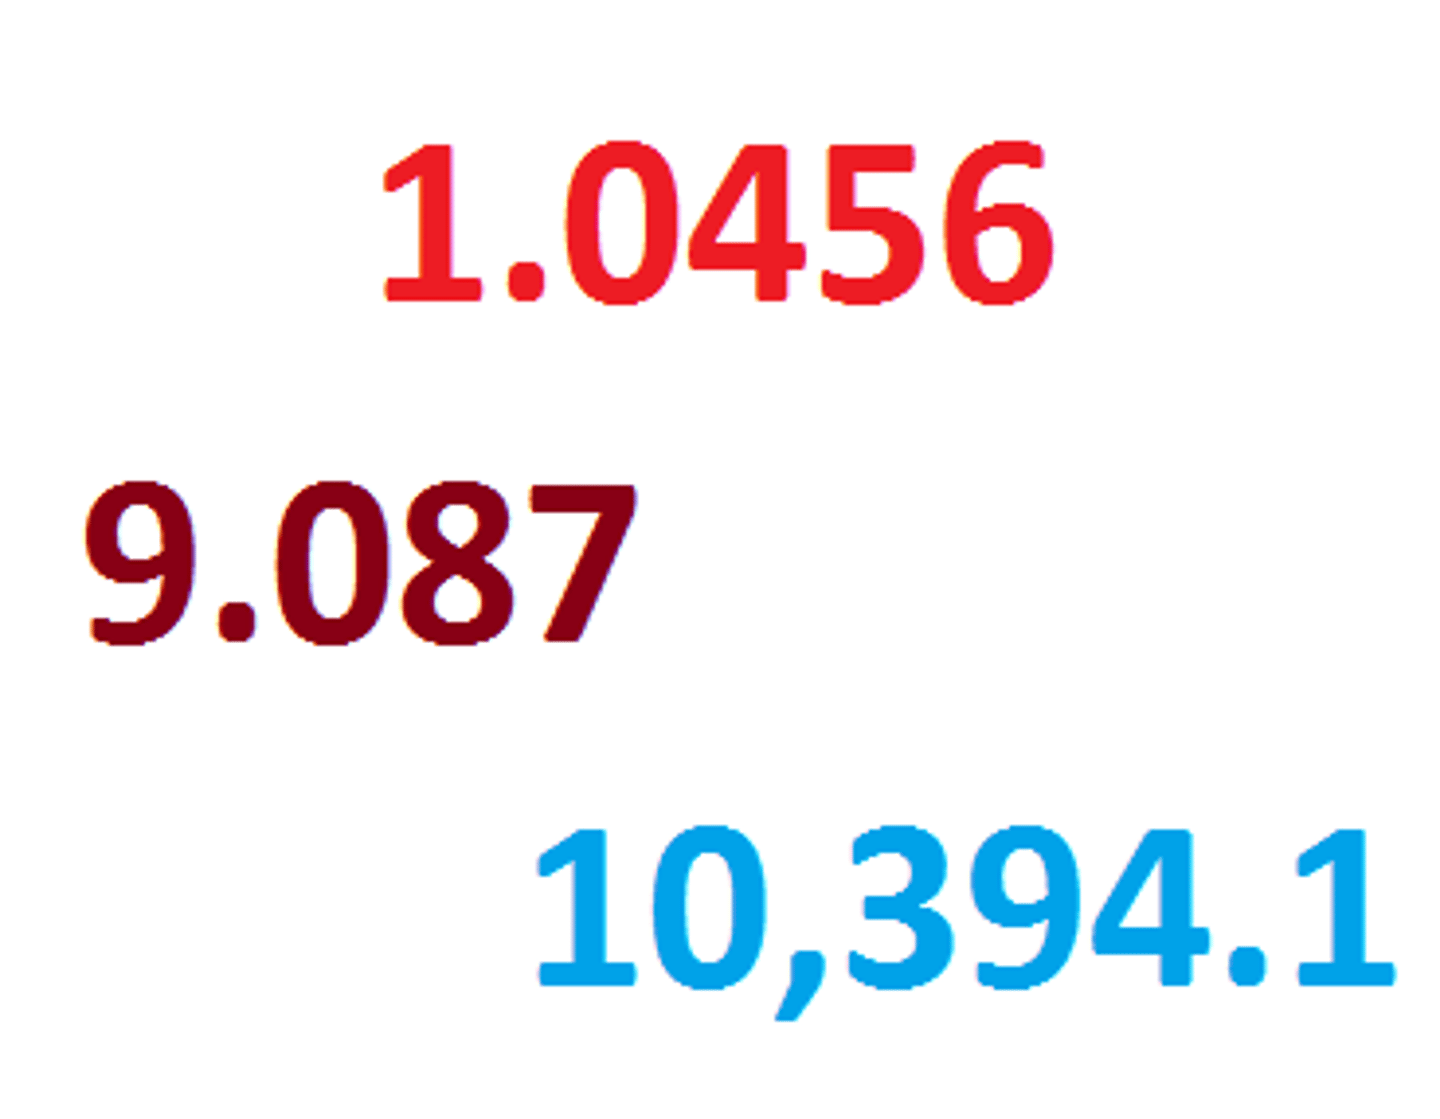
Quantitative Data
Numerical data which indicated quantities measured.
5
New cards
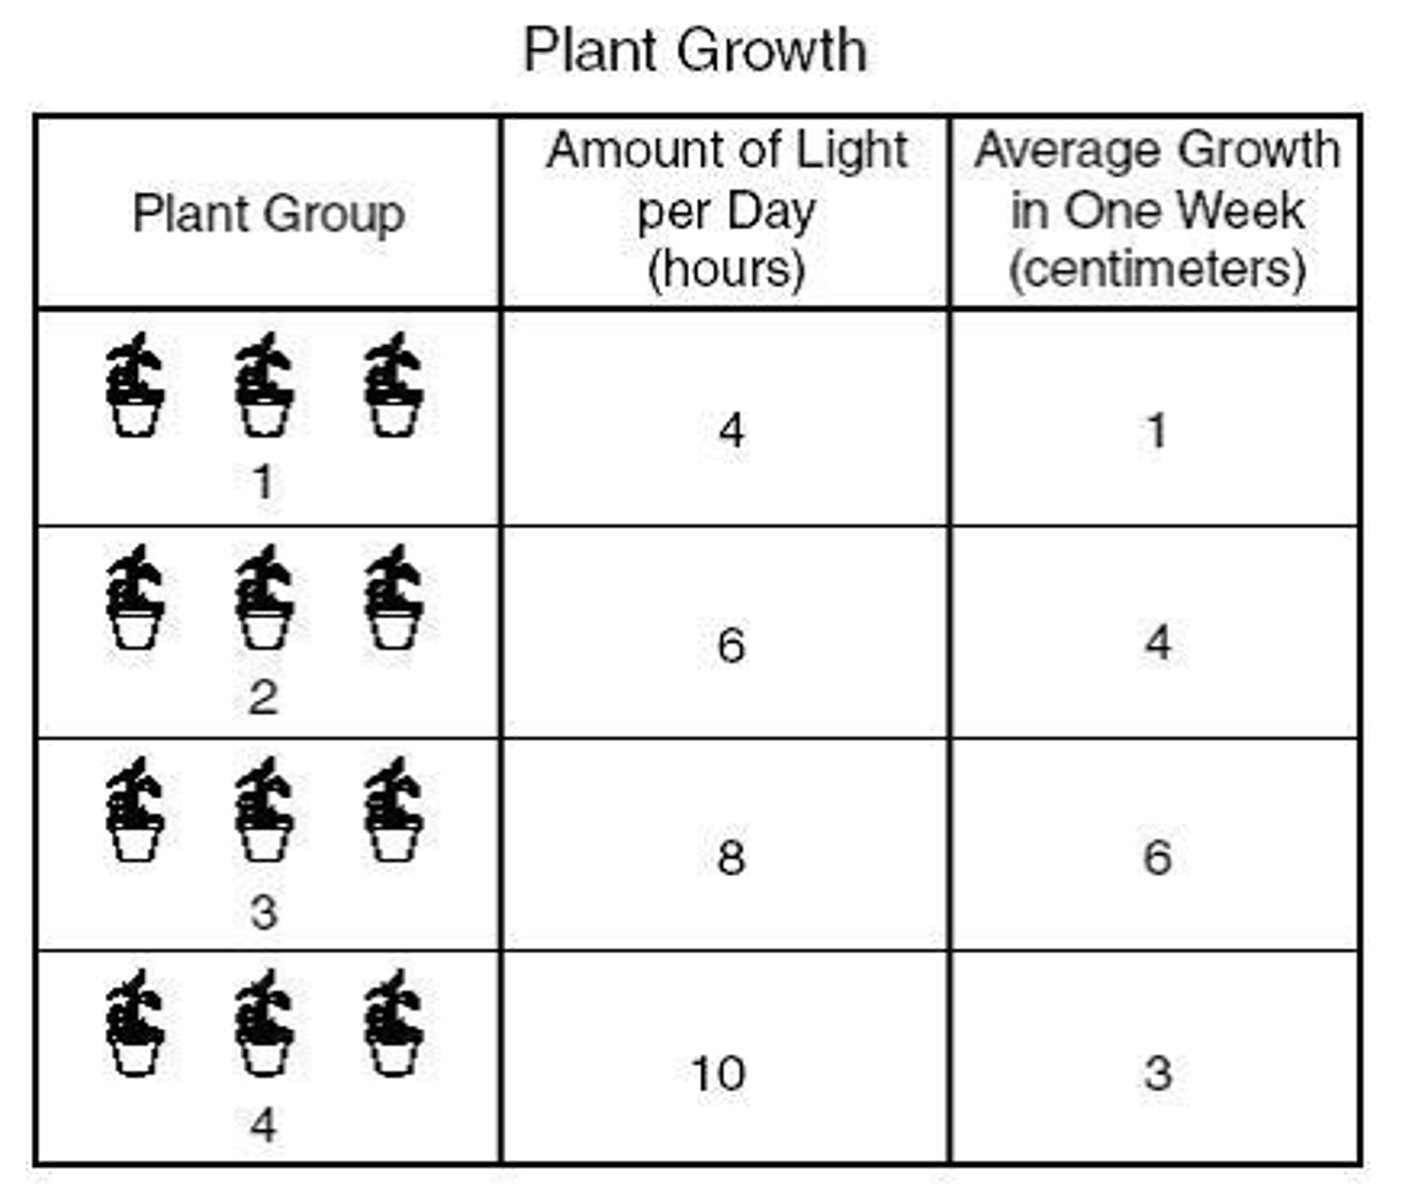
Data Table
A display of information with rows and columns labeled by headings. Keeps information organized and easier to analyze.
6
New cards
Graph
Visual representation of data that makes patterns and trends easier to see and analyze.
7
New cards
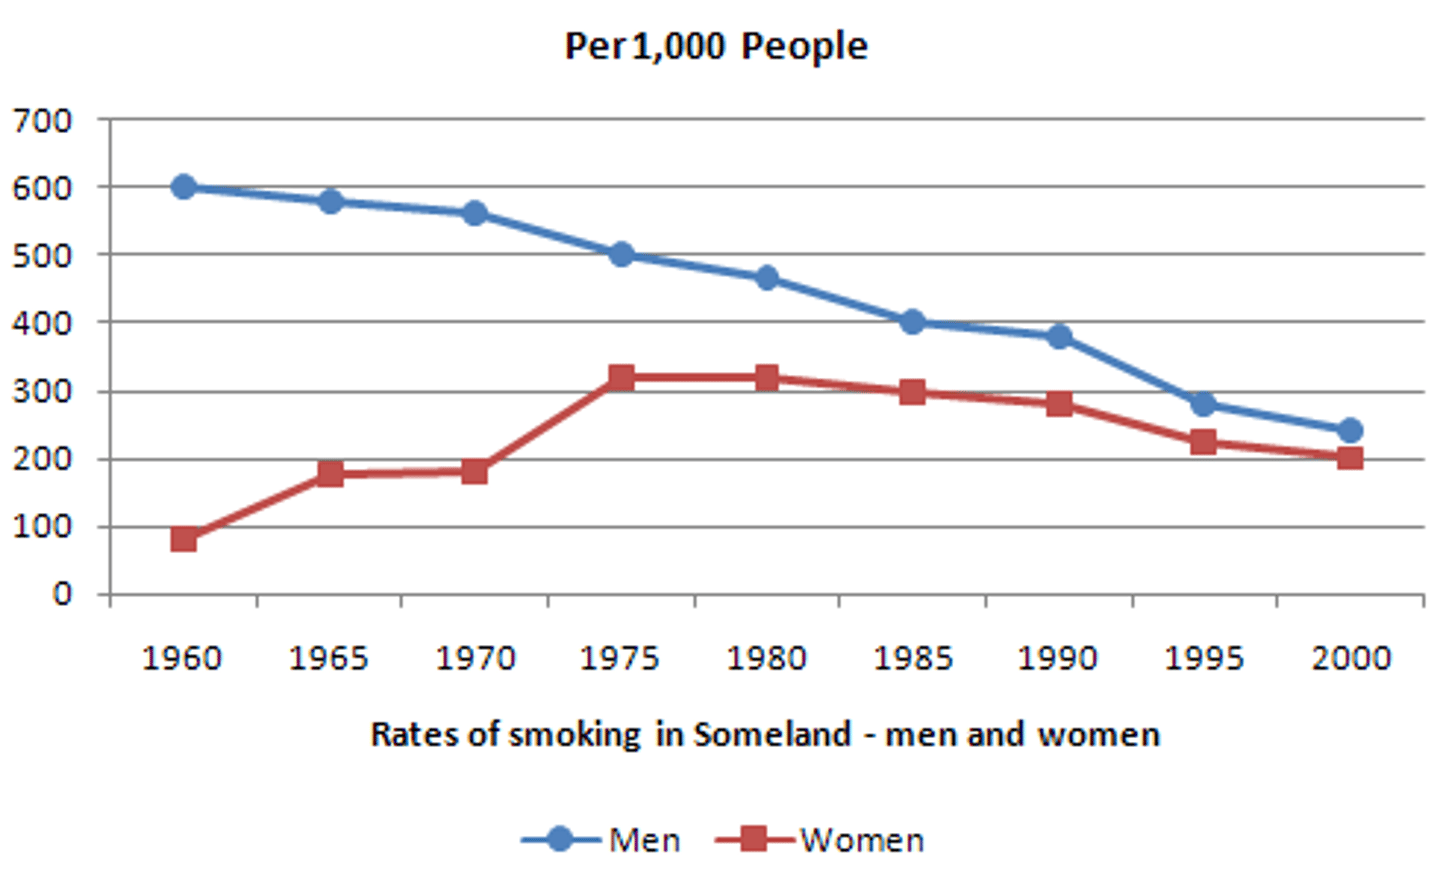
Line Graph
A graph showing change over time.
8
New cards
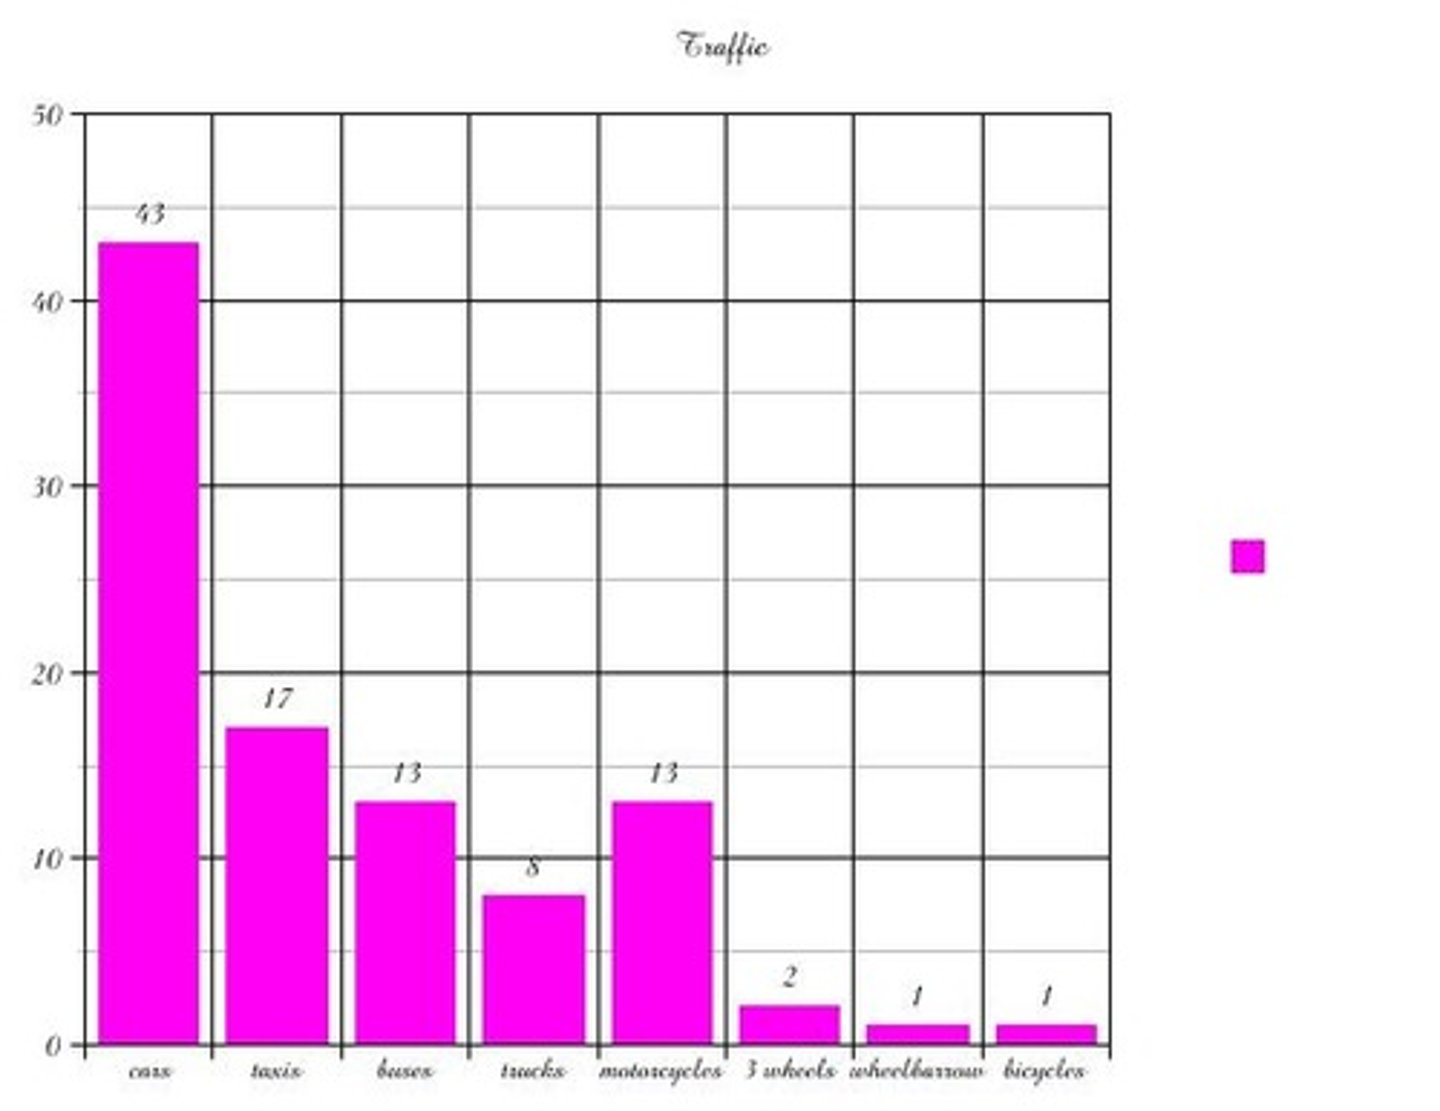
Bar Graph
A graph used to compare amounts.
9
New cards
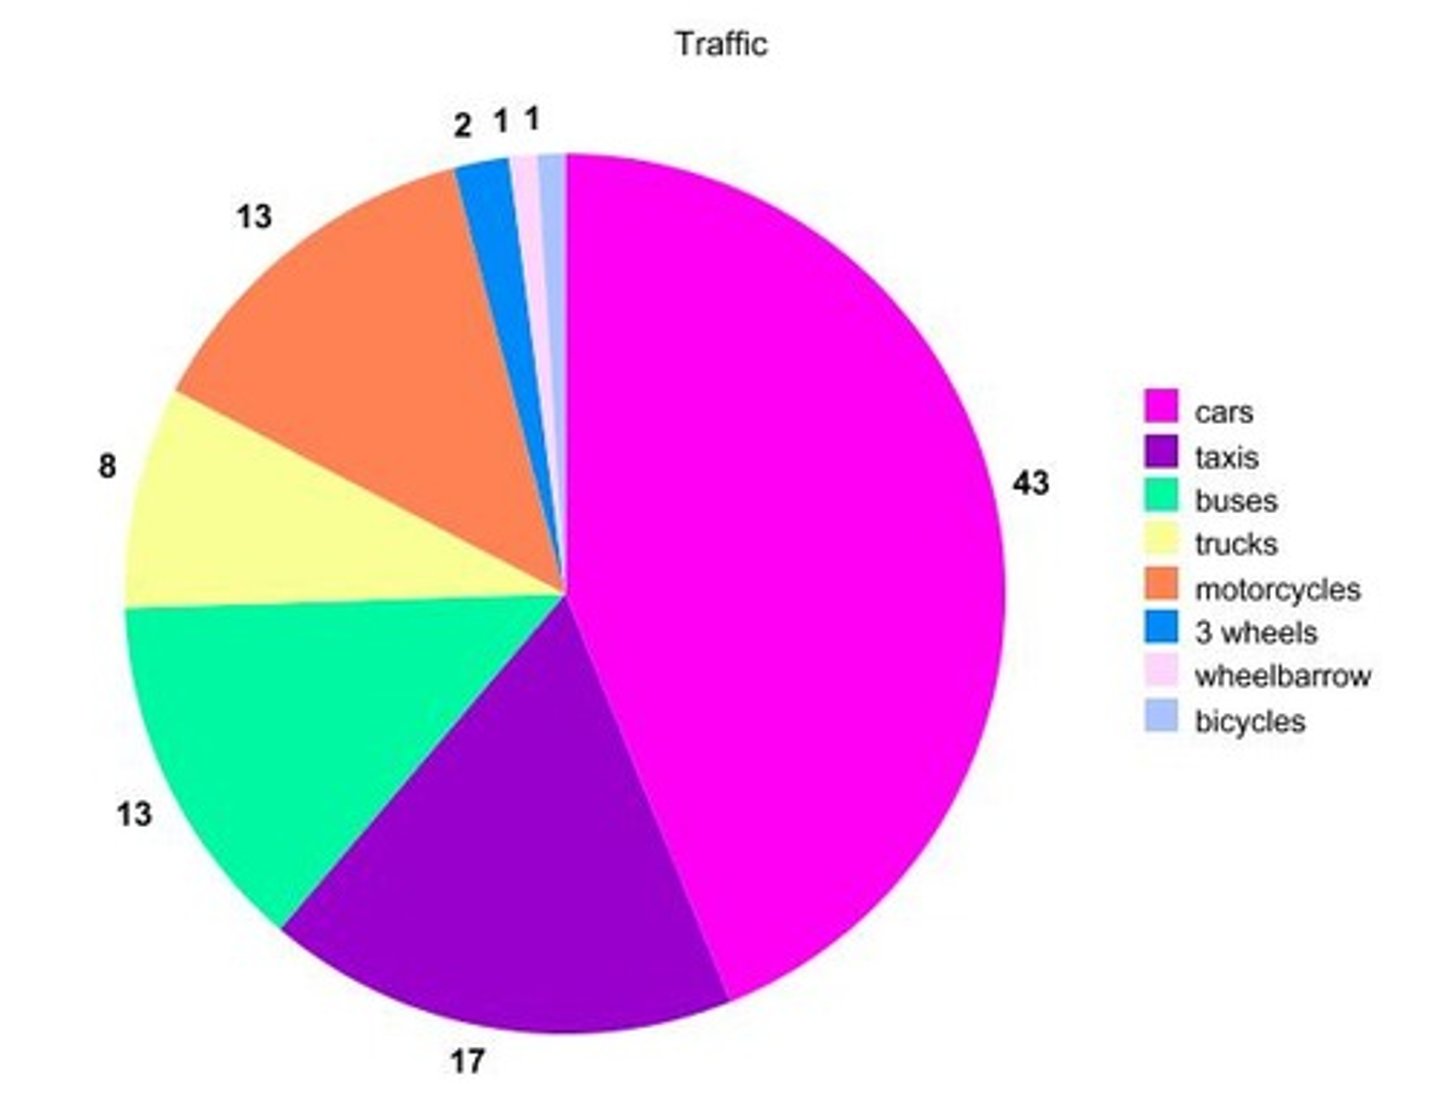
Pie Chart
A graph used to show parts of a whole.