CHEM 3.5 - ORGANIC ANALYSIS
1/23
There's no tags or description
Looks like no tags are added yet.
Name | Mastery | Learn | Test | Matching | Spaced | Call with Kai |
|---|
No analytics yet
Send a link to your students to track their progress
24 Terms
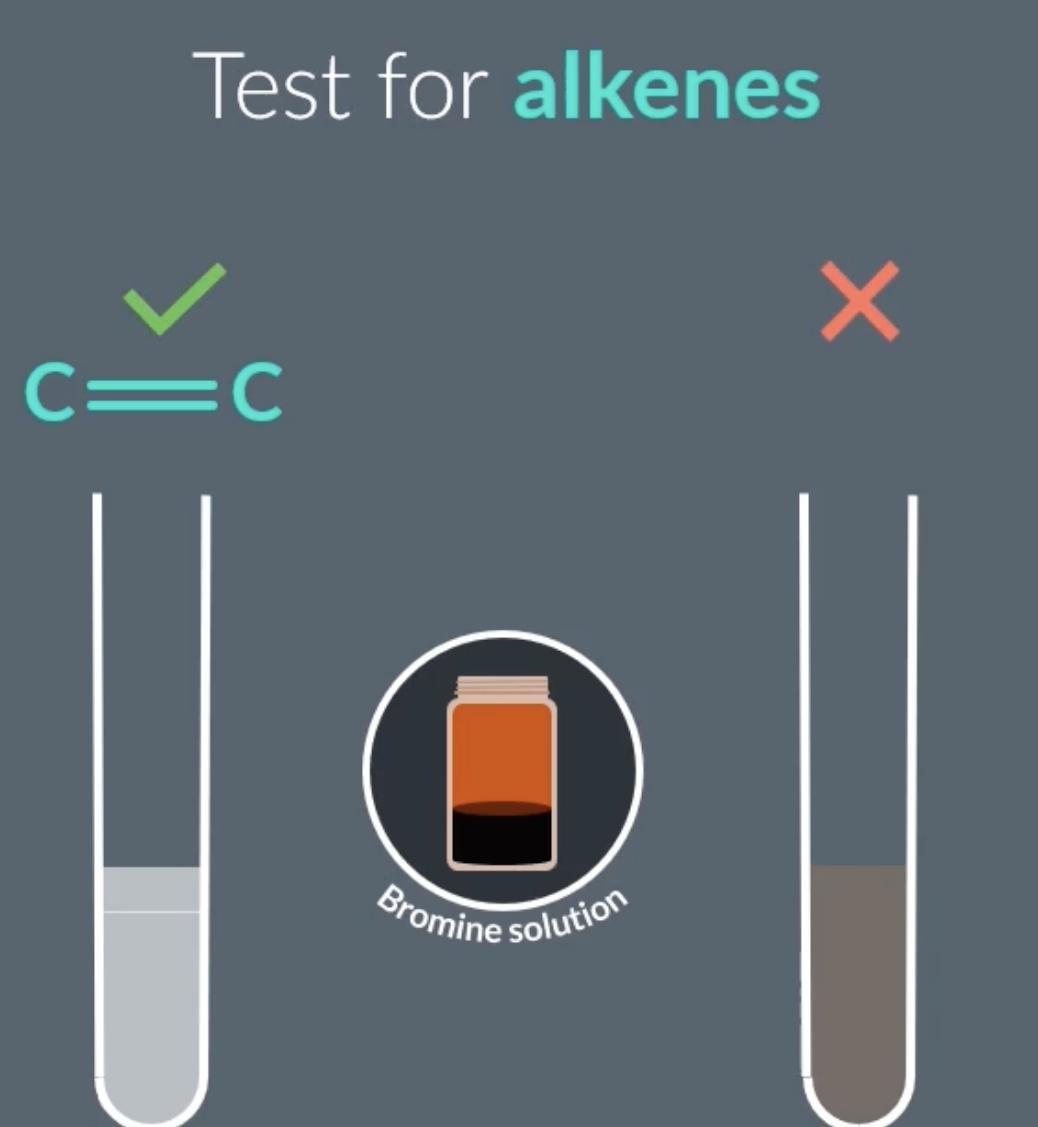
alkenes
add bromine water, if alkene is present we will observe colour change of orange to colourless
aldehydes
add tollens reagent, if an aldehyde is present we will observe a silver mirror
add benedicts solution or fehlings solution, if an aldehyde is present we will observe a colour change from blue to red
ketone
add tollens reagent, if a ketone is present we will not observe a colour change
add benedicts solution or fehlings solution, if a ketone is present solution will remain blue
primary alcohol
add acidified potassium dichromate, if a primary alcohol is present we will observe a colour change from orange to green
secondary alcohol
add acidified potassium dichromate, if a secondary alcohol is present we will observe a colour change from orange to green
tertiary alcohol
add acidified potassium dichromate, if tertiary alcohol is present the solution will remain orange
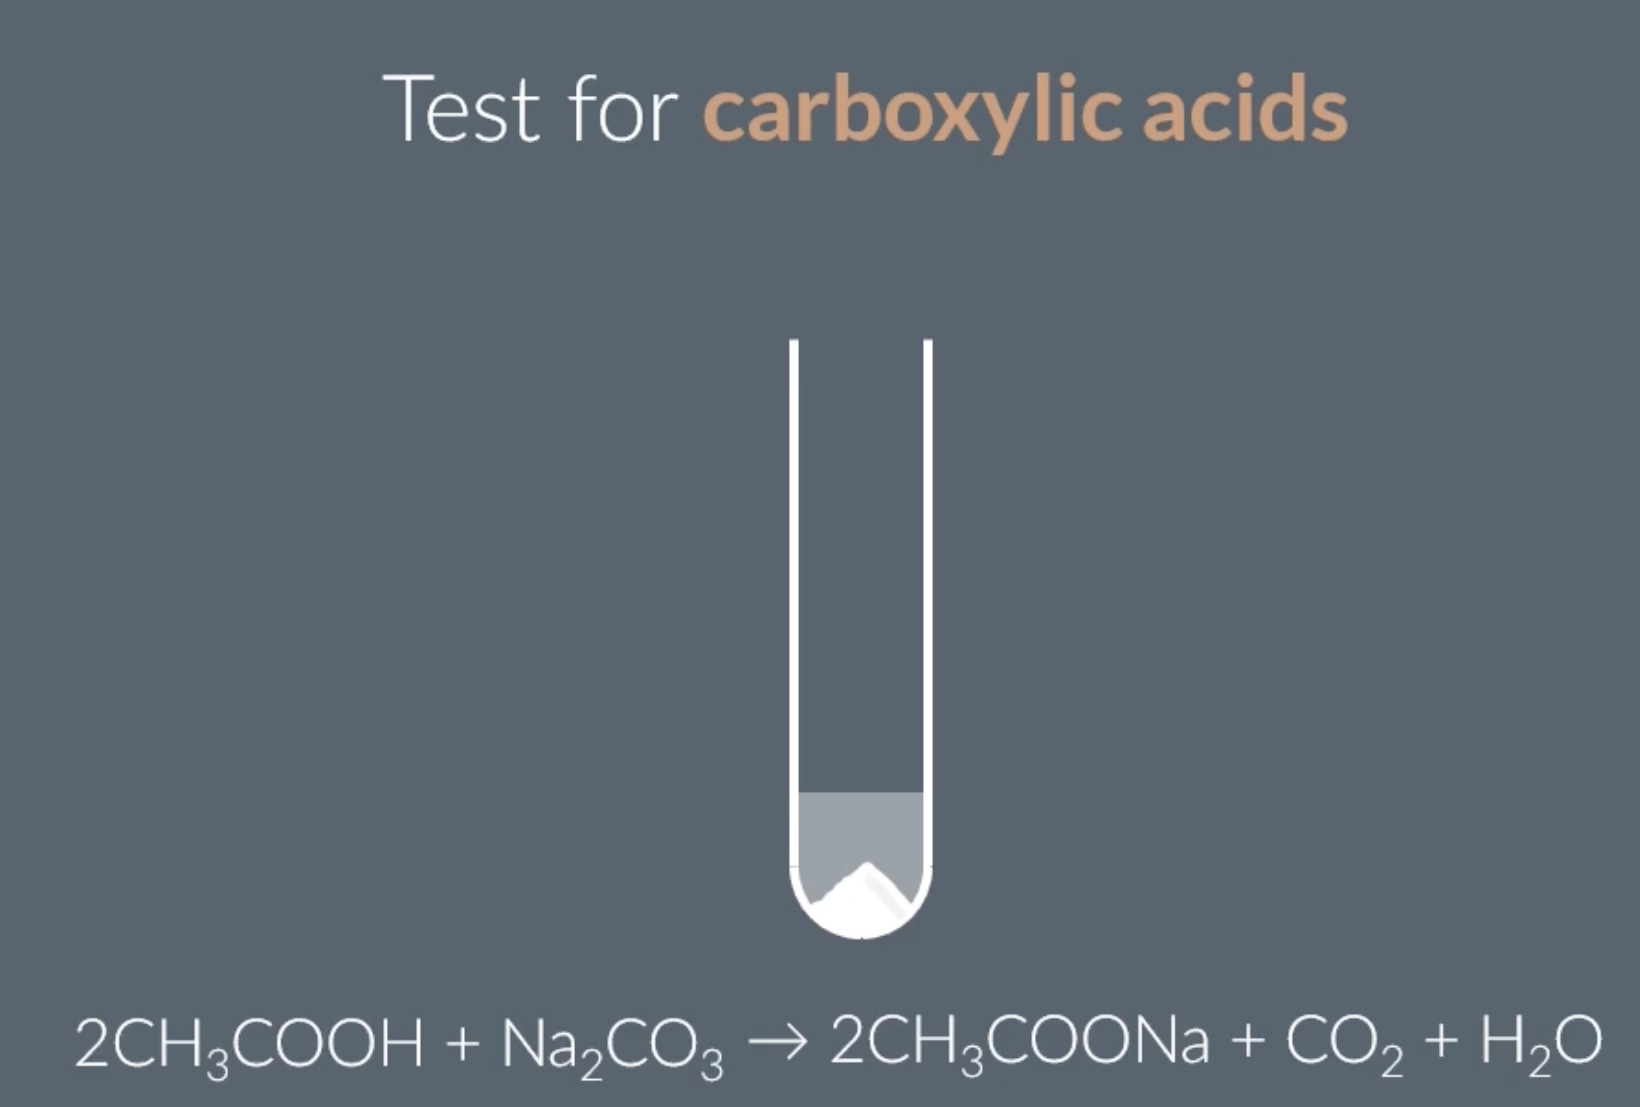
carboxylic acid
add sodium carbonate Na2CO3, if a carboxylic acid is present we will observe bubbles/ effervescence
product of this reaction is CO2 and H2O
any carbonate can be used, eg. calcium carbonate etc
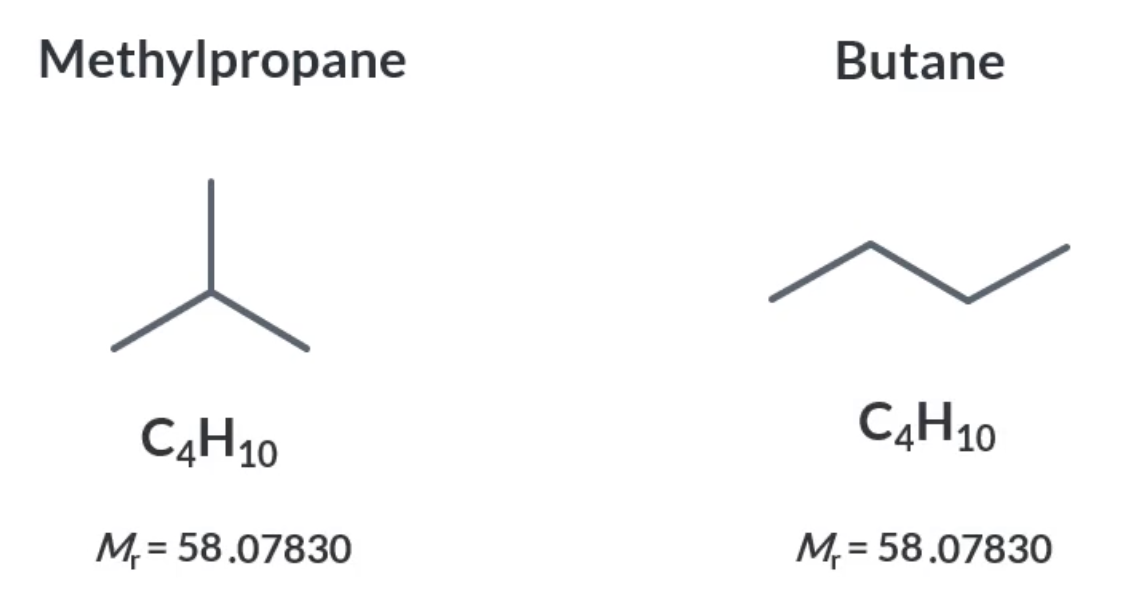
high-resolution mass spectrometry
mass spec allows us to determine the relative atomic mass of a molecule. however, isomers with the same molecular formula (including functional group isomers) will have the same Mr and therefore the same molecular ion peak, so they cannot be distinguished using low-resolution mass spectrometry
so a high-resolution mass spectrometer can be used they display values with are accurate to several decimal places, making it easier to differentiate between the molecules
fragmentation analysis
allows us to distinguish between molecules with the same molecular formula
analysing fragmentation peaks
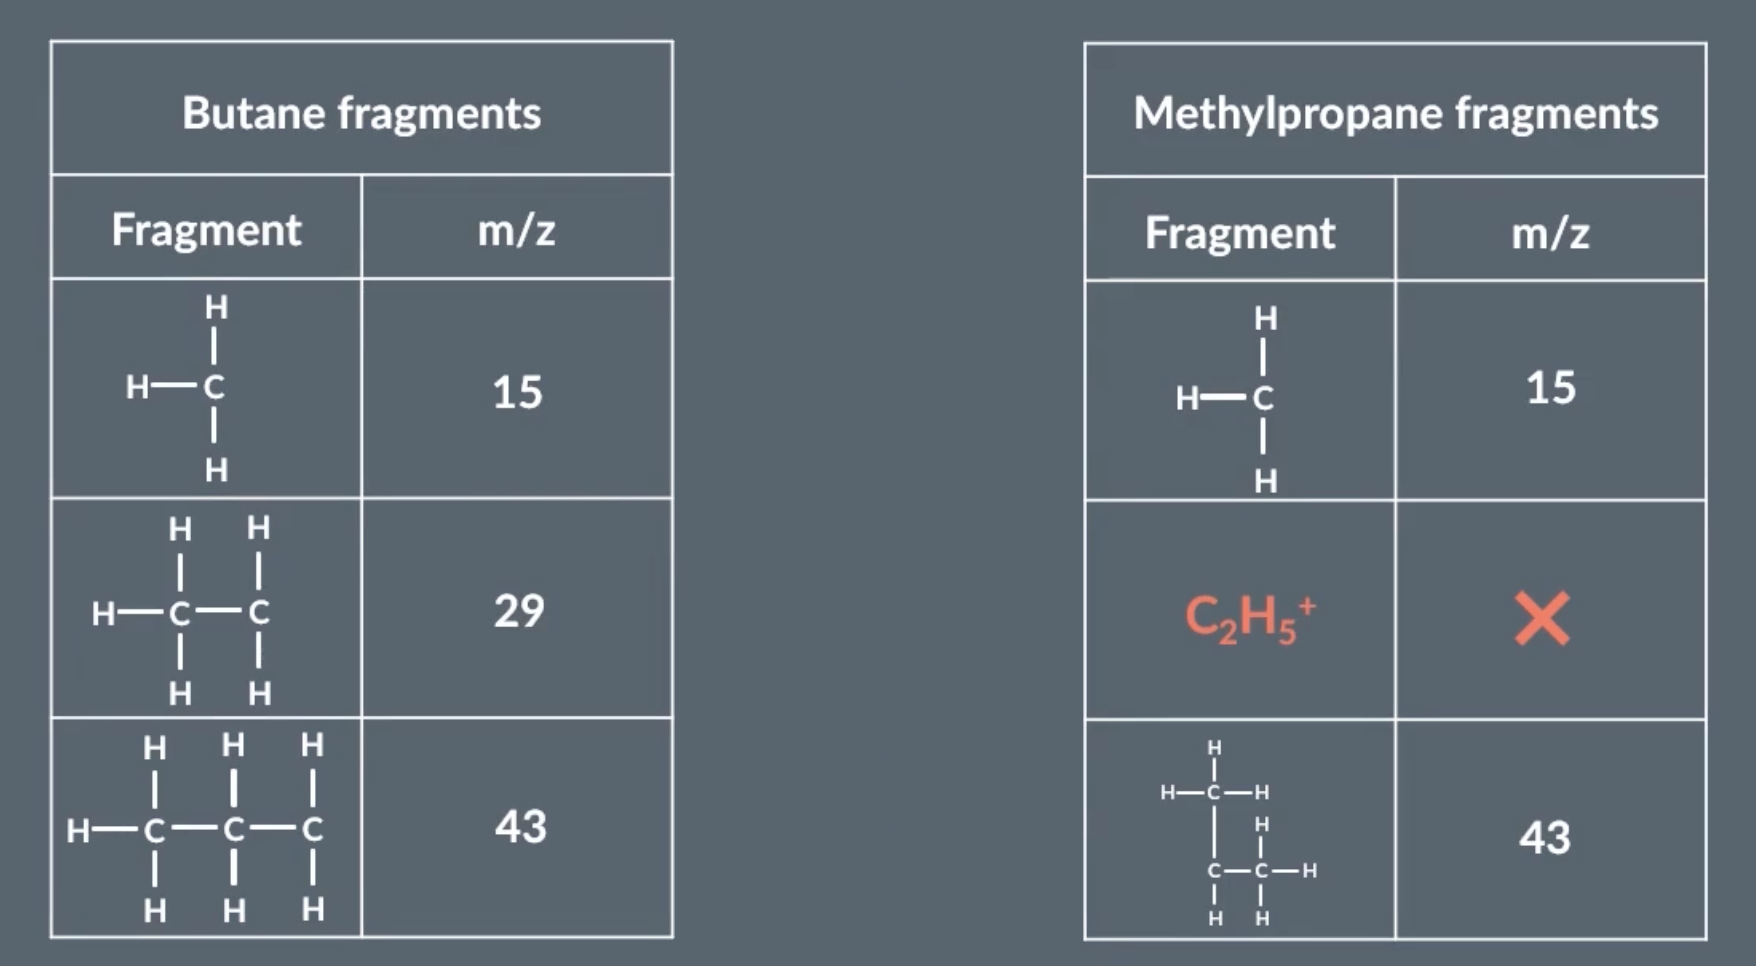
during mass spec, molecules can spilt into specific ions. to differentiate between 2 molecules with the same relative atomic mass, we can predict the ions they split into and their specific m/z charge, and then see if they show peaks on those points on the graph.
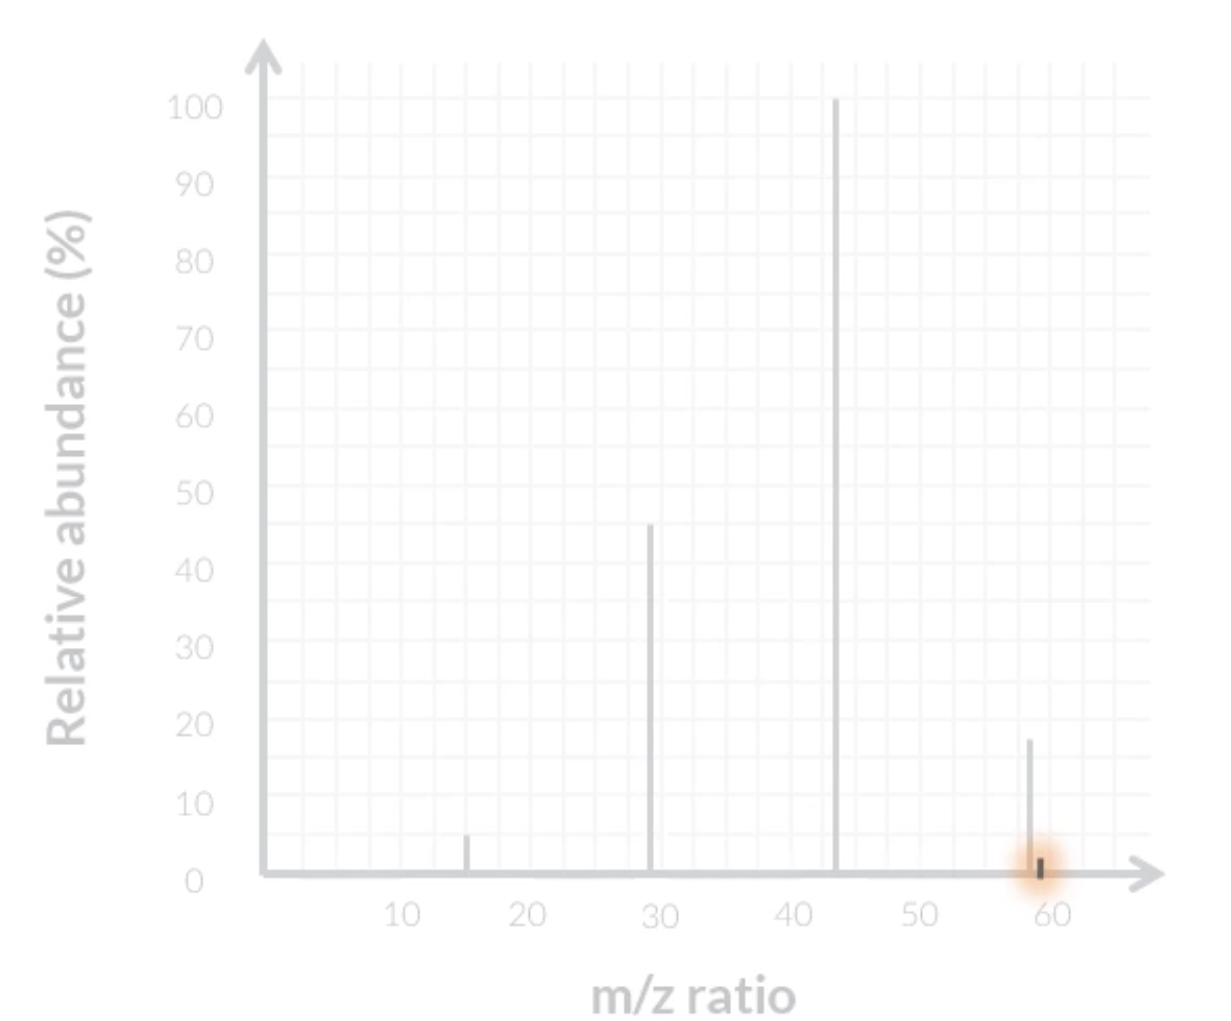
for this image, if the graph shows a peak at 29, that means its butane
most likely the fragments are always due to C-C bonds breaking
analysing fragmentation peaks 2
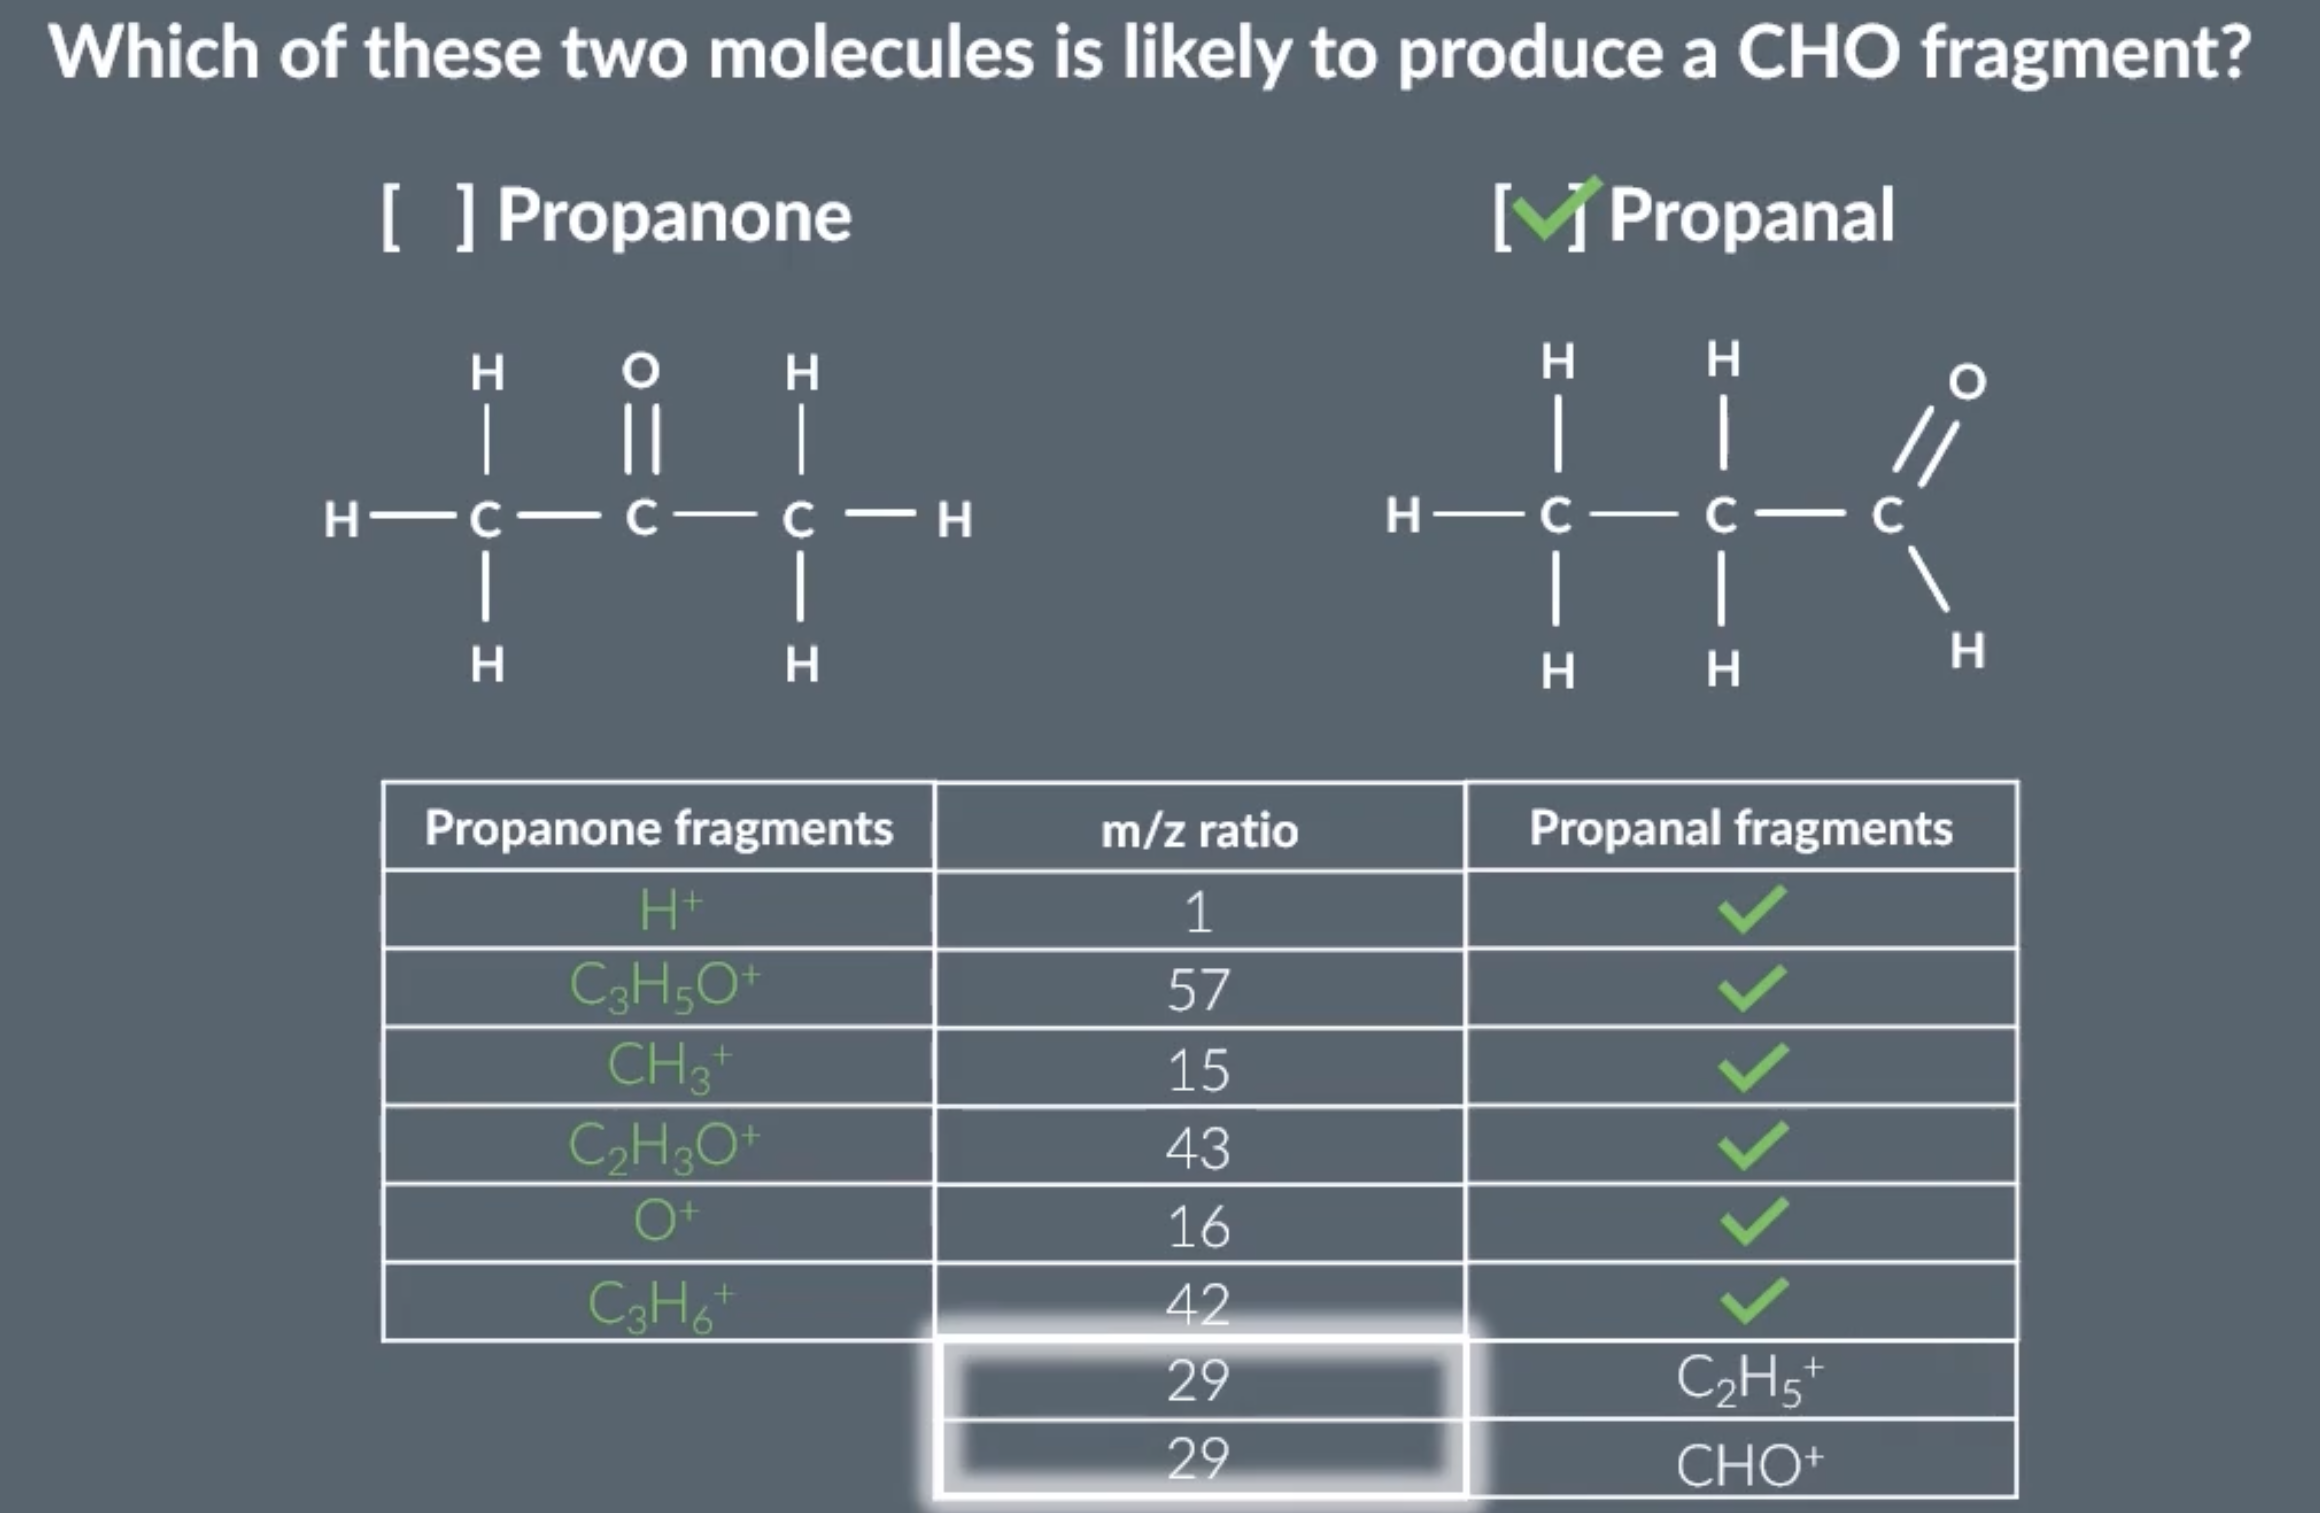
when asked this, figure out every possible fragment by drawing out the displayed formula, including breaking C-H bonds
answer is propanal
by calculating the relative atomic mass of the fragments, we can see that a 29 peak will only show on the propanal graph
small peaks on mass spec graphs
due to isotopes, eg. carbon-12 vs carbon-13, carbon-13 can cause a smaller peak
fragmentation
fragmentation is the process where the molecular ion breaks into smaller positive ions during mass spectrometry because it is unstable. these fragment ions produce additional peaks at lower m/z values. fragmentation occurs after ionisation. fragmentation occurs because the molecular ion (M⁺) formed during ionisation is very unstable and has excess energy, so it breaks apart into smaller ions
mass spec from topic 1 doesnt undergo fragmentation because its tof using singular atoms. however tof with molecules does undergo fragmentation. this produces lots of peaks on the graph, and small peaks are due to the presence of different sized isotopes, eg. carbon-13
molecules that absorb infrared light
molecules that contain only one element and are symmetrical do not absorb infrared light. eg. Cl2 or O2
molecules that contain more than one element and are not symmetrical do absorb infrared light. eg. CH4. they only absorb infrared light at specific frequencies, which causes the vibration of the molecule to change
how infrared spectroscopy works
molecules absorb different frequencies depending on the bonds it contains
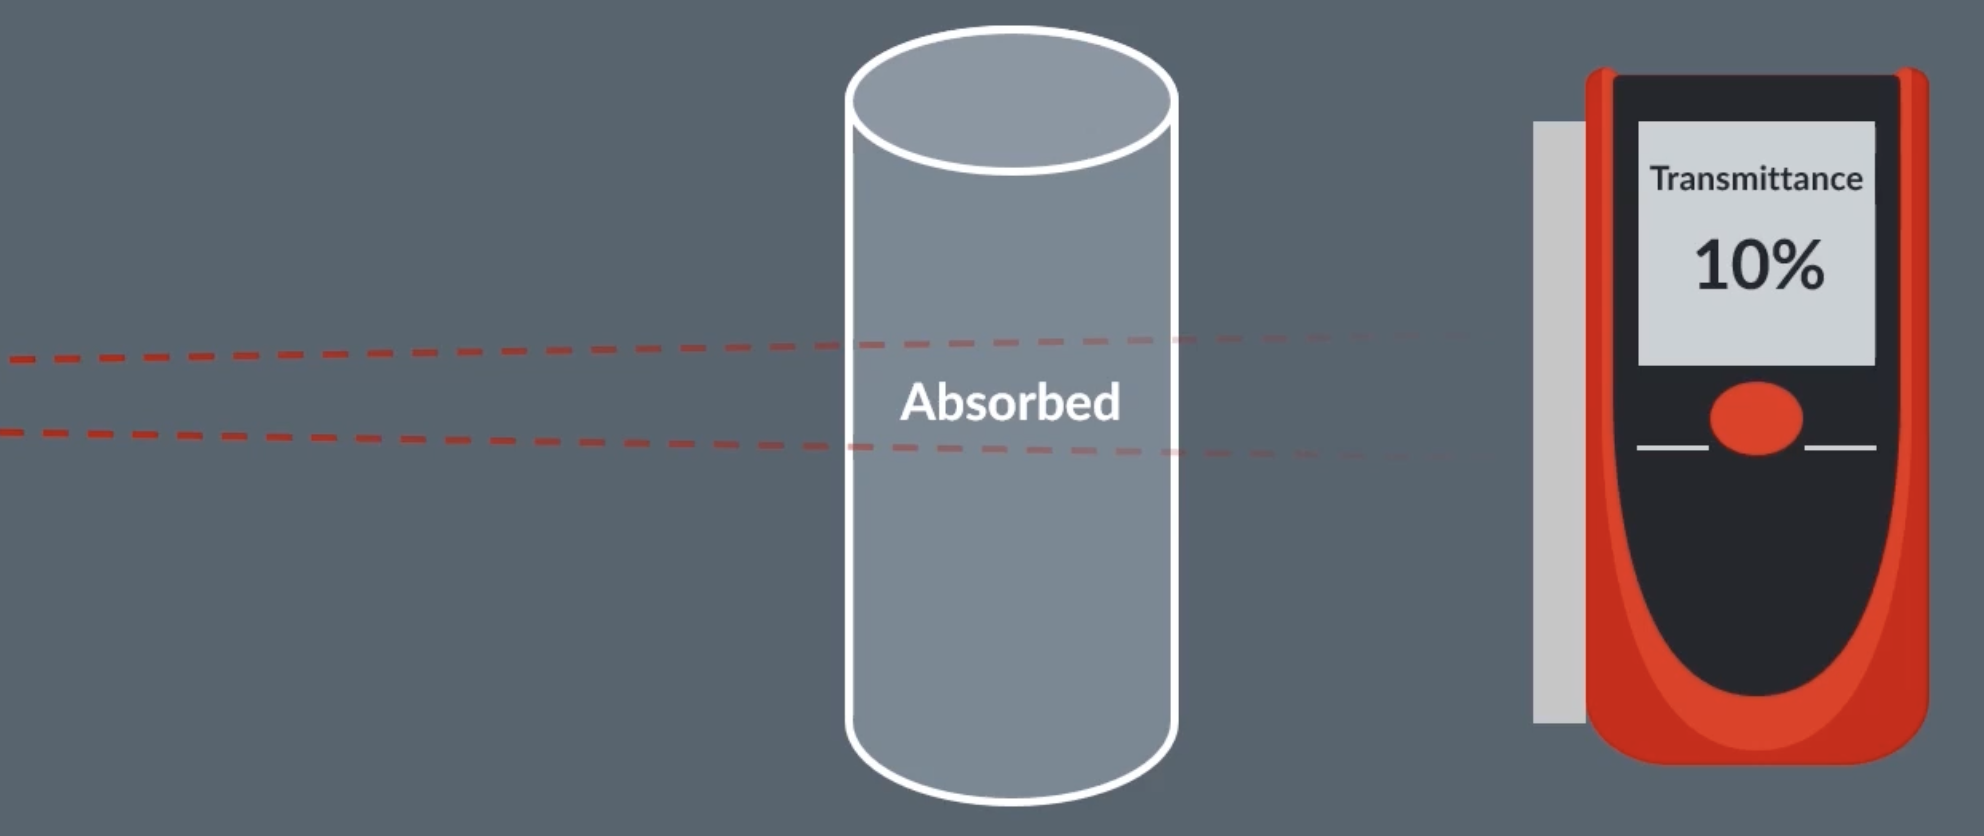
infrared light is shone through the sample, a sensor records the transmittance (how much light passes through). if a transmittance is low for a specific frequency, that means the sample absorbed some of that frequency and we can use this to determine which bonds a sample has
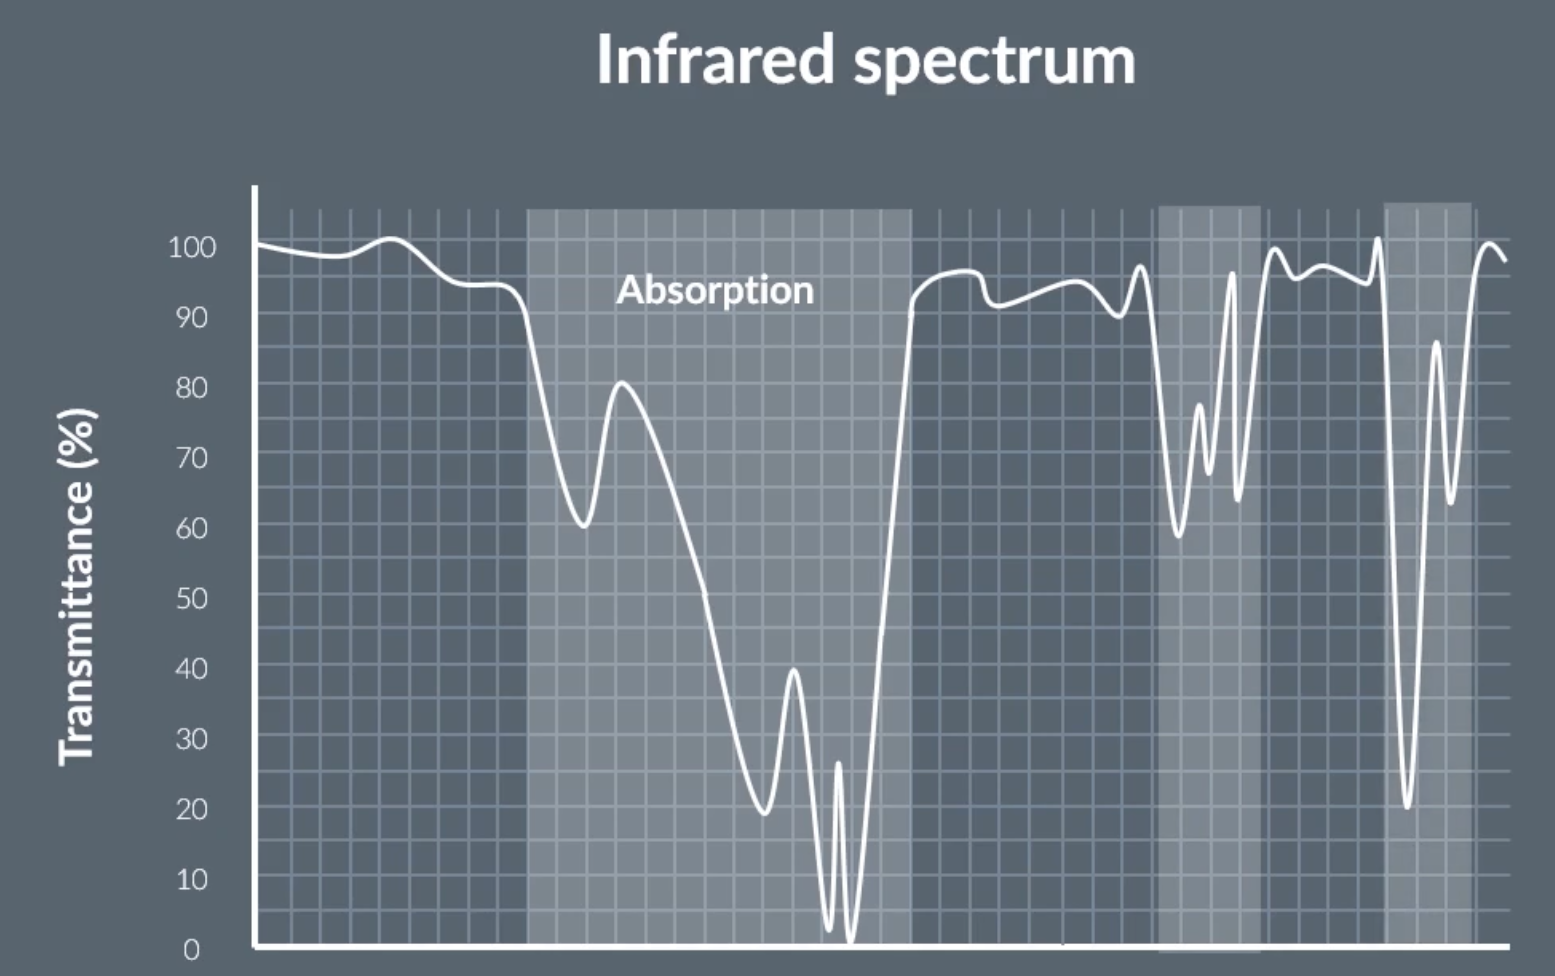
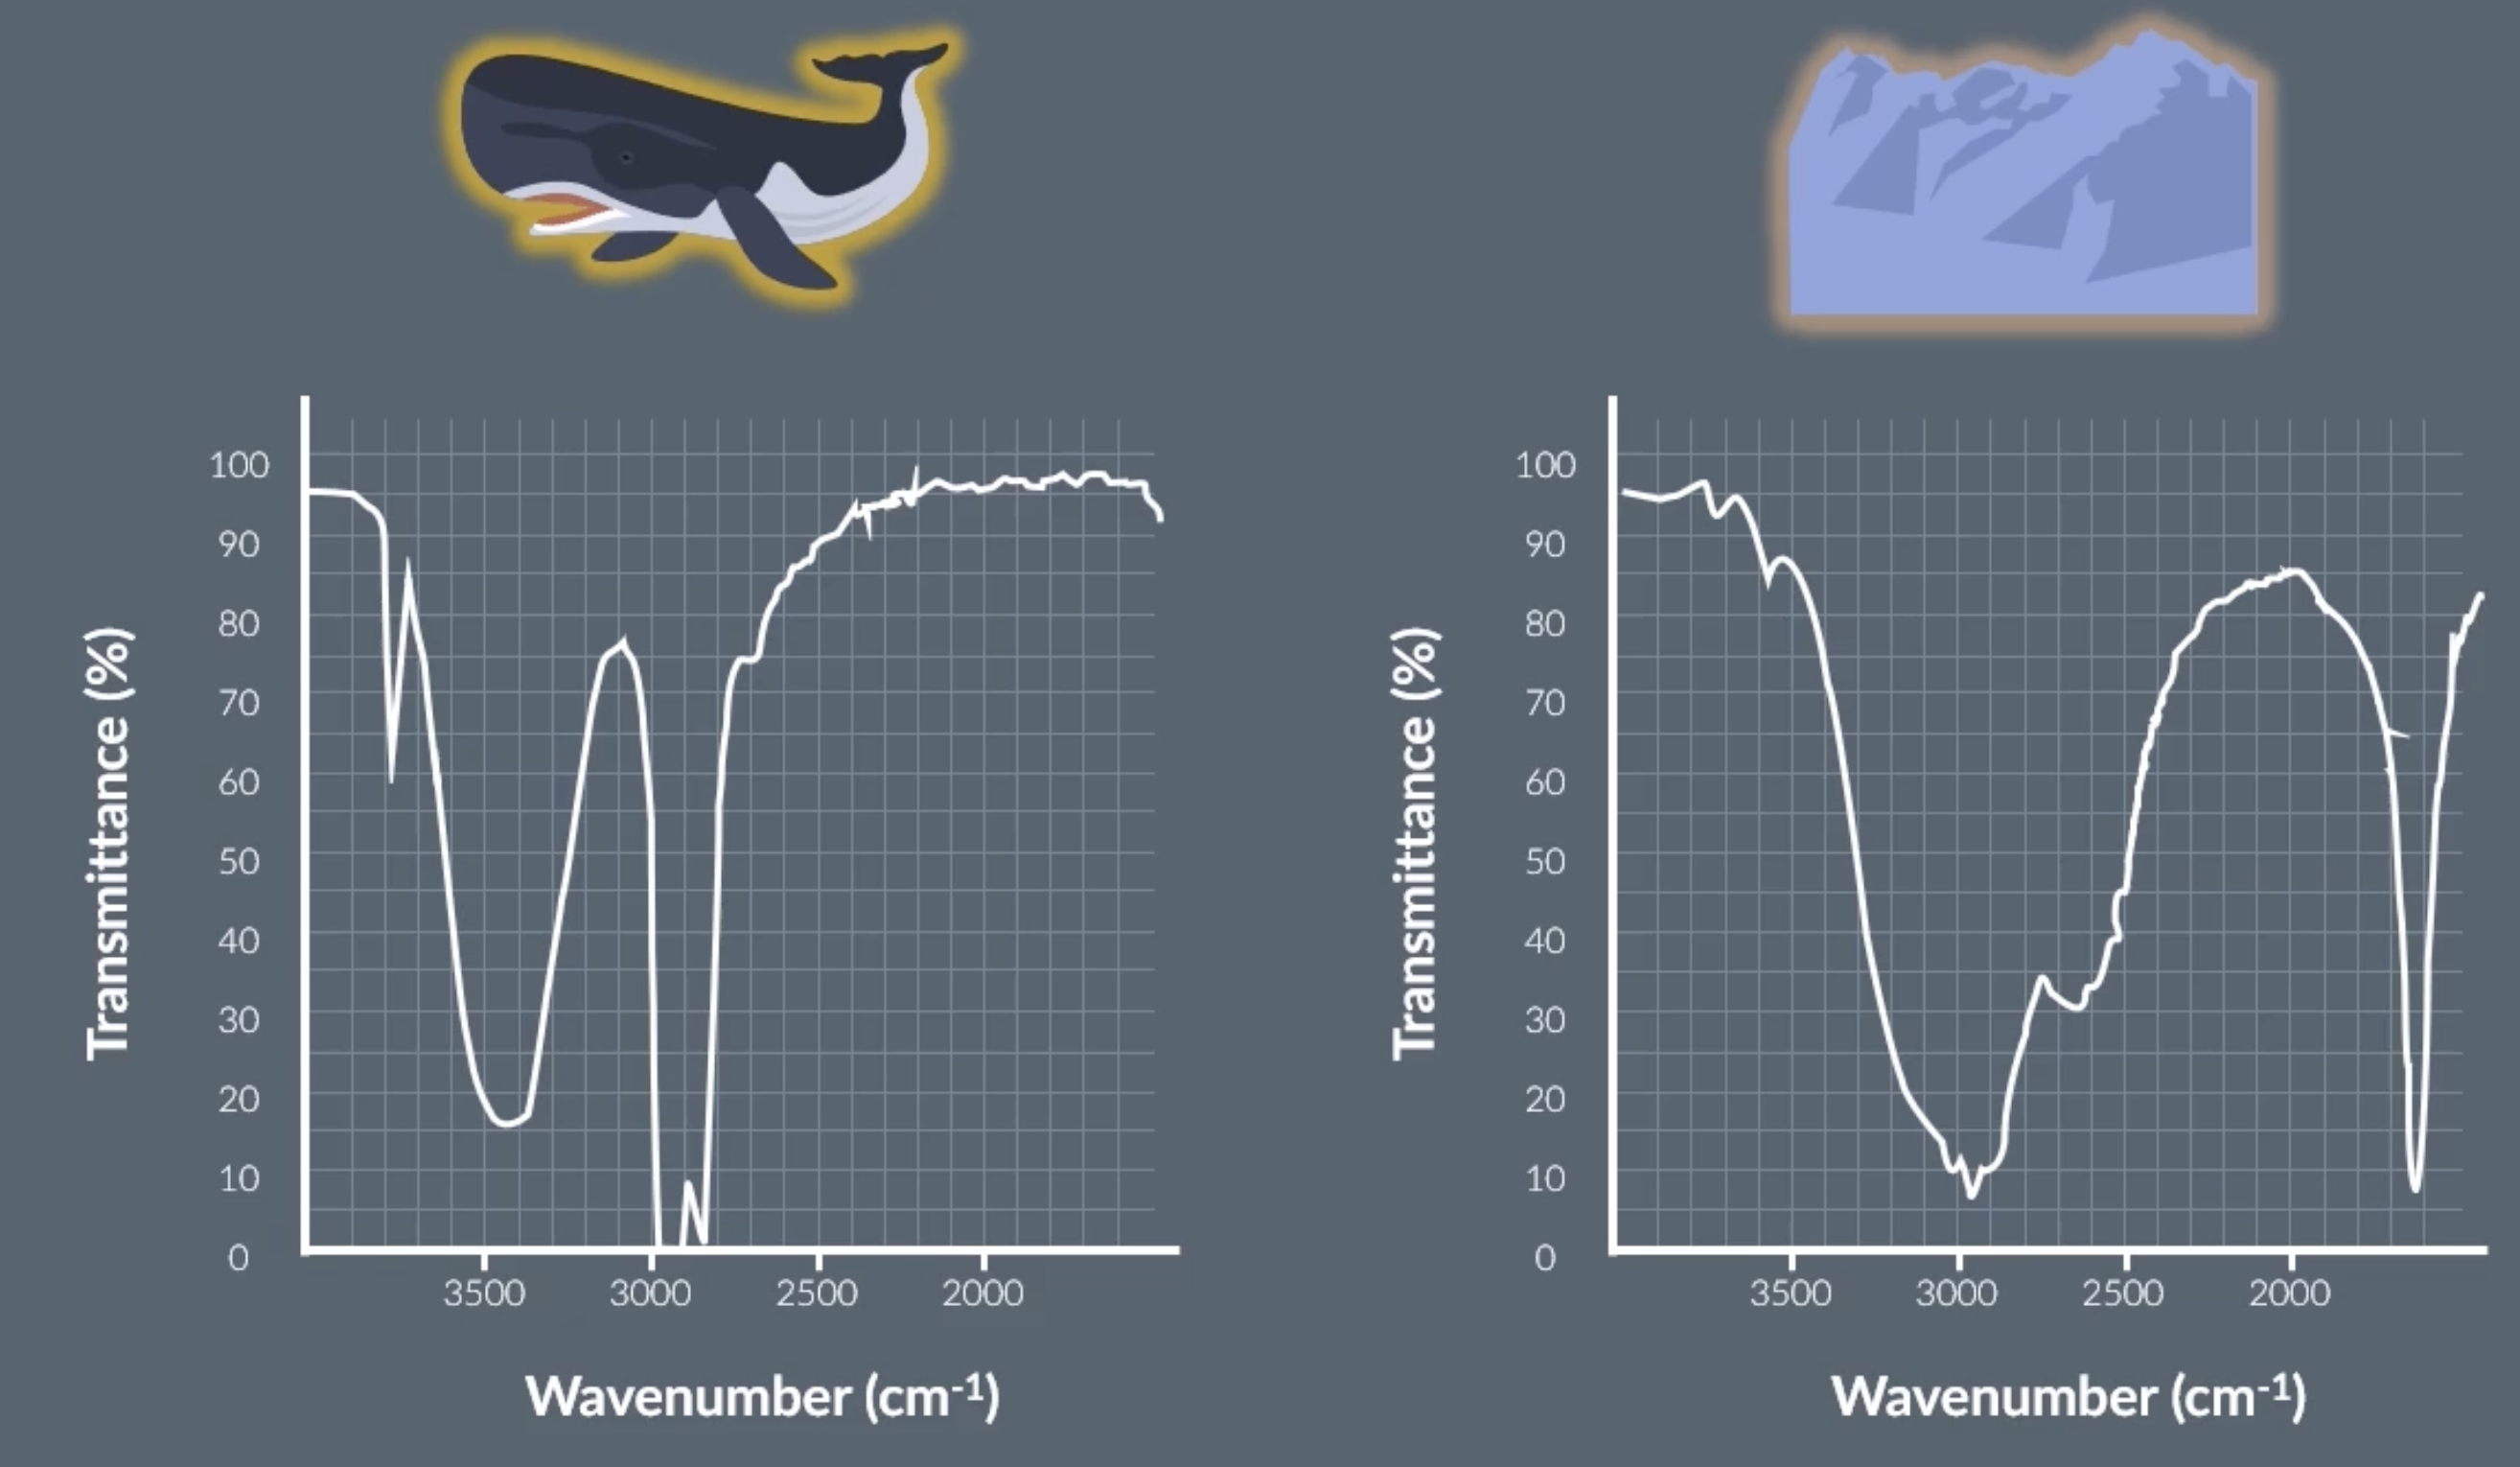
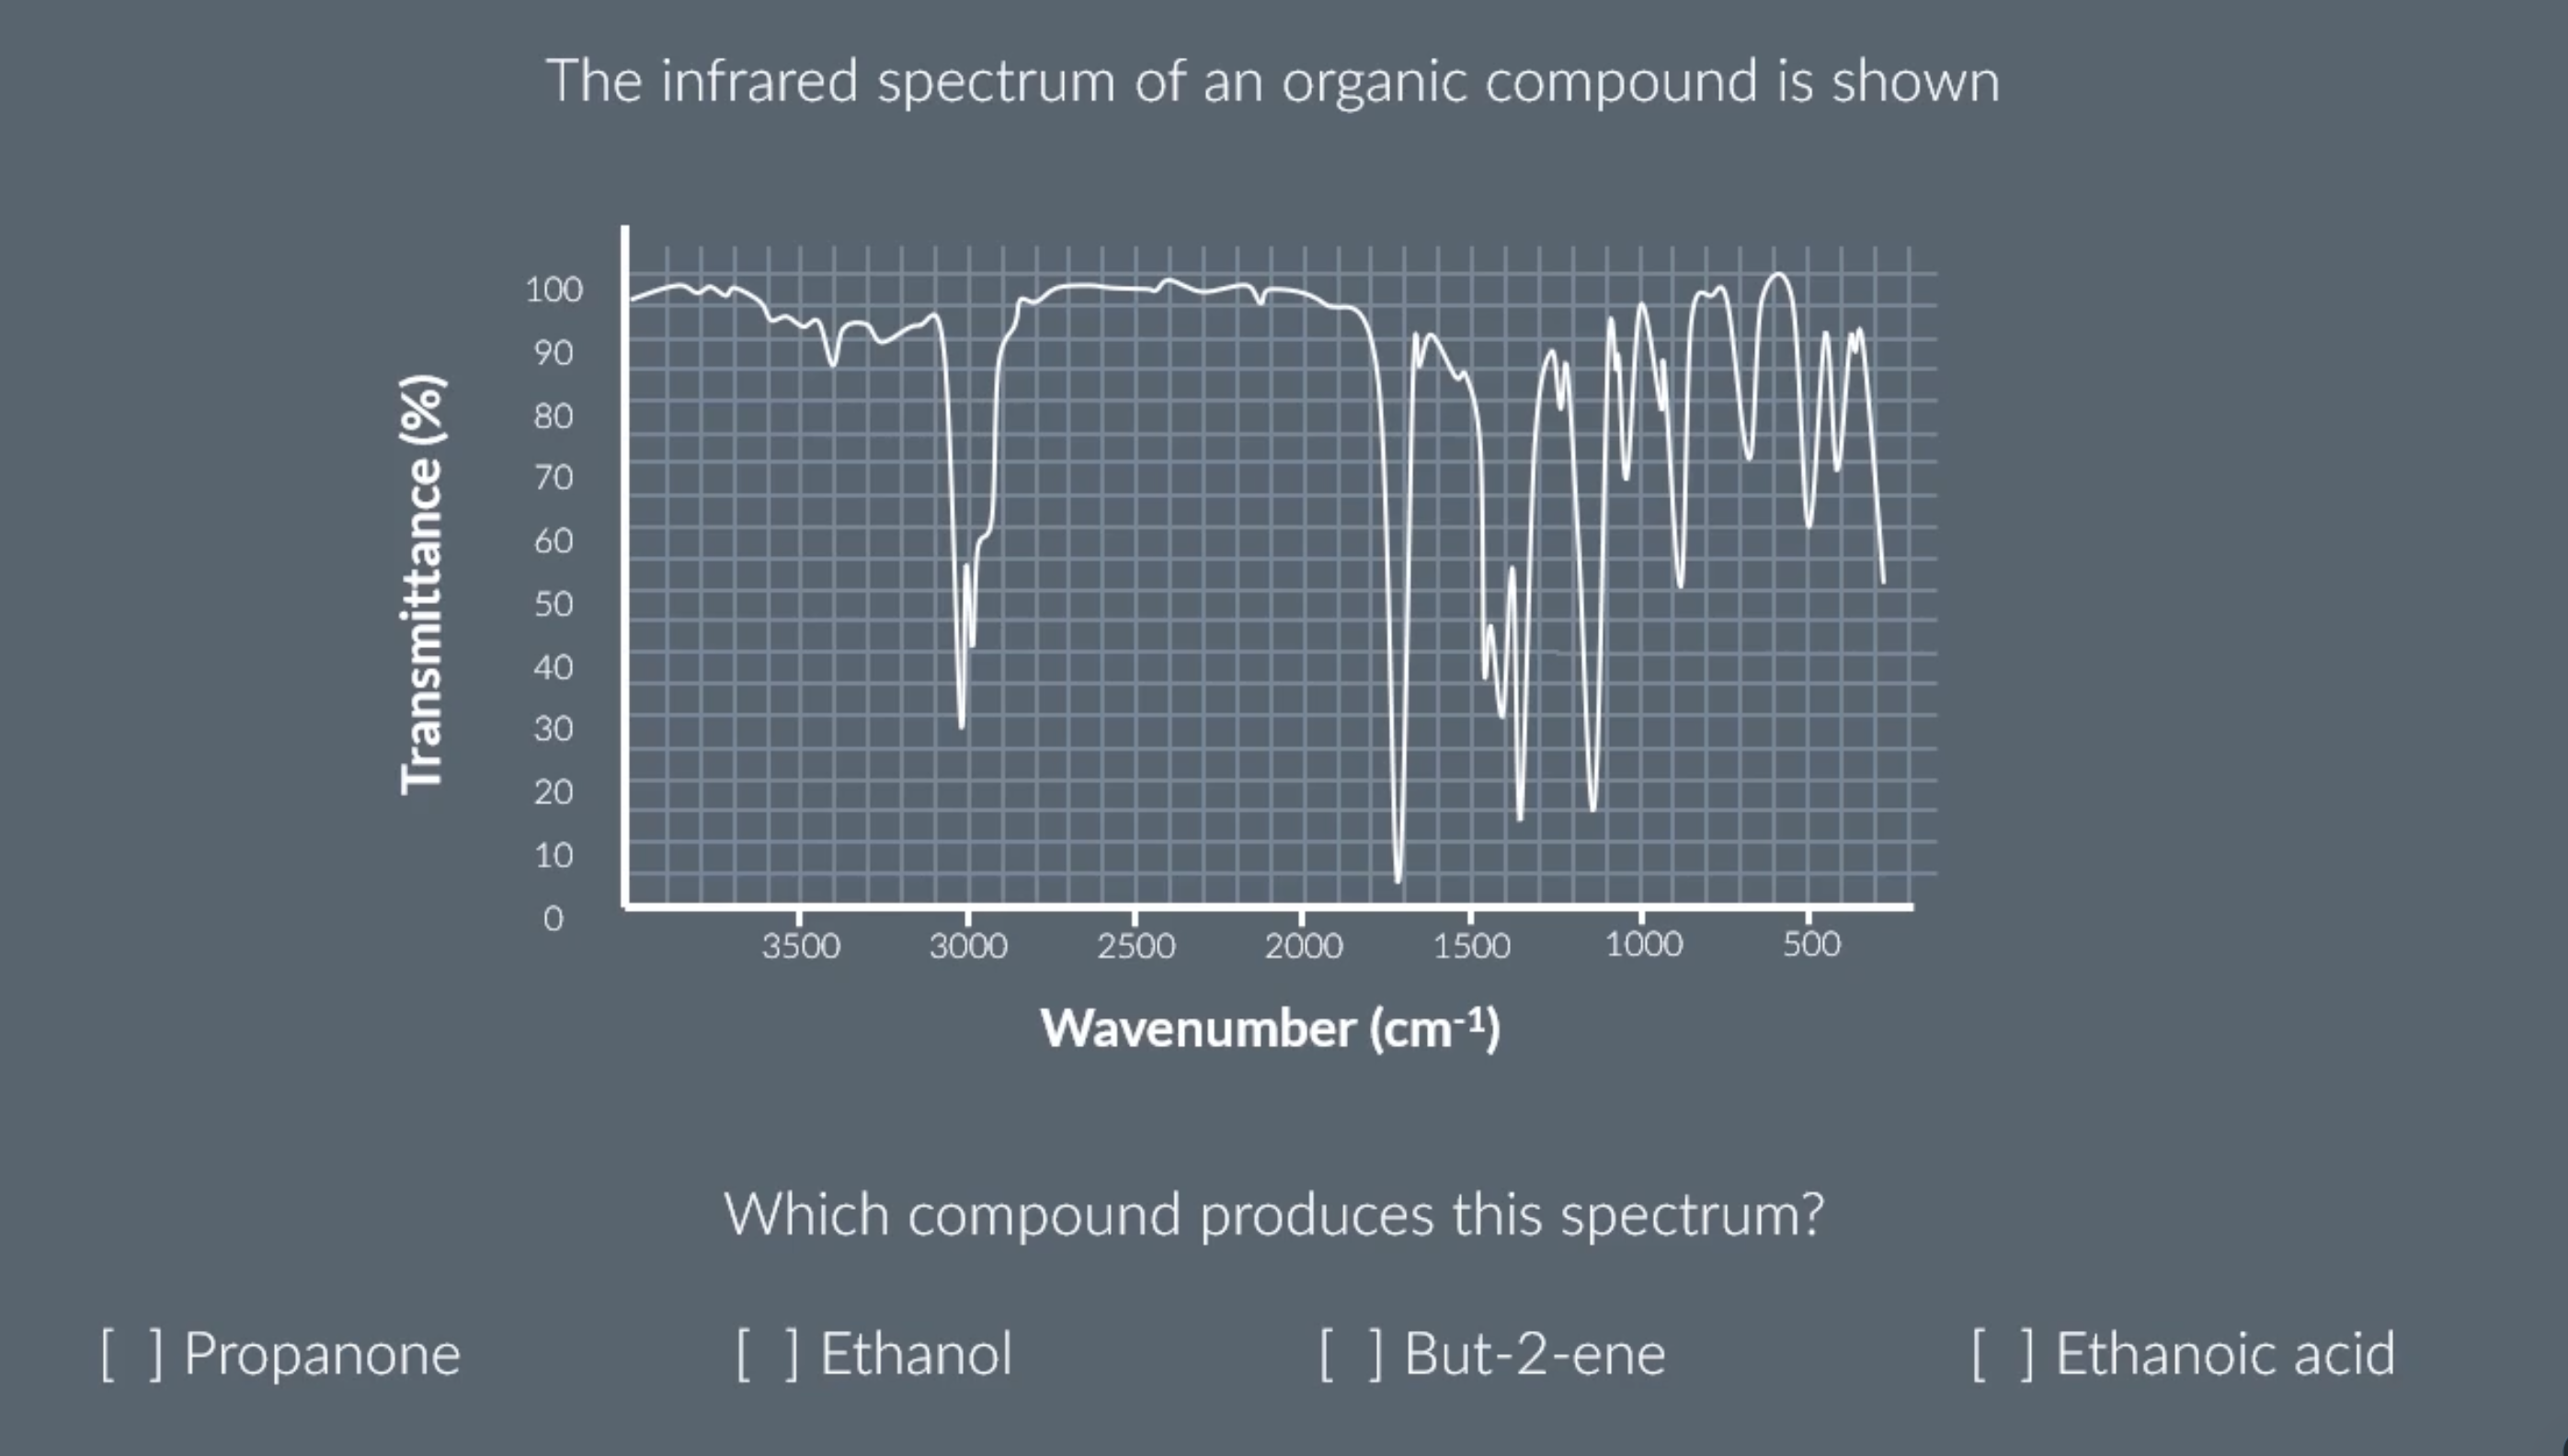
infrared spectrum
the highlighted bits show that infrared light was absorbed, meaning the transmittance is low and we can use this speaks to determine what bonds the molecule has
x axis is labeled wavenumber
wavenumber (cm-1) = 1 / wavelength (cm)
keep in mind the x axis is backwards, starting from 3000 not 0
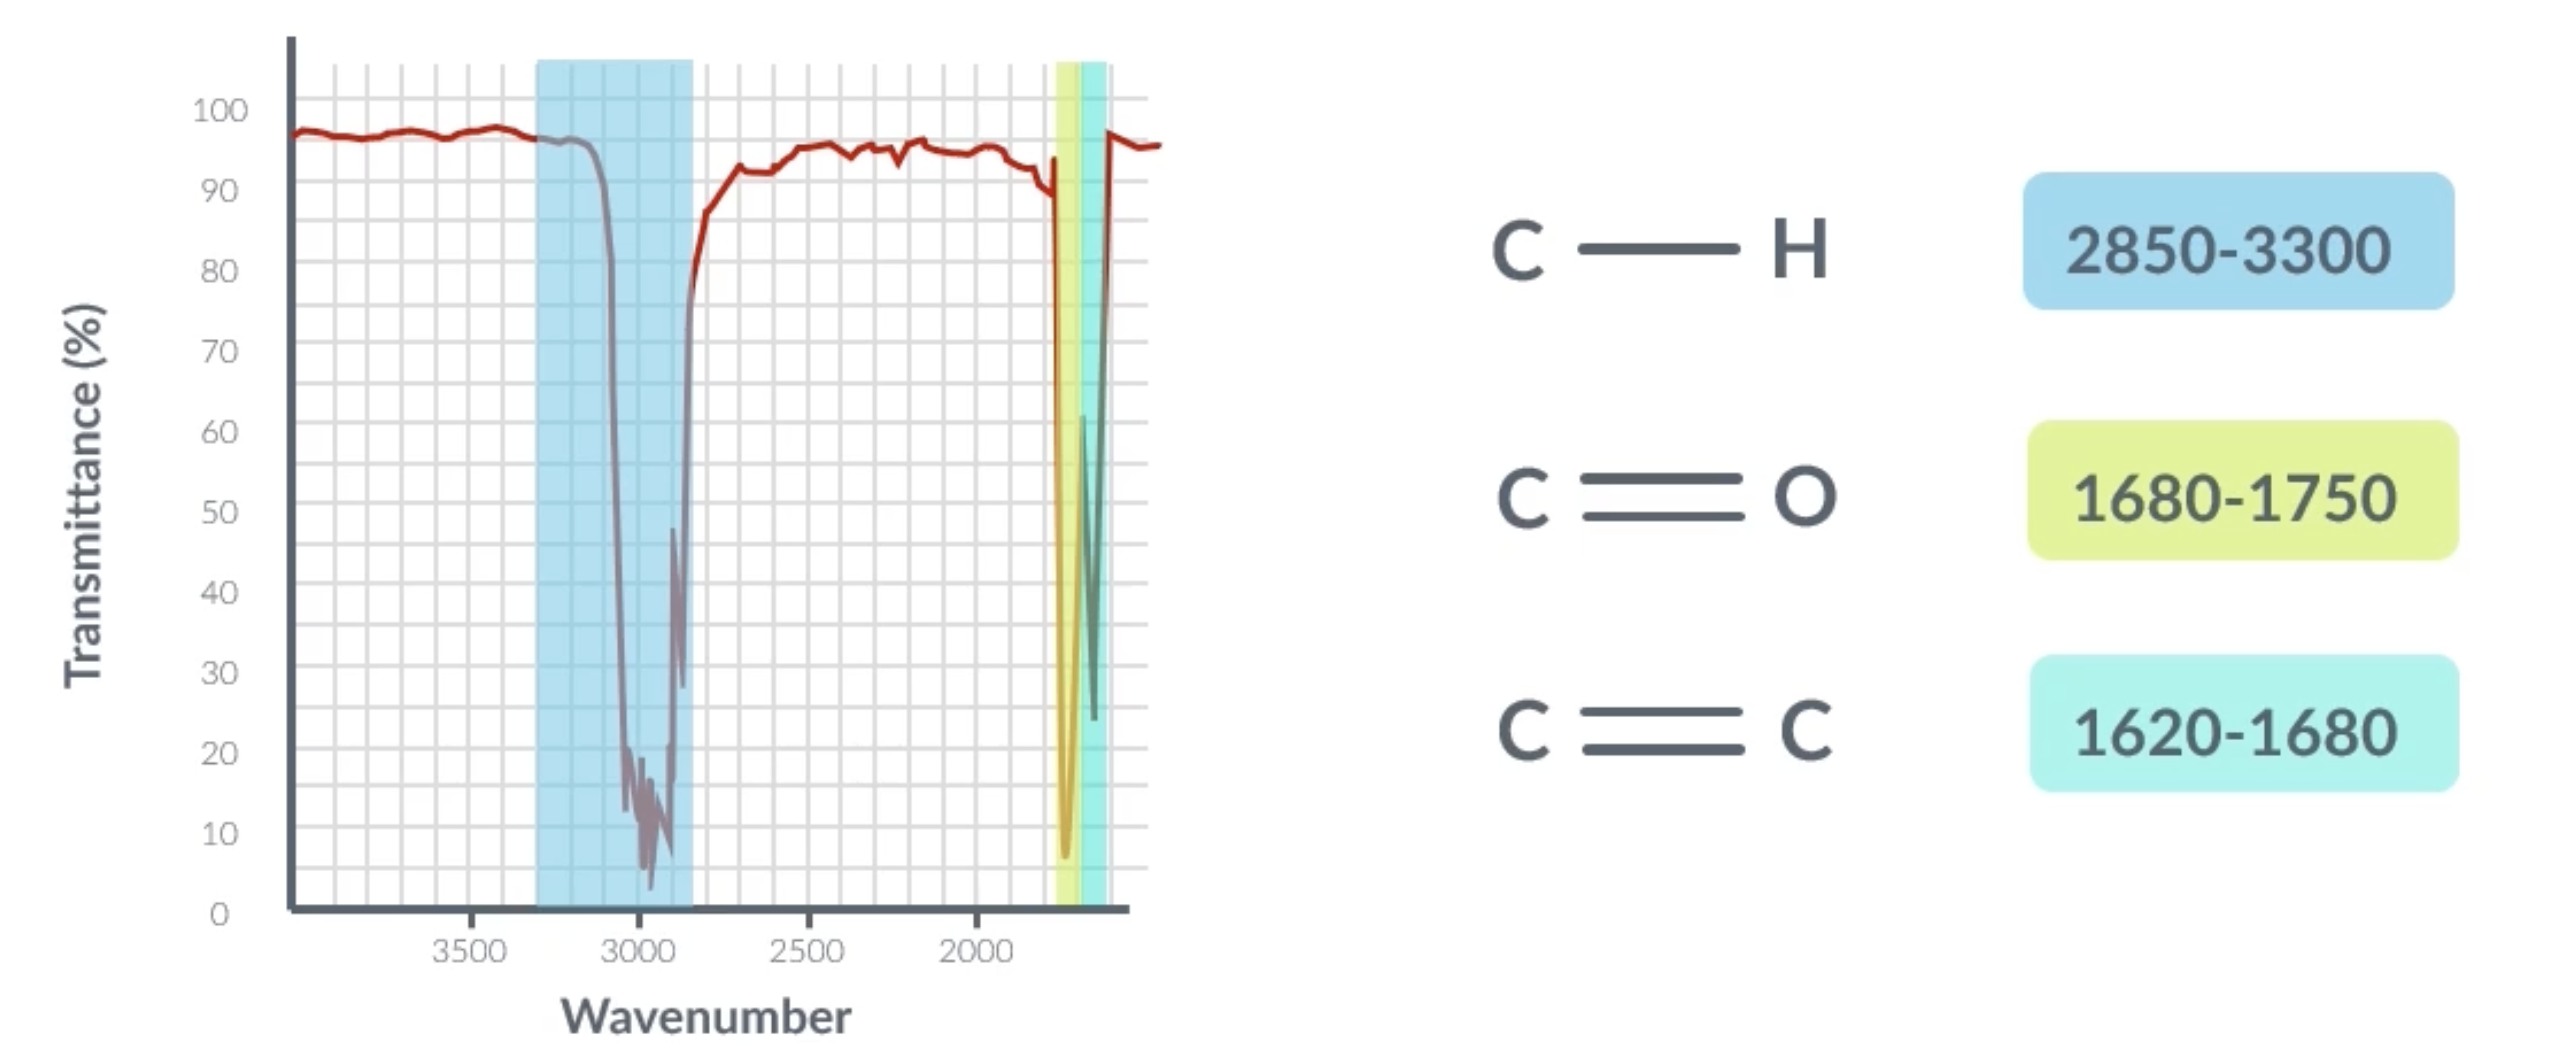
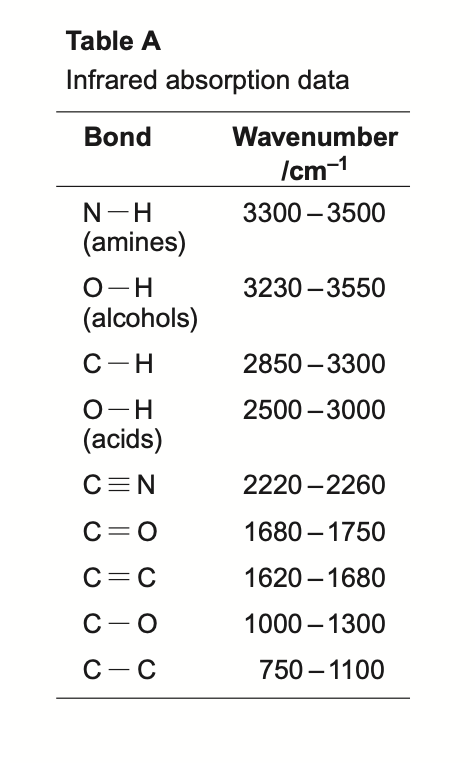
identifying the absorptions
peak at around 3000 = C-H
peak at around 1600 = C=C
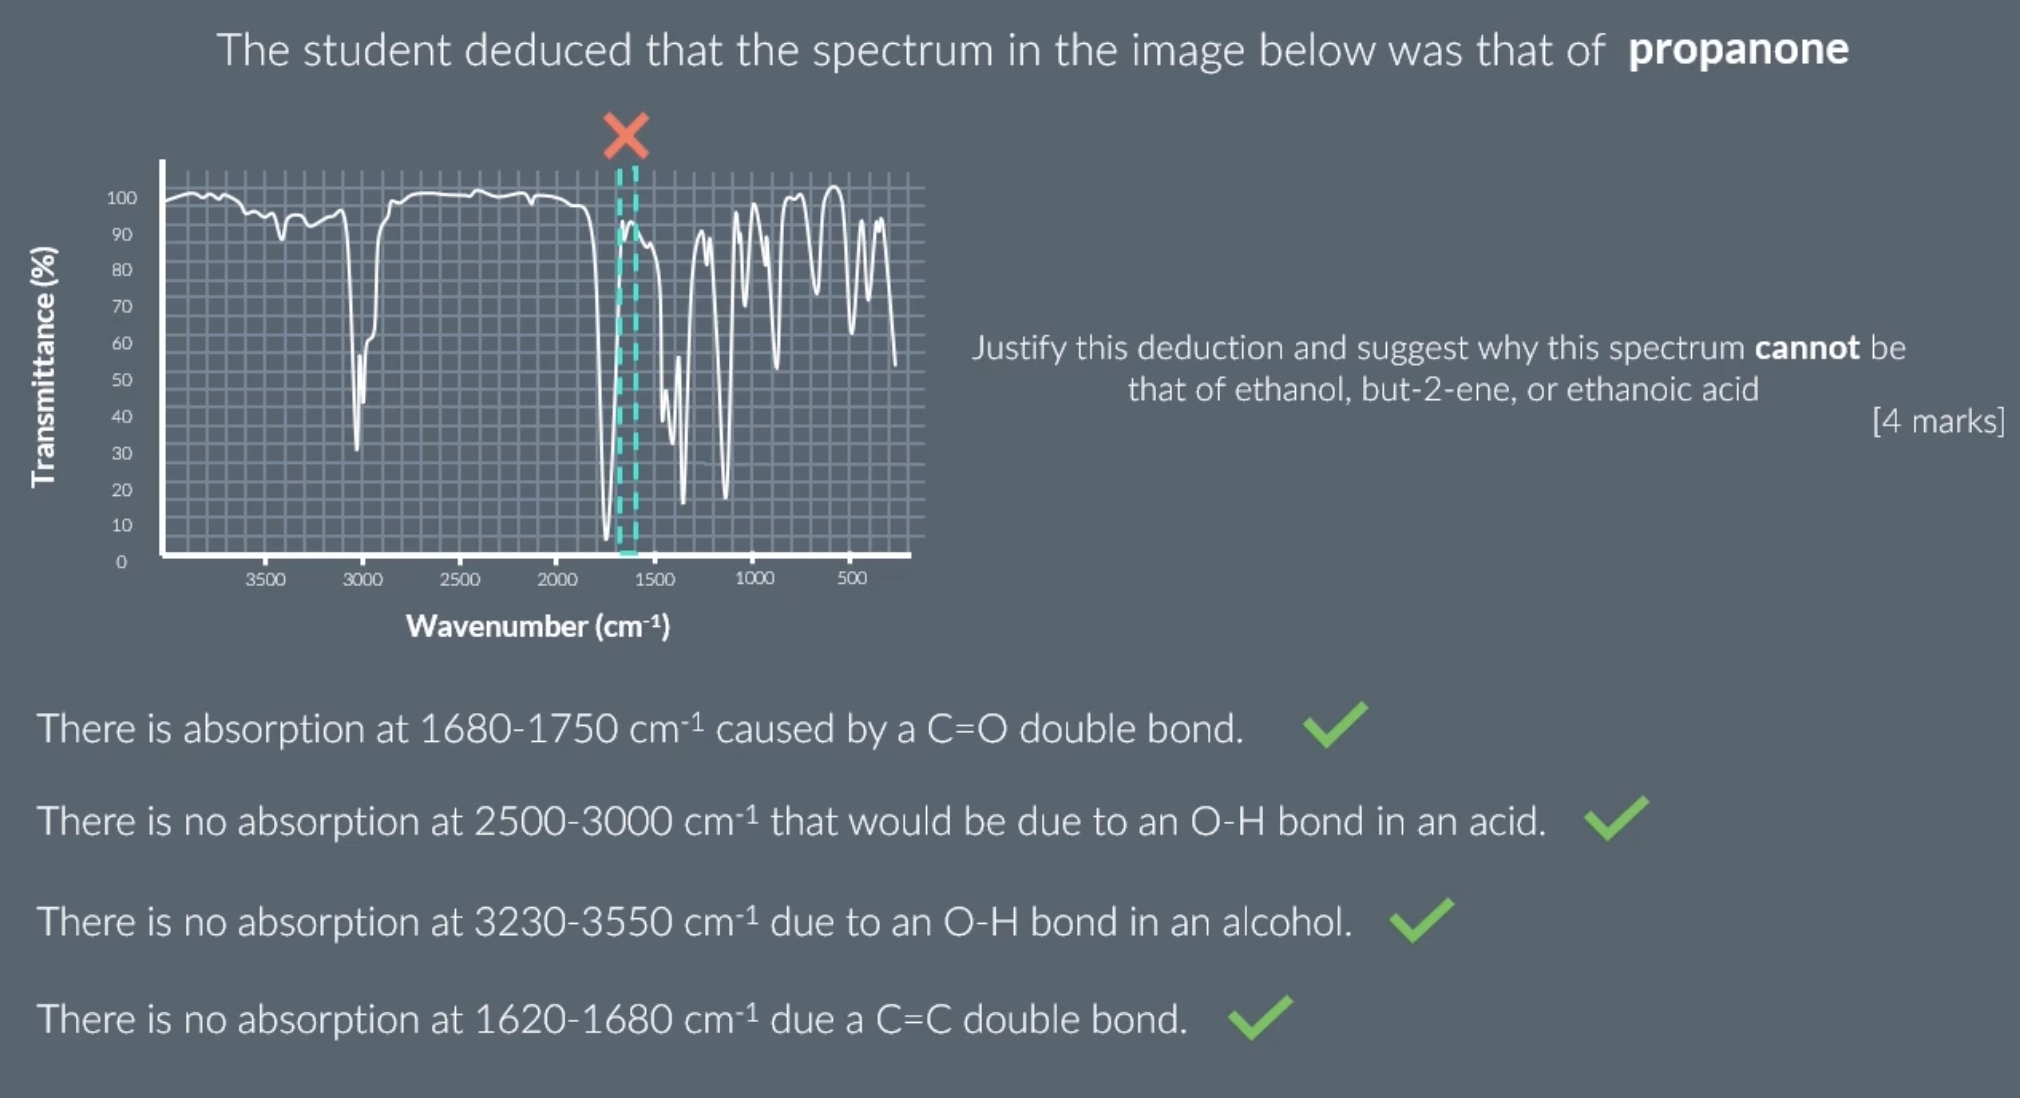
peak at around 1700 = C=0
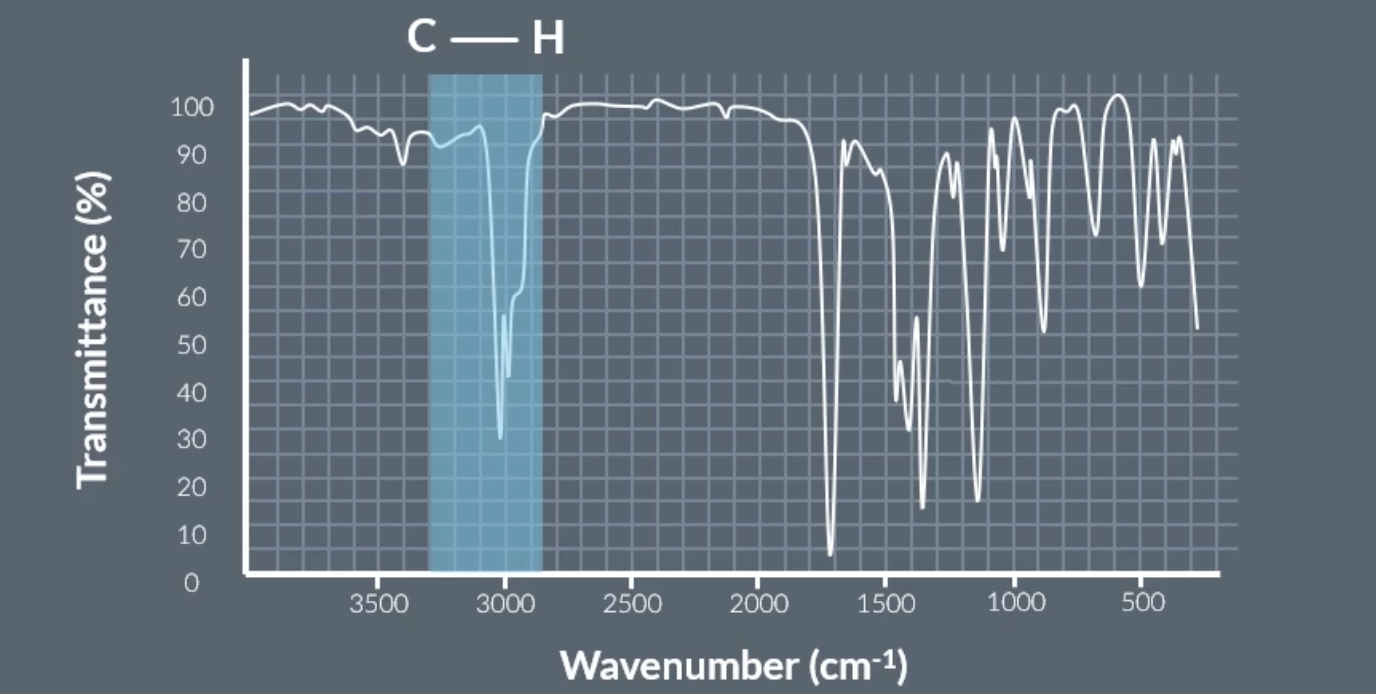
C-H on infrared spectrum graph
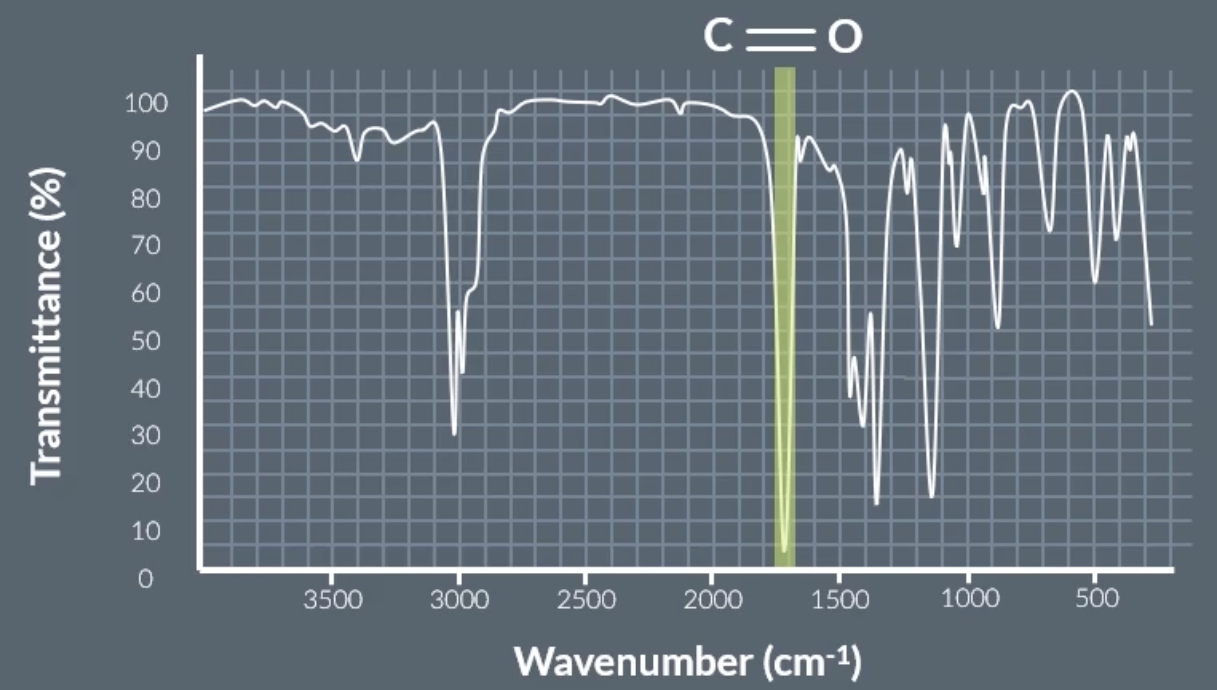
C=O on infrared spectrum graph
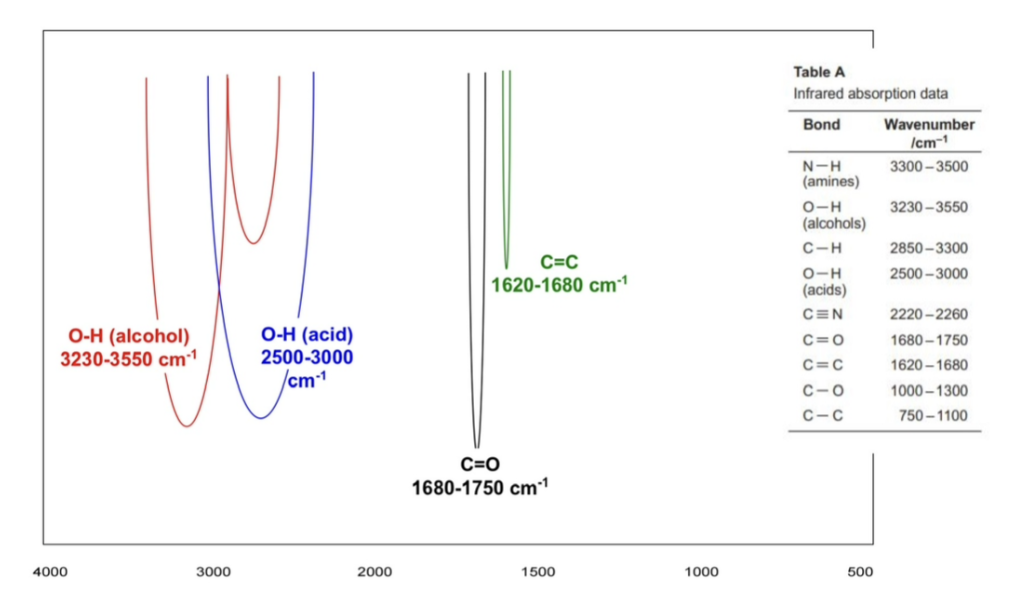
carboxylic acid OH peak vs alcohol OH peak
the first one is an alcohol one, which is more smooth, sharper and narrower at around 3230 - 3550
the second one is a carboxylic acid one, which is more jagged, rough and more broad at around 2500 - 3000

finerprint region
position isomers will relatively show the same infrared spec graph because they contain the same bonds, eg. propan-1-ol and propan-2-ol which both contain C-H and O-H
however the area highlighted in the image represents the fingerprint region which is different for every molecule including position isomers. the fingerprint region is below 1500
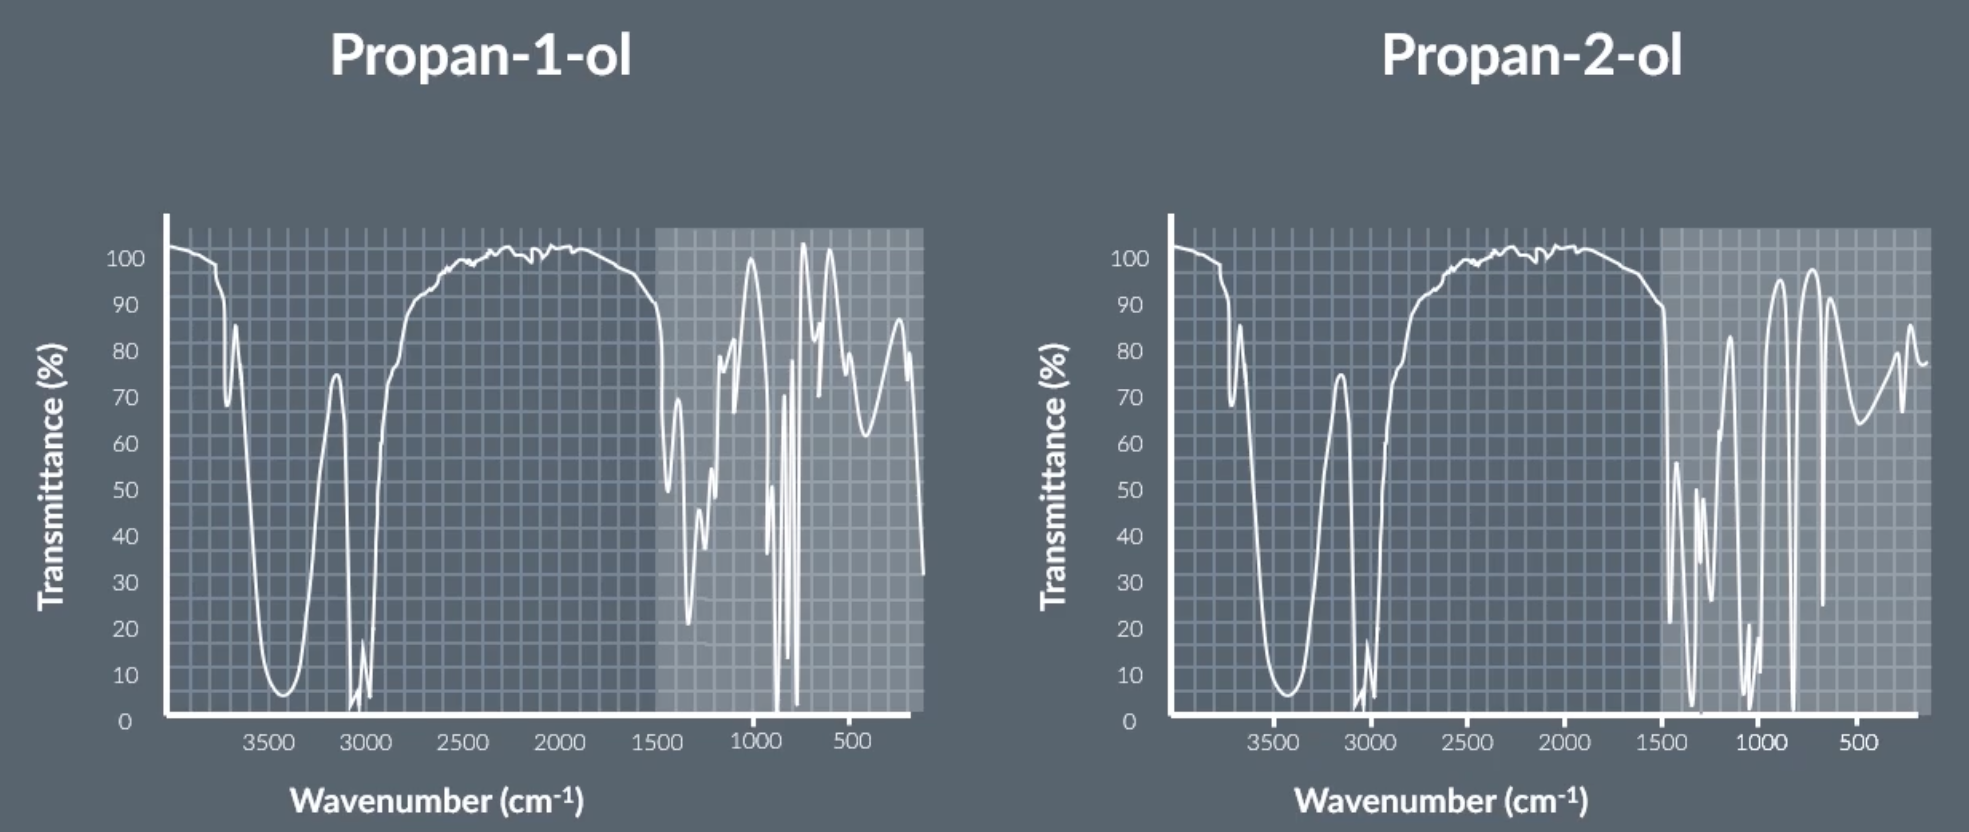
make sure to include the number values and type of bonds when explaining
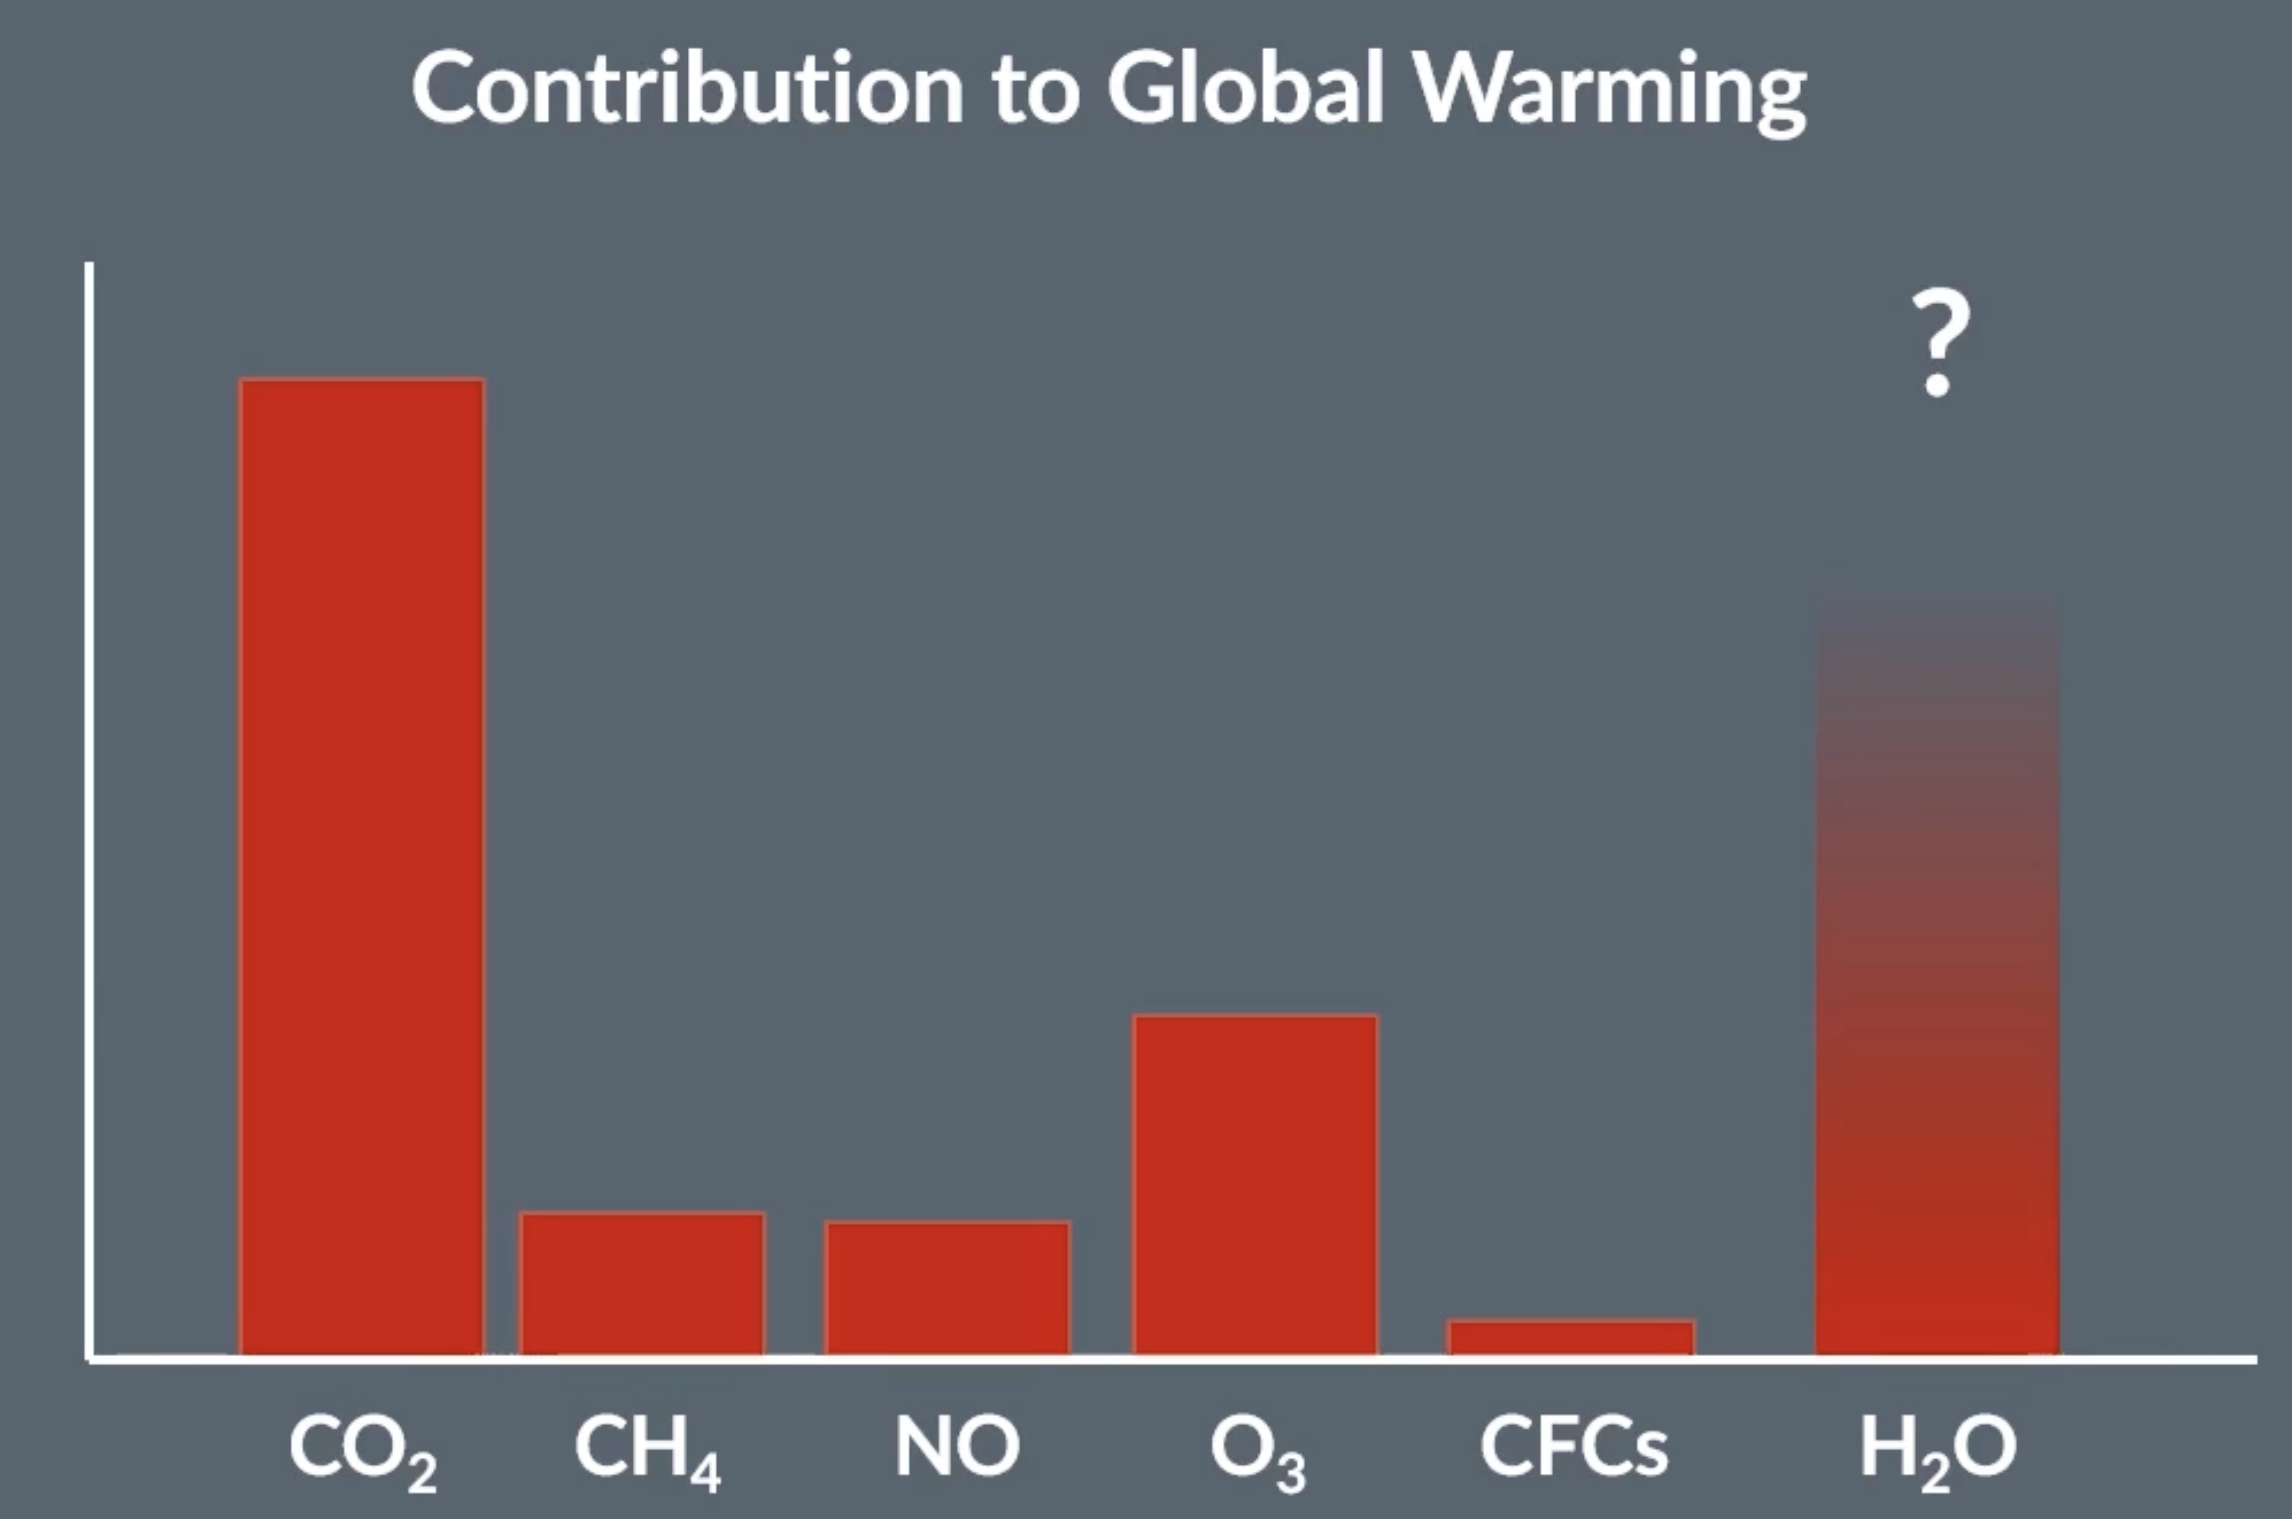
infrared and global warming
when molecules absorb infrared light, they vibrate more, therefore have more kinetic energy = rise in temperature
sun rays which include infrared light are absorbed by molecules in the ground, molecules vibrate more = more kinetic energy = which warms up the earths surface. during night, the surfacer of the earth cools down and heat is given back out as infrared light. some of this light passes out of the atmosphere but some remains and can be absorbed by CO2 in the atmosphere. process repeats with the CO2 molecules, they heat up and release the infrared again. methane and water vapour can also contribute and absorb infrared
if less infrared escapes the atmosphere, temperature increases more = global warming