One-way ANOVAs: Considerations + Assumptions
1/20
There's no tags or description
Looks like no tags are added yet.
Name | Mastery | Learn | Test | Matching | Spaced | Call with Kai |
|---|
No analytics yet
Send a link to your students to track their progress
21 Terms
Why can’t we just run multiple t-tests to compare more than 2 groups? (e.g. comparing Group 1 to 2, 2 to 3, and 1 to 3)
Chance of error accumulates the more tests you compare, known as familywise error
Familywise error def
The probability of making at least one Type I error (incorrectly rejecting H0) when comparing more than 1 pair (so when there’s more than one IV)
Familywise error formula
Familywise error = 1−(1−α)^n
Where n is number of comparisons
Thus, what’s the benefit of ANOVAs?
Keep chance of Type I error at 5% (or whatever alpha level) by comparing multiple tests at once
F-ratio formula + what it essentially means
F = Between groups (or treatment) variance / Within group (or error) variance
Signal + noise / noise
Interpreting F-ratios
F-ratio > 1: null hypothesis supported (no variation)
F-ratio: ≤1: between-group variation is greater than within group variation → may be statistically significant
Next step after F-ratio
Compare F obtained to F crit to see if difference in between and within group variation is statistically significant
Limitation of ANOVAs
A significant F value only tells us that one of the mean is significantly different from the others, not which one
Assumptions for between-subjects ANOVAs (4)
Interval or scale ratio (i.e. meaningful numerical values, not ordinal like with self-report survey scales)
Normality
Homogeneity of variance
Independence of observations
How to check normality (2)
Shapiro-Wilk Test: A significant p-value (<.05) suggests a violation.
Q-Q Plots: Data points should align closely with the diagonal line.
Homogeneity of variance description
Variance within each group should be similar
How to check for homogeneity of variance (1) + rule of thumb (1)
Levene’s Test: A non-significant p-value is desired.
4:1 Rule of Thumb: The largest group variance should be no more than four times the smallest group variance.
Independence of observations (1)
Each participant must provide only one score and belong to only one group. This is typically achieved through random allocation
What’s used as a measure of effect size in between-subjects ANOVAs?
Eta squared
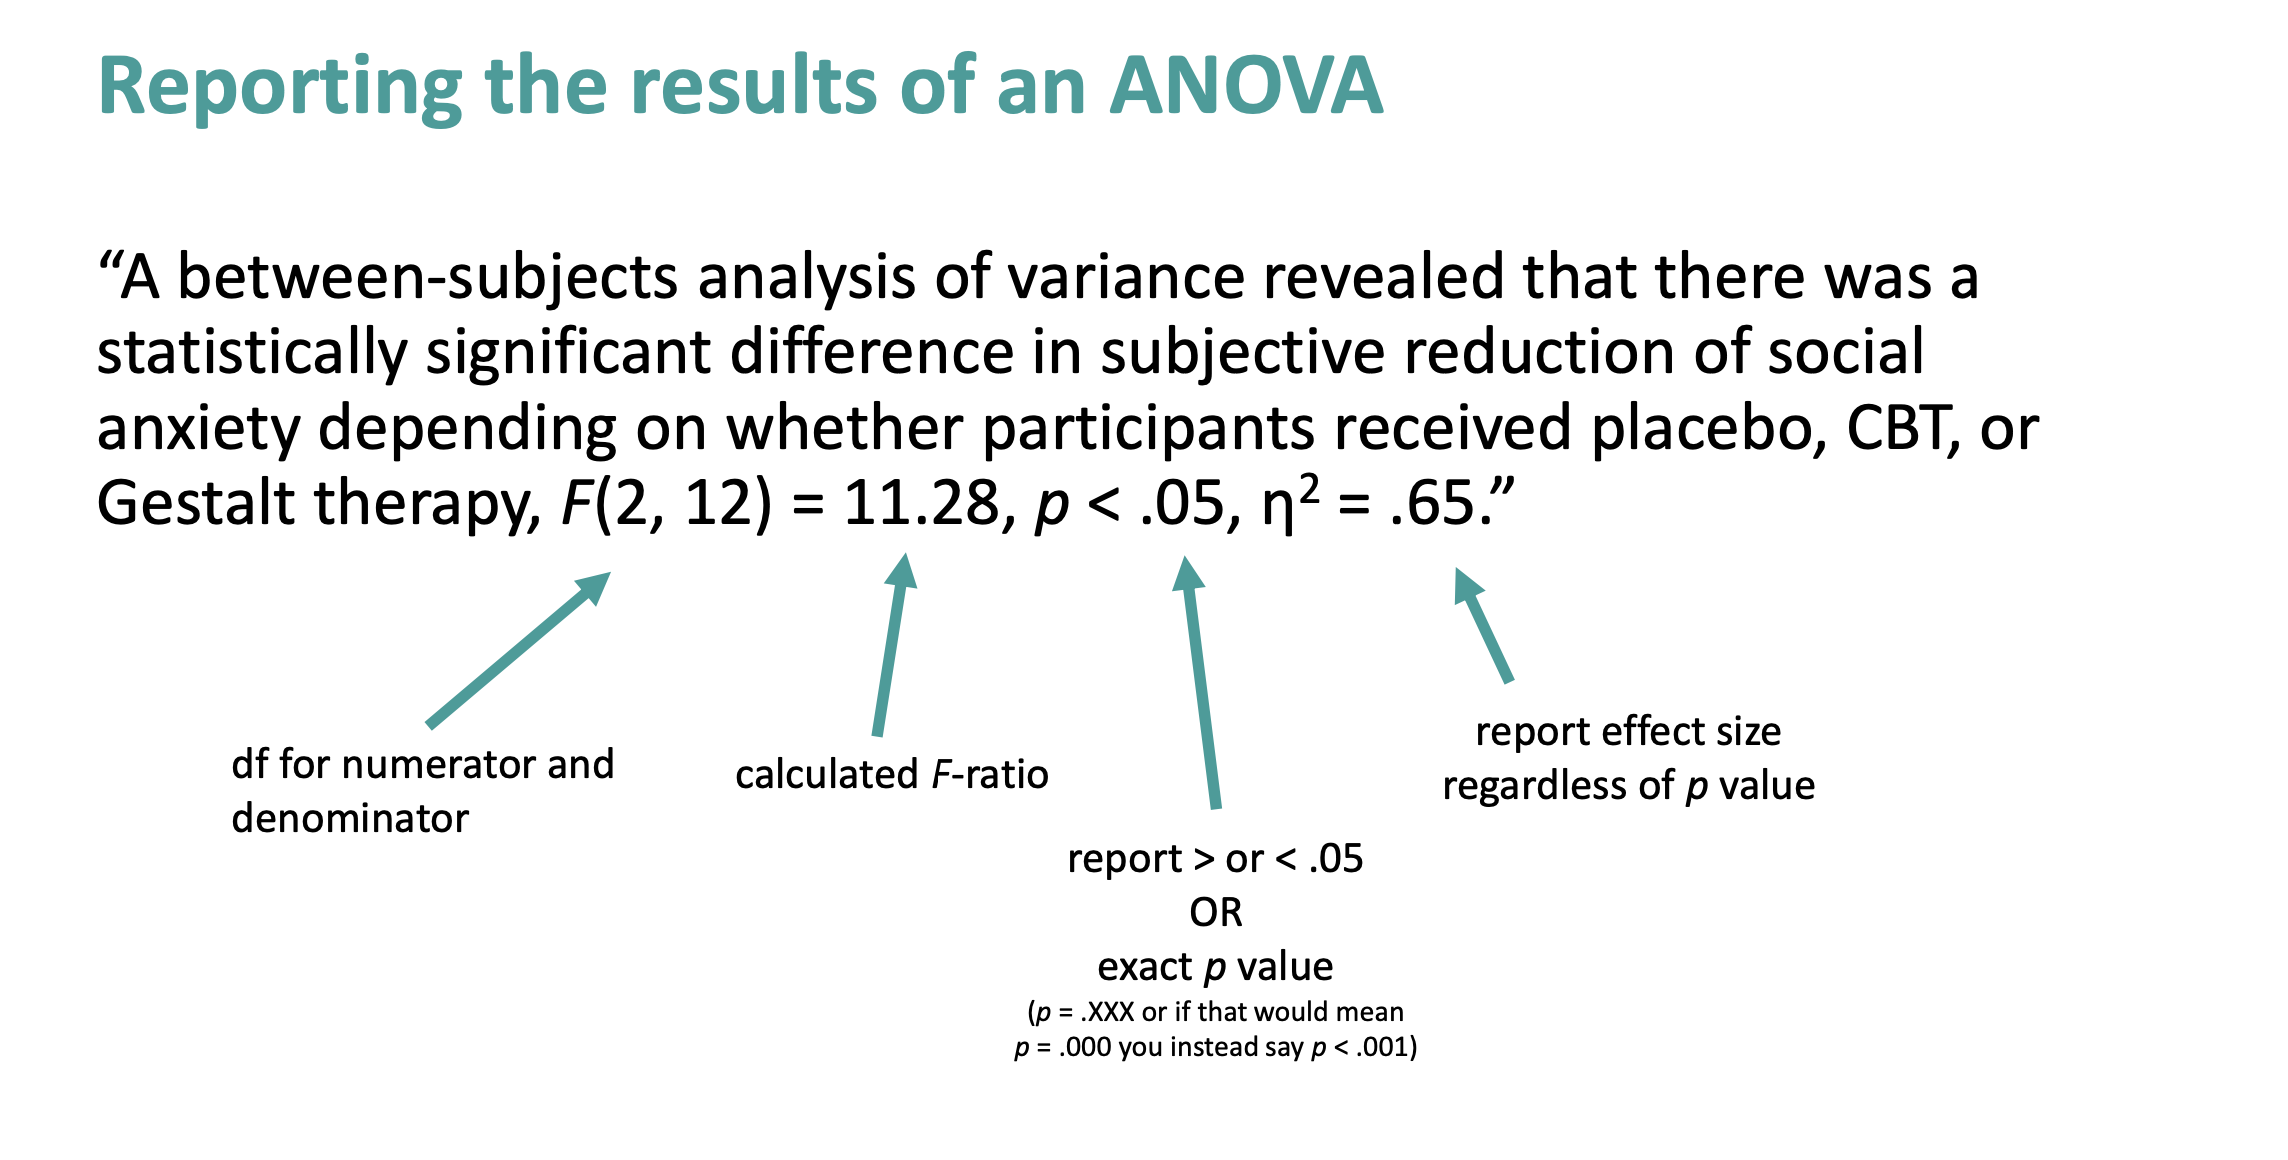
How to report a between-subjects ANOVA
Assumptions for repeated measures ANOVAs
Interval or scale ratio (i.e. meaningful numerical values, not ordinal like with self-report survey scales)
Normality
Independence of observations (within each IV level), but matched data points
Sphericity
Independence of observations (within each IV level) elaboration (1)
Each participant should only contribute one data point per condition
Matched data points elaboration 1)
Each participant has a data point for every condition (complete set of data)
Sphericity def
Variances of differences between all possible pairs of repeated tests are roughly equal
What’s used to check sphericity + what can you do if it’s violated?
Check via Mauchly’s test
Corrections such as Greenhouse-Geisser, which reduce degrees of freedom to prevent the test from becoming too liberal
What’s used as a measure of effect size with repeated measures ANOVAs?
Partial eta squared (since individual difference is filtered out)