Geotechnics and Water Engineering
1/4
There's no tags or description
Looks like no tags are added yet.
Name | Mastery | Learn | Test | Matching | Spaced | Call with Kai |
|---|
No analytics yet
Send a link to your students to track their progress
5 Terms
Sand (Drained) Piles
Drained analysis are driven by the friction angle, and therefore;
τs,ave = K ⋅ σv′ ⋅ tanδ
Qb = σv′ ⋅ Nq
C = C’ (assumed to be 0)
Driven Piles;
Ko < K < Kp
Loose sand k = 1
Dense (Io=0.8) sand k = 2
Bored Piles;
ko > K > Ka
All sands 0.7 < K < 1.0
Clay (Un-Drained) Piles
Undrained analysis are governed by the cohesion / shear strength, Cu, and therefore;
τs,ave = α⋅cu
Qb = Cu ⋅ Nc
C = Cu
0.5 < α < 1.0
0.5 = overly consolidated
1.0 = Normally consolidated
Groups (Piles)
In groups the piles are assumed to act as one singular unit and therefore you covert it to a rectangle by timesing the centre-to-centre by the diameter (for a circular pile).
For piles α = 1 (always).
As = Surface area (for the shaft this is taken by the depth of the layer e.g. 0 → 5m, 5 → 15m) (base = top surface area, shaft = sides surface area).
Critical State Model
Define the Axes:
Draw axes q vs p’ and V vs p’.
Construct the V − ln(p′) Plot:
Draw the Isotropic Normal Compression Line (INCL), straight line with slope −λ. Normal Compression Line Equation V = Vλ −λ*ln(p′).
Draw the unload-reload line (URL). This represents the elastic states. Soil samples move along this line when they are over-consolidated.
Draw critical state line (CSL). The CSL represents the state where soil shears at constant volume and constant stress. V = Γ−λ*ln(p′).
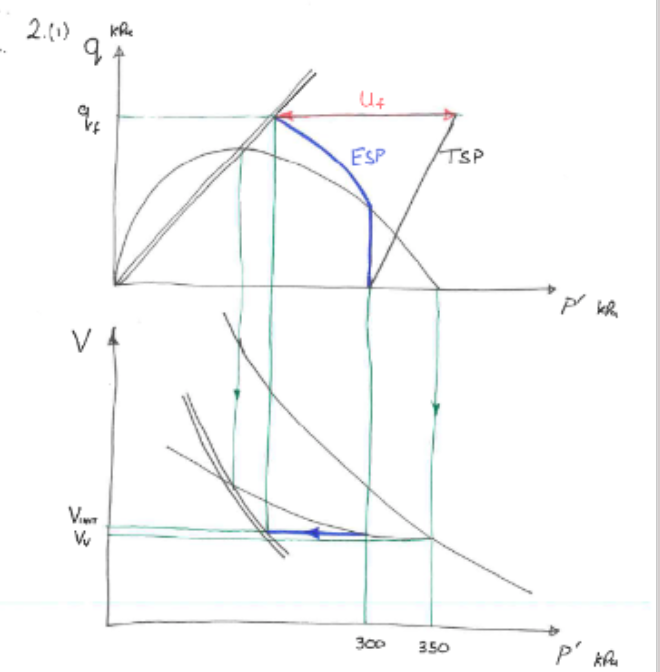
Construct the q−p′ Plot:
Draw critical state line (the double line). p’=? starts. q = M ⋅ p′ (this equation isn’t kind of on formula sheet).
Draw the Cam-Clay Yield Surface. Draw a semi-elliptical curve (the yield locus) that starts at the origin and intersects the p′-axis at the pre-consolidation pressure (pv′).
The Triaxial Stress Paths:
For a Drained Test: Draw a path with a slope of Δq/Δp′=3 starting from the initial stress state (Total Stress Path).
For Un-Drained Test: Draw a path with slope 3 (Total Stress Path).