2. Bivariate linear regression
1/65
There's no tags or description
Looks like no tags are added yet.
Name | Mastery | Learn | Test | Matching | Spaced | Call with Kai |
|---|
No analytics yet
Send a link to your students to track their progress
66 Terms
What is a bivariate econometric model?
A model that involves only 2 variables
What does X represent?
explanatory variable- regressor
What does Y represent?
Dependent variable
variation in some economic variable Y depends linearly upon the variability in another economic variable X
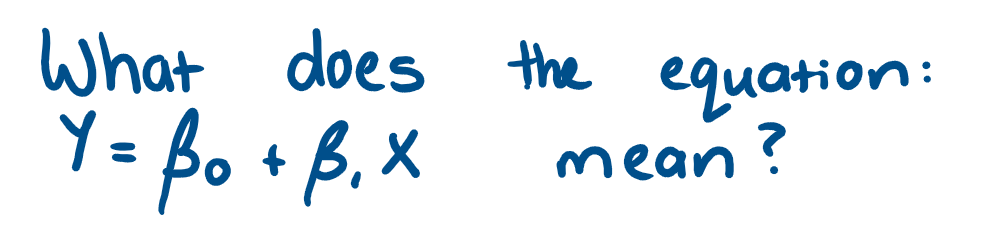
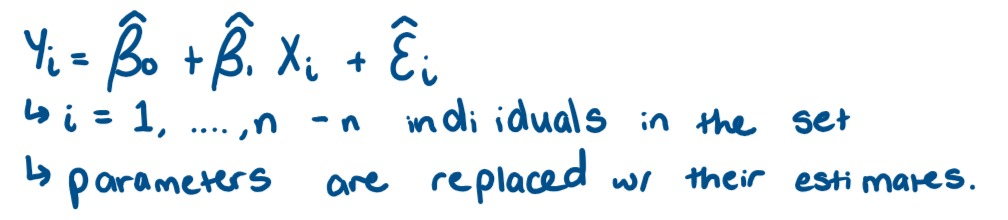
What does a "true" regression model look like?
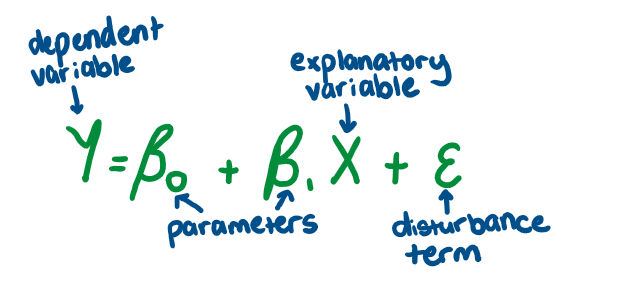
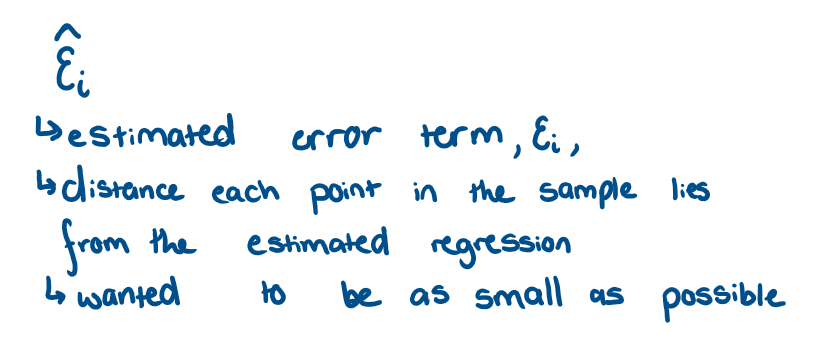
What does the error term(Ɛ) mean?
can be positive or negative
Accounts for any factors that influence Y but aren't inc. in equation
Random variables -cant be quantified or easily modelled
What does the parameter β1 represent?
directly how X affects Y
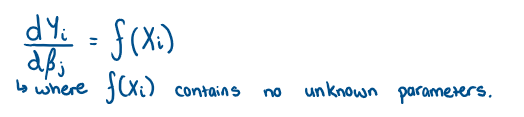
What does it mean if a model is linear?
it is linear in it parameters - doesn’t inc. exponents or products of other parameters
The derivative of Y w.r.t. regression coefficients is a function of only known constants or the regressor X
What is the equation for linearity?

the estimates of the parameters β0 and β1 whose values are unknown
What is the main issue for econometricians?
How to get the estimates - we need data and a statistical procedure → combine the 2 → estimates values of the parameters
How do we know If our estimates are accurate?
relies on using good quality data and an appropriate estimation method
Issues:
- Different model specifications may require different techniques
Why do we want to find the line of best fit
it helps us to find our estimates of β0 and β1
What is the estimated regression line?
What is the residual and what does it give us?
How do we find the line of best fit?
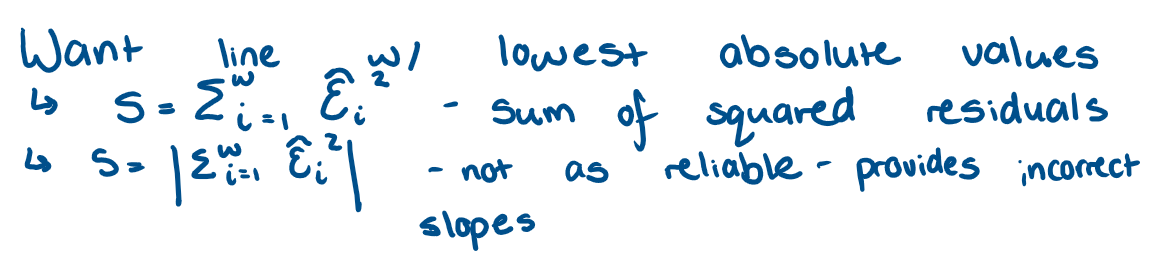
What is Ordinary Least squares estimation (OLS)?
process that finds estimates based on the criteria of sum od squared residuals
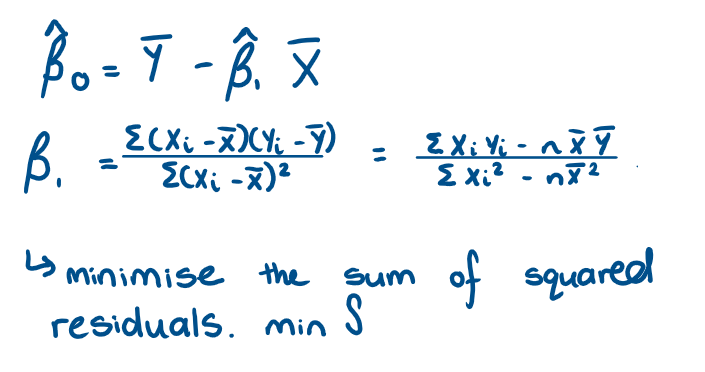
What are the OLS estimators of β0 and β1? And how did we find them?
How do we know that this estimate is an accurate measure of the real but unknown β1?
It is based on the quality of the estimator we have used - need to know if the OLS estimator has good propoerties: unbiasedness and efficiency.
What are classical linear regression assumptions?
the conditions that need to be satisified to make OLS have good properties
What are the 7 Classical Linear regression Assumptions (CLRA)?
The model in the population is written as Yi = β0 + β1Xi + Ɛi
The explanatory variable is fixed or non stochastic (non-random)
There is variation in the X variable
The error has an expected value of 0, E(Ɛi) = 0 for all i
No 2 disturbances are correlated, cov(Ɛi,Ɛj) = E(ƐiƐj) = 0 for all i doesnt = j
Each distrubance has the same finite variance, var(Ɛi) = σ2 for all i
The population error is normally distributed (with mean 0 and variance σ2), Ɛi~N(0,σ2)
What does CLRA1 mean?
The model in the population is written as Yi = β0 + β1Xi + Ɛi
β0 and β1 - unknown constant parameters - linear
Ɛi - unobservable random error
strong assumption rules out models whre there may be clusters of observations
no sub-groups that have different marginal effects on dependent variable
problematic if data is over a period of great instability
What does CLRA2 mean
The explanatory variable is fixed or non stochastic (non-random)
values are fixed in repeated sampling
strong assumption → implies that we can choose values of X to observe the effects on Y
What does CLRA3 mean?
There is variation in the X variable
W/o this denominator of the slope would be 0 → can’t do a value of 0 →cant calculate a value for OLS estimators
What does CLRA 4 mean?
The error has an expected value of 0, E(Ɛi) = 0 for all i
errors have mean 0
error represents disturbing an otherwise stable relationship
What does CLRA5 mean?
No 2 disturbances are correlated, cov(Ɛi,Ɛj) = E(ƐiƐj) = 0 for all i doesnt = j
Errors are not autocorrelated
violation of this assumption occurs in time-series models because the ordering of the data cannot be changes in away that could remedy the issue
What does CLRA 6 mean?
Each disturbance has the same finite variance, var(Ɛi) = σ2 for all i
variance of error is constant for all observations.
Error is homoscedastic → violation occurs in cross-sectional models
What does CLRA7 mean?
The population error is normally distributed (with mean 0 and variance σ2), Ɛi~N(0,σ2)
each error has the same normal distribution w/ the same mean and variance.
Strongest assumption
in order to derive the distribution with the same mean and variance. → perform hypothesis testing
What are the 3 theoretical results?
Under CLRA1-CLRA4: OLS estimators are unbiased → E(β0 hat) = β0
Under CLRA1- CLRA6: Gauss-Markov theorem states → OLS estimator is the best linear unbiased estimator →OLS has the minimum estimator → most efficient amongst all linear unbiased estimators → Best Linear Unbiased Estimators.
Under CLRA1-CLRA7, OLS estimator is the Minimum Variance Unbiased Estimator in the class of all linear and nonlinear estimators.
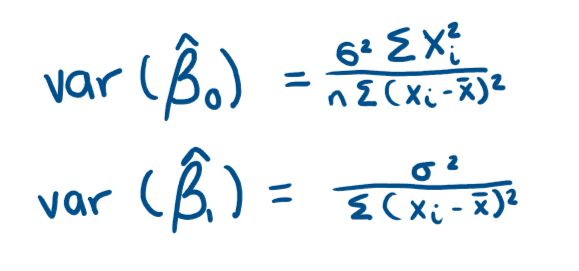
What does how close the estimate is to the population value depend on?
situated at the centre of the distribution when the estimator is unbiased, depends on the variation in the estimates.
lower variance →higher chance that our single estimate will be close to the population value
WE WANT OUR ESTIMATOR TO HAVE A LOW VARIANCE
How is the lowest possible variance by unbiased estimators found out
How do we fix the fact that a variable is not controlled
choose it randomly/ allocate randomly → makes them indepefndent of each other
What is an unoberserved factor?
it cannot be measured → more difficult to deal with
What will we do when X is not fixed but rather a random regressor?
affects unbiassed properties, usirng TR1. We need to make different assumptions on how Xi and Ɛi are related
What is correlation?
measure of linear dependence between 2 variables
How can we define the relationship between Xi and Ɛi?
The expected value of Ɛi given Xi.
we need to make an assumption about the expected value of Ɛi for that slice of the population described by Xi.
We need to assume that the average value of Ɛi doesn’t depend on the value of Xi
E(Ɛi|Xi) = E(Ɛi)
What does E(Ɛi|Xi) = E(Ɛi) mean?
says that X and Ɛ are mean independent → X is strictly exogenous to Ɛ
What is the zero conditional mean assumption?
E(Ɛi|Xi) = E(Ɛ) combined with CLRA4
E(Ɛi|Xi) = 0
What does the zero conditional mean assumption say?
conditional mean of the random error term is the same for all population values of X → doesnt depend, either linearly or nonlinearly on X
common conditional population mean of the disturbance, for all values of X is zero.
What does the conditional mean assumption imply?
unconditional mean of the population values of the random error term equals 0 → (E(Ɛi|Xi) = 0 → E(Ɛi) = 0 → E[(Ɛ|X)] = E(Ɛ) → E(Ɛ|X) = 0 → E(Ɛ) = E[E(Ɛ|X)] = E(0) = 0 → CLRA4
What is the law of iterated expectations (L.I.E)?
E[E(Ɛ|X)] = E(Ɛ)
What are the Classical Linear Regression Assumption used to express random X scenario with the 0 conditional mean assumption?
The model in the population is written as Yi = β0 + β1Xi + Ɛi
There is variation in the X variable
The error has an expected value of 0, E(Ɛi) = 0 for all i → zero conditional mean assumption
The disturbances are conditionally uncorrelated, cov(Ɛi,Ɛj|X) = 0 for all i doesnt = j → erros are not autocorrelated + i and j are time periods
Homoscedasticity each disturbance has the same finite conditional variance, var(Ɛi|X) = σ2 for all i
The population error, conditional on X, is normally distributed Ɛi|X~N(0,σ2)
What is different about CLRA3?
The error has an expected value of 0, E(Ɛi) = 0 for all i → zero conditional mean assumption
for time series data → more careful about jpw we define our assumption → could state it as contemporanous exogeneity where Ɛ at time t is uncorrelated with X at time t E(Ɛt|Xt) = 0 → OLS consistent but not unbiased
for OLS to be unbiased we need a stronger assumption of strict exogeneity which requires Ɛ at time t is uncorrelated with X at all time periods. E(Ɛt|X) = 0
Which set of assumption do we use and why?
2nd set of assumptions as most exercises the regressors are random not fixed + are the ones we need to be satisfied by our regression models
Where does the proof of unbiasedness come from?
follows from the fact that conditioning on X effectively makes X non-random → proof follows along similar lines as for fixed X
E(XiƐi|Xi) = XiE(Ɛi|Xi), and given by CLRA3 we get E(Ɛi|Xi) = 0 → unbiasedness follows
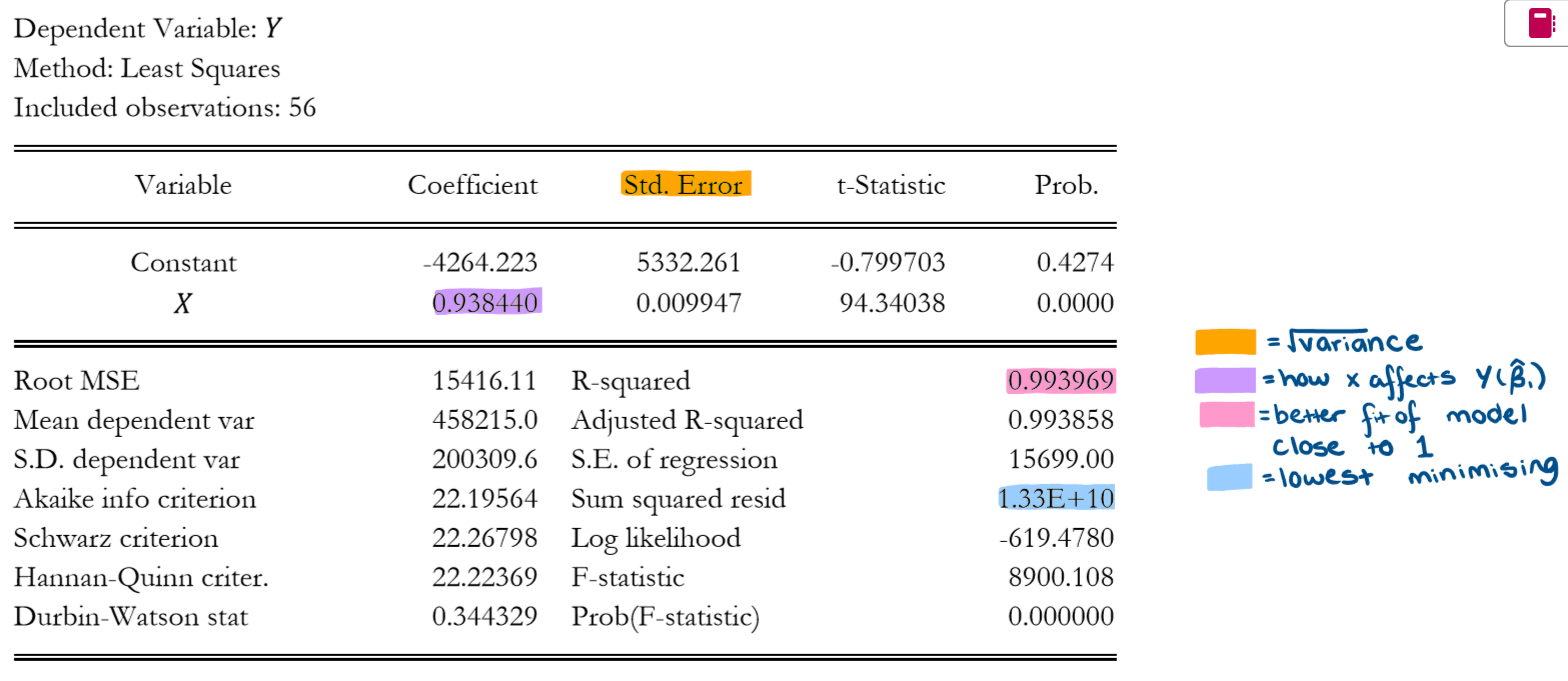
How doe we measure how good a line fits
coefficient of determination (R2)
What is the equation for Total Sum of Squares, (TSS)

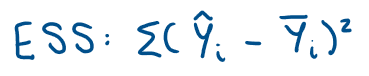
What is the equation for the Estimated sum of Squares (ESS)
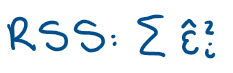
What is the equation for the residual sum of squares?
How are TSS, ESS and RSS related?
TSS = ESS + RSS
total variation of the Y values around their mean = sum of total variation of the estimated Y values around the mean and the residual variation of Y
What does TSS = ESS + RSS mean?
If the regression line fits throgh the points very well we would expect the residual variation to be small
in extreme case all points lie exactly on the line so that the RSS = 0, but this is very unlikely to occur. The R2 value tells us how much of the total variation of Y is attributable to the regression line
What is the equation for R2?
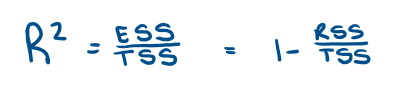
How do we interpret R2 value?
0 _< R2 _<1
closer to 1 → better the fit of the regression line
closer to 0 → worse the fit → higher residual variation
We want it to be closer to 1.
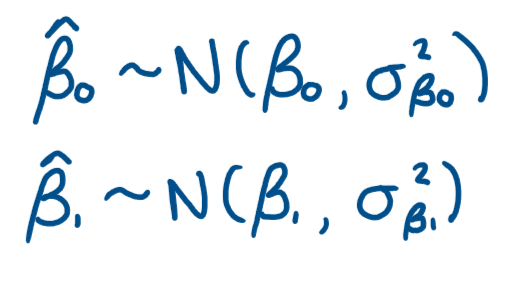
For t-tests what are the distributional aspects of the OLS estimators?
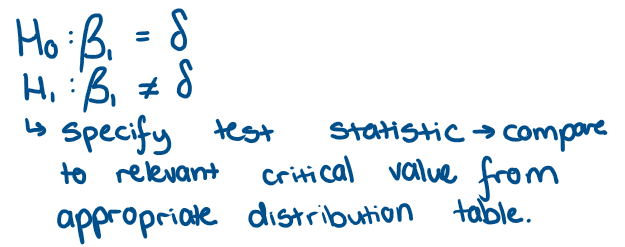
What does a 2 sided test look like? and how do we do it?
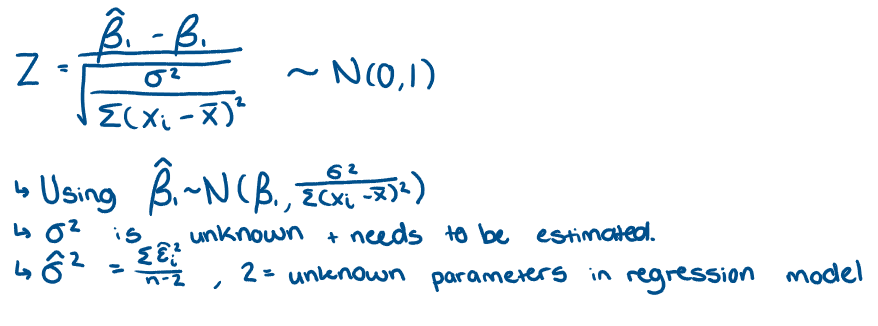
What is the Standard normal distribution and how did we get it?
What is the difference between t distribution and standard normal distribution?
Replacing sigma2 in standard normal distribution with the estimator → distribution changes
What is the t distribution?
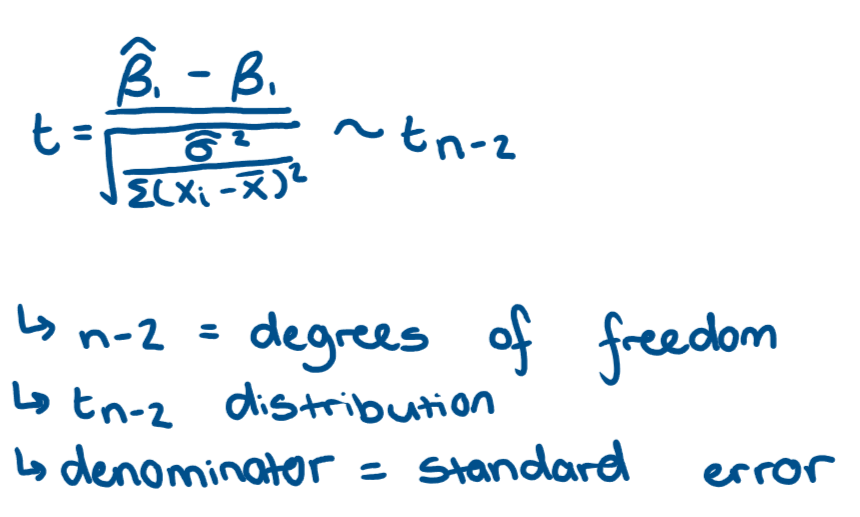
What is another way of writing a t distribution?
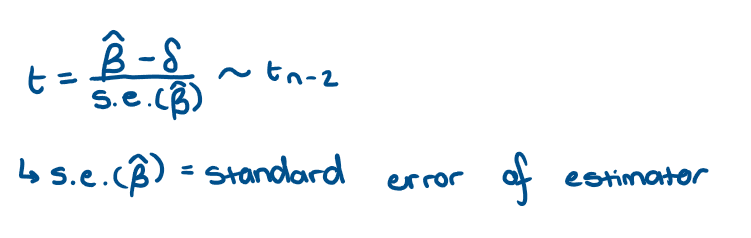
How do we perform a t-test?
calculate test statistic from equation → compare to c.v. from t distribution table → decide whether to reject or not → by choosing a significance level and given the degrees of freedom
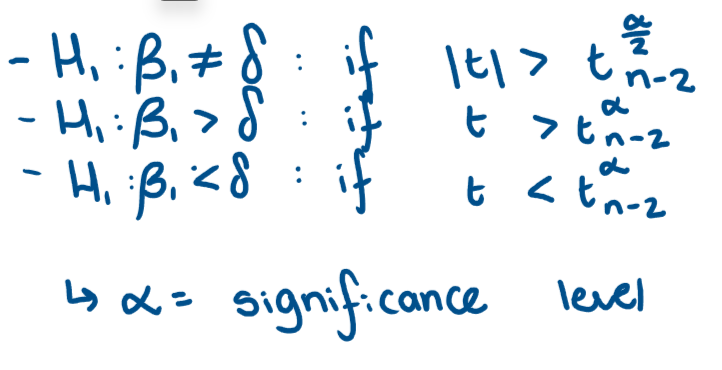
For each test when do we reject the null in favour of the alternative hypothesis?
Why is test of significance called this?
the null and alternative hypotheses are for a specific valye that the parameter is equal to 0
What are we testing in a test of significance?
test the significanceof the X variable in regression model → test whether the peremeter on X is equal to 0 → we are testing the effect that variable X has on Y is 0
Hence we test H0:β1 = 0 against H1:β1 =/ 0
For a t-statistic what is our probability statement?
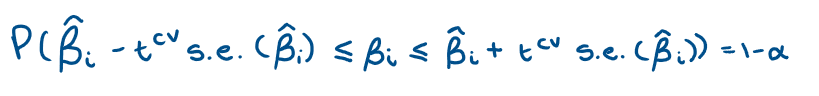
Using a t-statistic, what do we get as a confidence band/interval?
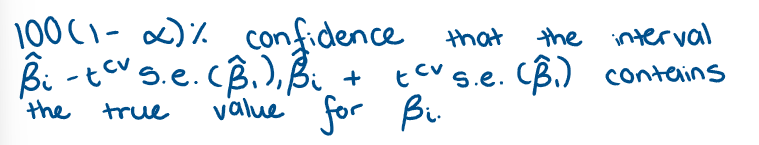
How do you read a statistical statement?