Between-subjects/independent t-tests
1/14
There's no tags or description
Looks like no tags are added yet.
Name | Mastery | Learn | Test | Matching | Spaced | Call with Kai |
|---|
No analytics yet
Send a link to your students to track their progress
15 Terms
When are between-subjects t-tests used? (1)
Comparing two samples who have received different levels of an IV, to see if IV affects DV (H1) or it doesn’t (H0)
Prediction of null hypothesis (formula)
No significant difference between population means: any observed difference is due to chance
Prediction of alternative hypothesis
Significant difference between population means
Required info (3)
For each group:
Sample mean
Individual values
^^To calculate sum of squares (SS), don’t need if provided with SS
Sample size
Step 1 (1)
Estimate population variance
Step 1a (1→2)
Estimate population variance from each sample
s²1 = ∑(X1 - X̅1)² / n1 - 1
s²2 = ∑(X2 - X̅2)² / n2 - 1
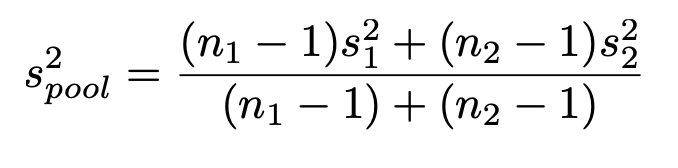
Step 1b (1)
Calculate pooled variance
Using estimated population variances from each sample, and sample sizes of each sample
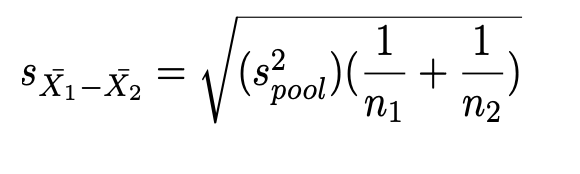
Step 2 (1)
Estimate standard error of the distribution of sample mean differences
Using pooled variance and sample sizes of each sample
Step 3 (1)
Calculate difference between sample means, i.e. mean difference
X̅1 - X̅2
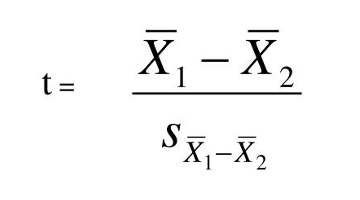
Step 4 (1)
Calculate t-obtained
Using mean difference and standard error
Step 5 (1, 1→2, 1)
Compare t-obtained to t-crit.
Find t-crit. using
df = (n1 - 1) + (n2 - 1)
Alpha level (usually .05)
Is t-obtained > t-crit.? If so, then p <.05 → reject null hypothesis (likely statistically significant, i.e. observed effect in DV is due to IV, not chance)
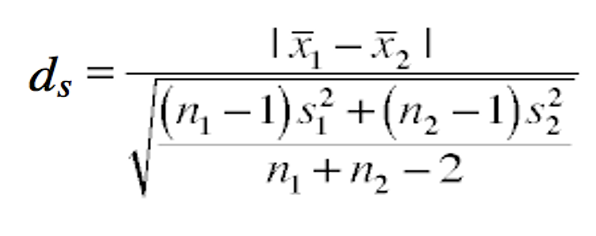
How do you calculate effect size for between-subjects t-tests? (1)
ds (Cohen’s d for between measures) = absolute value of difference between means / square root of pooled variance
Important note on one vs two-tailed t-test tables (2)
Typically use two-tailed
BUT if using one-tailed → double alpha level (e.g. to find a one-tailed α=.05, look under the α=.10 column)
Assumptions (4)
Interval or ratio scale
Normality
Independence of observations
Homogeneity of variance
Homogeneity of variance def (1)
Assumes that population standard deviation is the same in both groups, i.e. population standard deviation of one sample is no more than 3-4 times larger than other sample (usually 4 probs)