BESC 3010 Practice Final
1/74
There's no tags or description
Looks like no tags are added yet.
Name | Mastery | Learn | Test | Matching | Spaced | Call with Kai |
|---|
No analytics yet
Send a link to your students to track their progress
75 Terms
In a sample of women, the number of children that each woman has is an example of which
level of measurement?
a. Nominal
b. Ordinal
c. Interval
d. Ratio
Ratio
Military ranks are an example of what level of measurement?
a. Nominal
b. Ordinal
c. Interval
d. Ratio
Ordinal
Gender is an example of what level of measurement?
a. Nominal
b. Ordinal
c. Interval
d. Ratio
Nominal
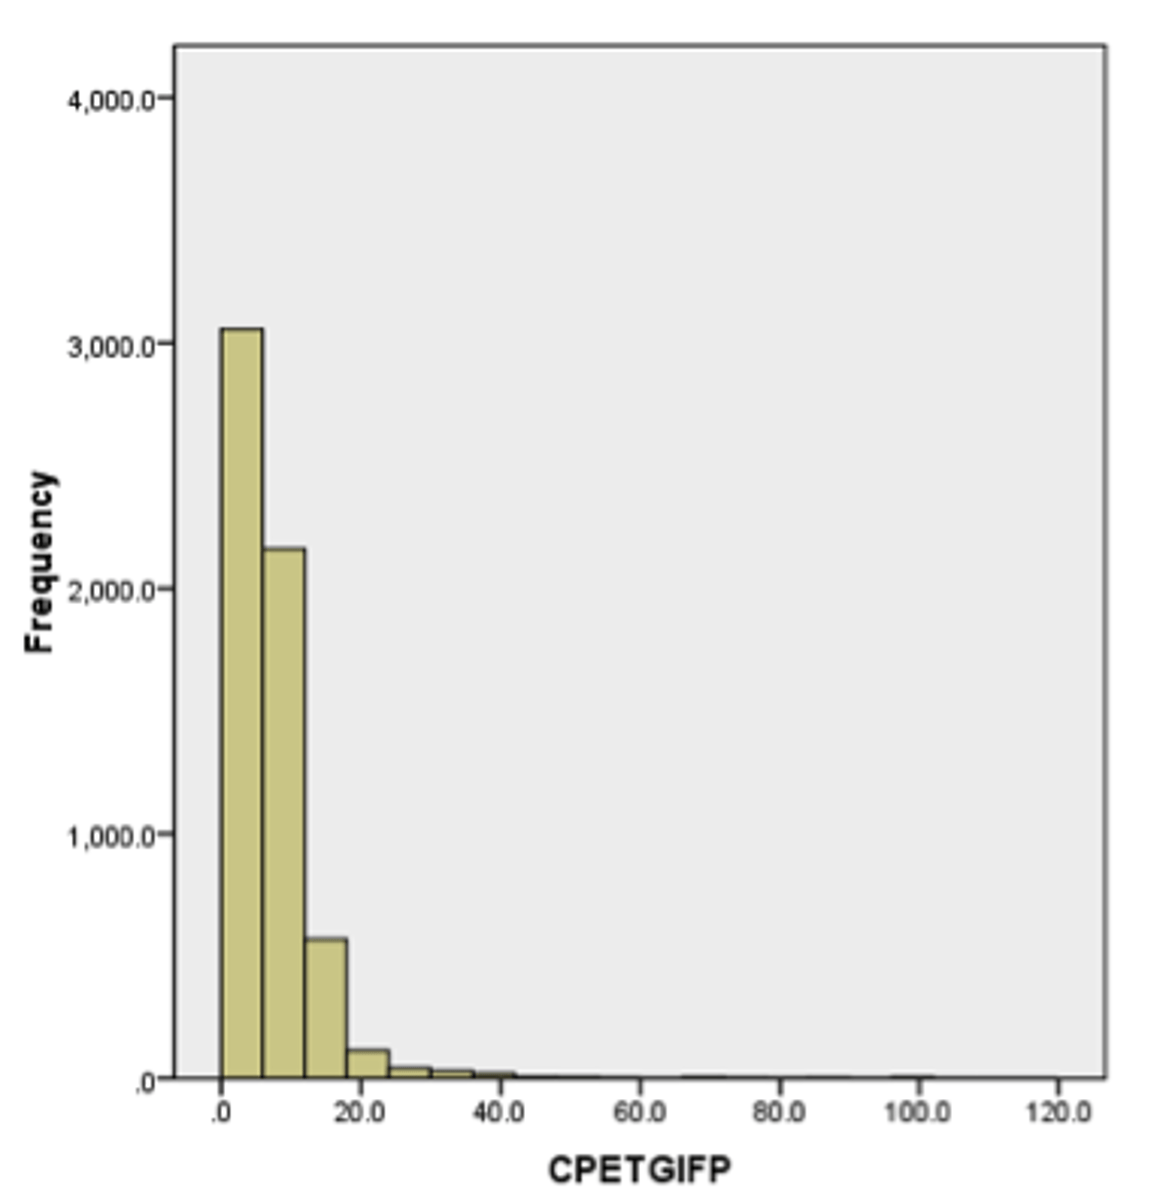
Which label would be most appropriate for describing the distribution below?
a. Normal
b. Platykurtic
c. Positively Skewed
d. Negatively Skewed
Positively skewed
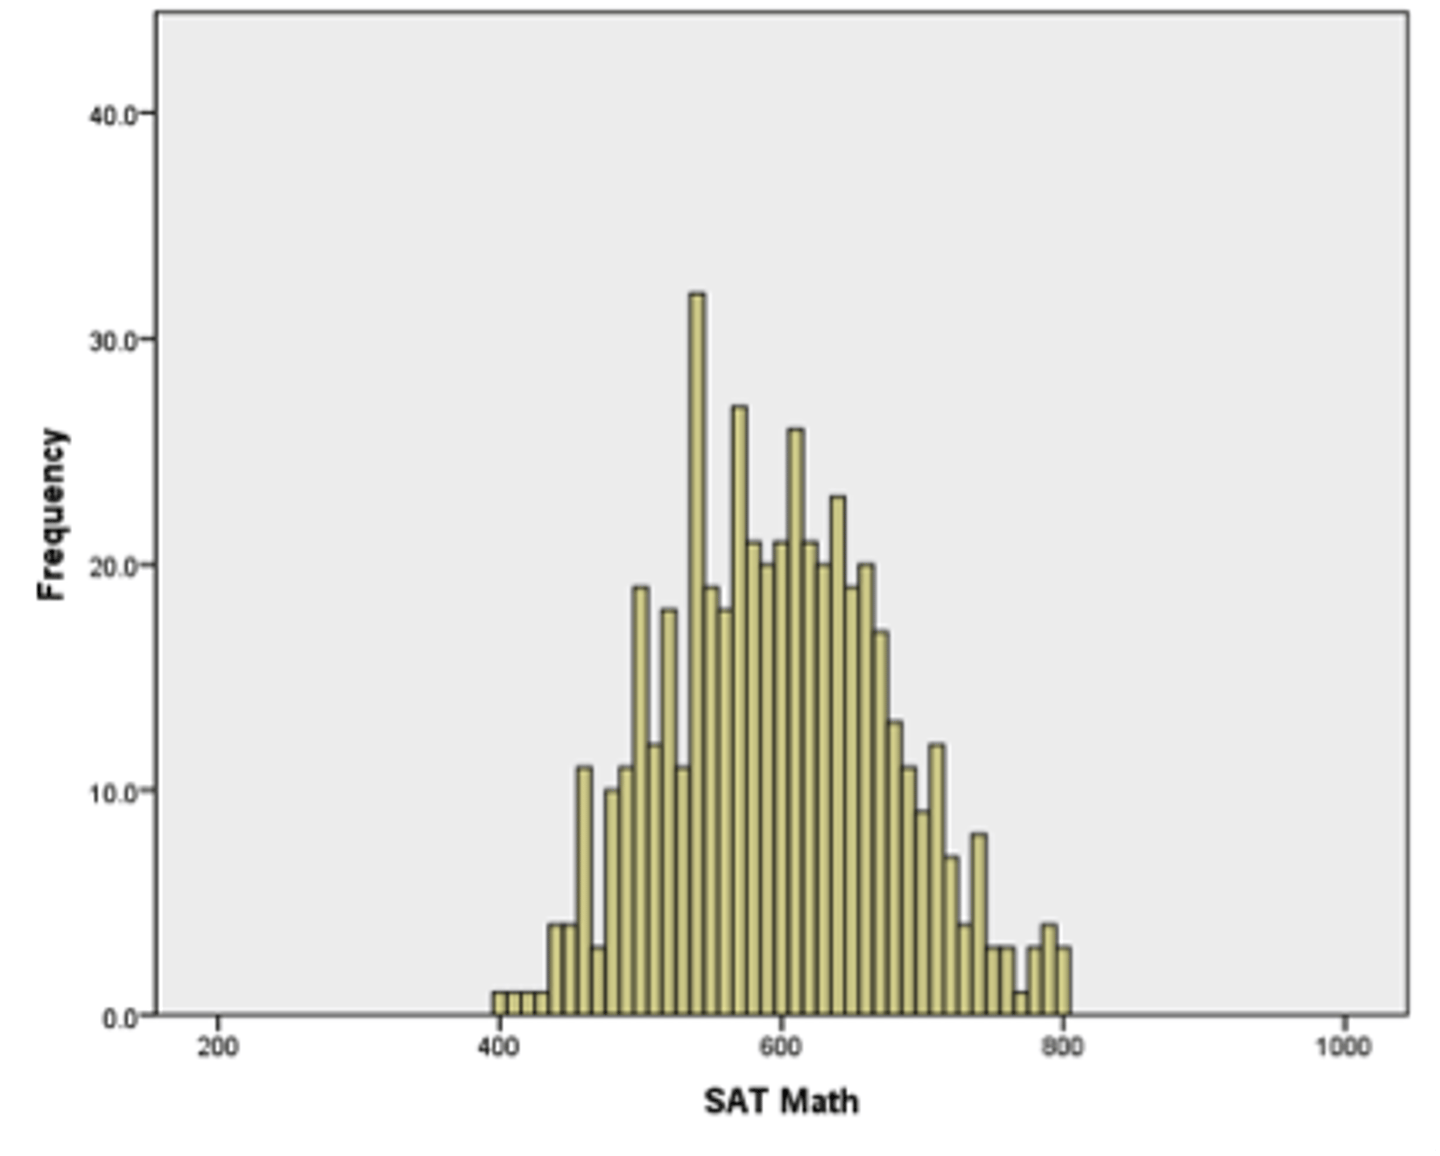
Which label would be most appropriate for describing the distribution below?
a. Negatively skewed
b. Leptokurtic
c. Normal
d. Bimodal
Normal
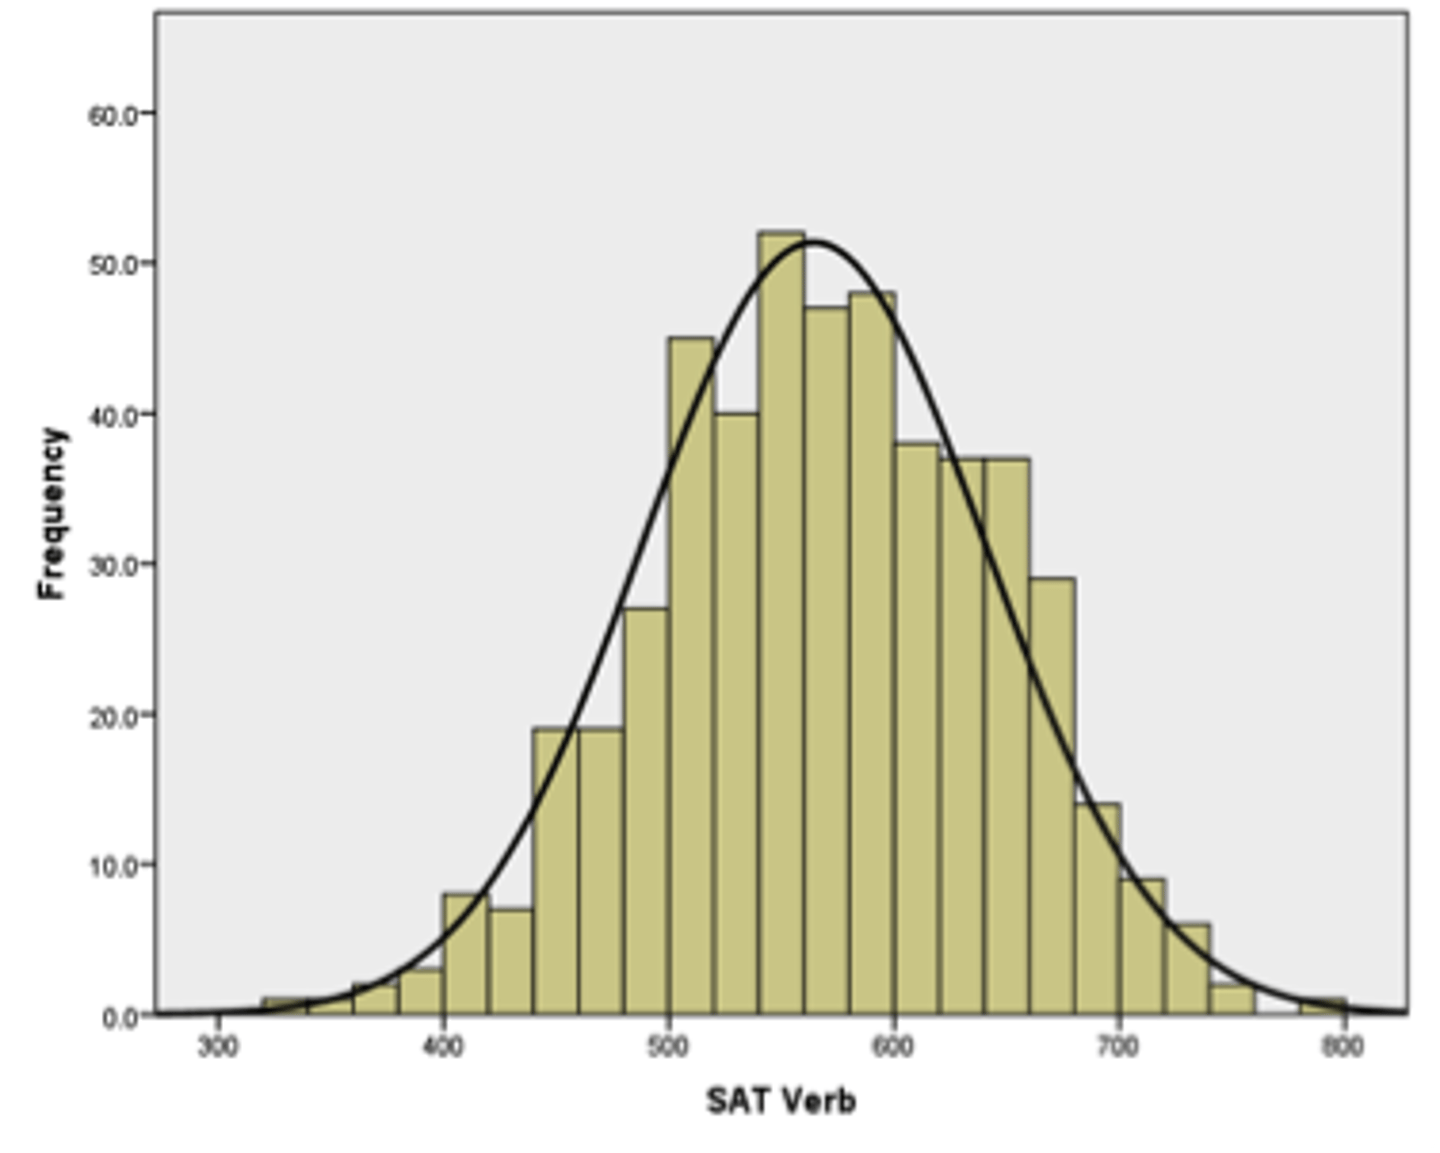
Which label would be most appropriate for describing the distribution below?
a. Mesokurtic
b. Leptokurtic
c. Platykurtic
d. None of the above
Mesokurtic
In which of the following situations is the median an appropriate measure of central tendency?
a. When the average is very high
b. When the mode is less than 10
c. The researcher has ordinal data
d. When the data set has an even number of scores
Researcher has ordinal data
Which of the following is not true about the normal distribution?
a. Kurtosis = 1
b. Mean = mode
c. Mode = median
d. Skewness = 0
Kurtosis=1
The visual difference between bar graphs and histograms is that in ____________ the bars touch each other and in ______________ the bars do not touch.
a. Bar graphs, histograms
b. Histograms, bar graphs
c. Normal distributions, highly skewed distributions
d. None of the above are true.
Histograms, bar graphs
Compared to the normal distribution, a leptokurtic distribution has a ____________ than the normal distribution.
a. Rounder peak
b. More elongated tail
c. Taller peak
d. Flatter peak
taller peak
If the dots on a scatterplot generally extend from the bottom left to the upper right of the diagram but are very widely spread out, the researcher would report the correlation as:
a. Strong and positive
b. Strong and negative
c. Weak and positive
d. Weak and negative
Weak and positive
The three measures of variability are:
a. Mean, median, mode
b. z-score, effect size, independent variable
c. Normal, bimodal, unimodal
d. Range, variance, standard deviation
range, variance, standard deviation
Which option is the mean of the numbers below?
4 5 4 4 3 5 6 3 4 2
a. 10
b. 8
c. 4
d. 4.5
4
Which option is the median of the numbers below?
4 5 4 4 3 5 6 3 4 2
a. 3
b. 5
c. 4
d. 3.5
4
Which is the mode of the numbers below?
4 5 4 4 3 5 6 3 4 2
a. 3
b. 5
c. 4
d. 3.5
4
What is the standard deviation of the sample represented by the numbers below?
4 5 4 4 3 5 6 3 4 2`
a. 5
b. 4.25
c. 3.5
d. 1.10
1.10
What is the variance of the sample represented by the numbers below?
4 5 4 4 3 5 6 3 4 2
a. 25
b. 18.06
c. 12.25
d. 1.21
1.21
What type of variability is used to screen for data entry errors and outliers?
a. Range
b. Standard Deviation
c. Variance
d. Mean
range
A problem with using the sample standard deviation to estimate the population standard
deviation is
a. The sample standard deviation underestimates the population standard deviation.
b. It is not logically defensible to make estimates about the population based on just sample data.
c. The sample standard deviation and population standard deviation formulas are too dissimilar for comparison.
d. None of the above
The sample standard deviation underestimates the population standard deviation
If variance is very low
a. The individuals in the data set are very different from each other
b. The standard deviation is 0
c. The data set is too big
d. The individuals in the data set are very similar to each other
The individuals in the data set are very similar to each other
Which is the lowest level of measurement needed to calculate a mean?
a. Ratio
b. Nominal
c. Interval
d. Ordinal
Interval
What is the minimal level of data required to calculate a mode?
a. Ratio
b. Interval
c. Ordinal
d. Nominal
Nominal
If a data set is converted to z-scores, the new mean of the data set is:
a. 1
b. 3
c. 0
d. -1
0
If a data set is converted to z-scores, the new standard deviation of the data set is:
a. 2
b. 1
c. 5
d. 3
1
If the mean of a sample is 4, and the standard deviation is 4, what is the z-score for a raw score of 6?
a. 10
b. 2
c. 0.5
d. -1
0.5
When the population mean and variance is known, it is most appropriate to use:
a. A two-sample t-test
b. A chi-squared test
c. A z-test
d. None of the above
a z test
When conducting a z-test, which probability distribution would be appropriate to use?
a. F-distribution
b. z-distribution
c. t-distribution
d. Chi-squared distribution
z distribution
Which effect size is most appropriate for z-tests?
a. eta-squared
b. Pearson's r
c. r2
d. Cohen's d
Cohens d
Which z-score is closest to the mean?
a. 3.3
b. -1.2
c. .02
d. -.6
0.2
In a normal distribution, it is very unusual to find scores outside of what range of z-scores?
a. -1 and 1
b. 0 and 10
c. -3 and 3
d. 0 and 5
-3 and +3
If a raw score distribution has a mean of 12 and a standard deviation of 3, what number would have a z-score of -2?
a. 6
b. 9
c. 15
d. 36
6
A researcher uses alpha as the criteria or critical value for the maximum probability of incorrectly rejecting the null hypothesis. She conducts a z-test with alpha = .05 and finds the pvalue is .02. The researcher should:
a. Fail to reject (i.e., retain) the null hypothesis
b. Reject the null hypothesis
c. Accept the other hypothesis
d. None of the above
reject the null hypothesis
Which of the following is most sensitive to extreme scores?
a. Mode
b. Median
c. Range
d. All of the above are equally sensitive to extreme scores
range
Most data sets in social science studies are from _____________.
a. Samples
b. Mentally ill people
c. Populations
d. Outliers
samples`
A sampling distribution of means is:
a. A population distribution
b. A distribution of means from many samples
c. Highly skewed
d. Always generalizable
A distribution of means from many samples
the sample mean is a(n) _________________ of the population mean.
a. Inflation-controlled estimate
b. Overestimate
c. Underestimate
d. Unbiased point estimate
unbiased point estimate
According to the Central Limit Theorem, it is safe to assume that given an infinite number of samples:
a. The shape of the distribution of sample means will approximate a normal curve if the sample size (n) used to calculate each mean is > 30.
b. The shape of the distribution of sample means will approximate a skewed distribution if the sample size (n) used to calculate each mean is > 30.
c. It is safe to assume both A and B
d. We can neither assume A nor B
The shape of the distribution of sample means will approximate a normal curve if the sample size (n) used to calculate each mean is > or = 30
In hypothesis testing, if the null hypothesis has been rejected, what hypothesis do we assume?
a. The advanced hypothesis
b. The alternative hypothesis
c. The dissimilar hypothesis
d. The modern hypothesis
the alternative hypothesis
In null hypothesis testing, if the critical value is less extreme than the observed value (i.e., test value), then:
a. The null hypothesis is rejected
b. The null hypothesis is important
c. The null hypothesis is true
d. The null hypothesis is retained (i.e., not rejected)
null hypothesis is rejected
Which of the following is always true for "statistically significant" results?
a. The results are important
b. The p-value is higher than alpha
c. The null hypothesis is not rejected (i.e., retained)
d. None of the above
none of the above
Which of the following statements below is inappropriate when discussing results of
statistical significance tests?
a. The null hypothesis has been proven true
b. That the null hypothesis has been rejected
c. That the null hypothesis has been retained (i.e., not rejected)
d. All of the above are appropriate statements for reporting null hypothesis results
null hypthothesis has been proven true
What would be the advantage of increasing n in null hypothesis significance testing?
a. Cohen's d will be greater
b. It would make conducting a one-tailed test easier
c. The null hypothesis would be more likely to be rejected
d. The range of scores would be easier to manage
null hypothesis is more likely to be rejected
p-values are:
a. Influenced by sample size
b. Usually the same value as effect sizes
c. Always greater than 1
d. The same as alpha values
Influenced by sample size
Which of the following is an impossible value for both p and alpha?
a. .05
b. .01
c. .50
d. .00
.00
use alpha as the criteria or critical value for the maximum probability of incorrectly rejecting the null hypothesis, then when the p-value is less than alpha:
a. The null hypothesis is retained (not rejected)
b. The null hypothesis is true
c. The null hypothesis is rejected
d. The data set was incorrectly interpreted
null hypothesis is rejected
A researcher conducts two studies on relational satisfaction with the same independent and dependent variables. After conducting a two-sample t-test, Study A was found to have an effect size of .65 and a p-value of .0001. Study B was found to have an effect size of .65 and a p-value of .076. Which study has the smaller sample size?
a. Study A
b. Study B
c. The samples were the same size
d. You cannot infer sample size from the information given
study B
A researcher conducts two studies on depression severity with the same independent and dependent variables. Study A had a sample size of 500 and the p-value was calculated at .002. Study B also had a sample size of 500 and the p-value was calculated at .033. Which study had the smaller effect size?
a. Study A
b. Study B
c. The effect sizes were the same
d. You cannot infer the effect size from the information given
study B
The effect size is calculated as d = .89. What does this mean?
a. 89% of predictions will be incorrect
b. .89% of the sample have a lower score than the population
c. The sample mean is .89 standard deviations away from the population mean
d. The null hypothesis is retained
The sample mean is .89 standard deviations away from the population mean
If Cohen's d = 2.25, then which of the following is always true?
a. The population and sample mean are very similar
b. There are 2.25 standard deviations between the two sample means c. That the test was statistically significant
d. That the sample sizes were very large
There are 2.25 standard deviations between the population and sample means
If Cohen's d is very small, the two means are ______________ each other
a. Far apart
b. Causing
c. Close to
d. None of the above
close to
Committing a Type II error is defined as:
a. Including too many individuals in a sample
b. Not rejecting (i.e., Retaining) the null hypothesis when it should have been rejected
c. Setting the rejection region too low
d. Rejecting the null hypothesis when it should have been retained (i.e., not rejected)
Not rejecting (i.e., Retaining) the null hypothesis when it should have been rejected
After a researcher rejects the null hypothesis, she needs to be aware of
a. Type I error
b. Type II error
c. Neither Type I nor Type II error
d. Both Type I and Type II error
type I error
A two-sample t-test is conducted:
a. When the independent and dependent variables are nominal/ordinal data
b. When three or more samples are being compared
c. When the population mean and sample mean are known
d. When two sample means are being compared
When two sample means are being compared
In a two-sample t-test, we establish our critical value as +1.96. Our observed value (test value) was calculated as +2.10. This always means:
a. The test results supports what the researcher wants to prove
b. p-values are high
c. The null hypothesis is retained
d. The null hypothesis is rejected
null hypothesis is rejected
A chi-squared test is conducted:
a. When the independent and dependent variables are nominal/ordinal data
b. When three or more samples are being compared
c. When the population mean and sample mean are known
d. When two sample means are being compared
When the independent and dependent variables are nominal/ordinal data
If we use alpha as the criteria or critical value for the maximum probability of incorrectly rejecting the null hypothesis, then in an ANOVA test where alpha = .01 and the calculated pvalue = .20, we should:
a. Retain the null hypothesis
b. Retest the data set
c. Reject the null hypothesis
d. Choose a different alpha
retain the null hypothesis
Which of the following null hypothesis statistical tests require calculating degrees of freedom?
a. Chi-squared
b. Two-sample t-test
c. One-sample t-test
d. All of the above
all of the above
In a two-sample t-test, what is the grouping variable?
a. The dependent variable
b. The predicted mean
c. The independent variable
d. The baseline for the null hypothesis
the independent variable
Which of the following situations is appropriate for using a chi-squared test?
a. To compare average heights of males and females
b. To examine the relationship between major and graduation status at UVU
c. To compare mean UVU sample IQ scores with the known population mean IQ score
d. To examine the relationship between height and weight
To examine the relationship between major and graduation status at UVU
Pooled variance is calculated for which test?
a. z-tests
b. ANOVA
c. Chi-squared
d. Two-sample t-tests
Two-sample t-tests
A post-hoc test is required when the null hypothesis has been rejected for which statistical test?
a. Chi-squared
b. ANOVA
c. z-test
d. Two-sample t-test
ANOVA
The null hypothesis for an ANOVA is
a. All group means are statistically equal.
b. The correlation between X and Y is zero.
c. X and Y are independent of one another.
d. None of the above.
All group means are statistically equal.
The difference between a predicted Y score and an actual observed Y score is known as the
a. Imperfection coefficient
b. Error ratio
c. Residual
d. All of the above
residual
Which of the following is true about regression towards the mean?
a. Predicted Y values will not always be perfect unless r = ± 1
b. Predicted Y values tend to be farther from the mean of Y than the observed values of X are to the mean of X
c. Predicted Y values will have more variation than actual observed values of Y
d. All of the above
Predicted Y values will not always be perfect unless r = + 1
Which of the following is an impossible value for r2?
a. .00
b. .16
c. .36
d. 1.10
1.10
Correlations may not be interpretable for which type of relationship?
a. Direct
b. Inverse
c. Nonlinear
d. All of the above
nonlinear
Which of the following illustrates a negative correlation?
a. The more often a person exercises, the more muscle mass they will accumulate
b. The more often a person visits the dentist, the fewer cavities they have
c. As a person writes less, the quality of their writing decreases
d. The less often a person gets sick, the less sick days they would need to take off work
The more often a person visits the dentist, the fewer cavities they have
A researcher calculating a Pearson's r found that there was no relationship between X and Y. The effect size for the data is
a. -1.0
b. -.5
c. 0
d. .20
0
When Pearson's r is negative, variables are said to have an "inverse relationship." What does this mean?
a. That X and Y increase or decrease together
b. That X and Y are not correlated
c. That X and Y are outside the appropriate range
d. That when X increases, Y decreases
That when X increases, Y decreases
The closer Pearson's r correlations are to -1 or 1, the ___________ the relationship between X and Y is.
a. Stronger
b. Weaker
c. More insignificant
d. Truer
stronger
A data set has a non-linear relationship between two variables. Which of the calculations below are affected by this problem?
a. Means
b. Standard deviations
c. Variances
d. Pearson's r
pearson's r
Which statistic is defined as the proportion of variance accounted in the dependent variable by the independent variable?
a. Chi-squared
b. r2
c. Range
d. Mode
r2
What is the minimum level of measurement to calculate a Pearson's r correlation coefficient?
a. Interval
b. Nominal
c. Ordinal
d. Ratio
interval
If r = .65, then the members in a sample who have __________ values on the independent variable have ____________ values on the dependent variable
a. Lower, lower
b. Higher, lower
c. Lower, higher
d. No relationship
lower, lower
For the five data points in the scatterplot below, the correlation is r = .95, as shown with the regression line. Why is Pearson's r a problematic statistic to summarize the relationship for these
data?
a. The data do not consist of pairs of scores on two variables.
b. The scatterplot implies that X causes Y.
c. The Pearson's r value is mathematically impossible.
d. The outlier distorts the relationship between X and Y
The outlier has distorts the relationship between X and Y