STATS 1
 Call Kai
 Learn
Learn Practice Test
 Spaced Repetition
 Match
Match Flashcards
 Knowt Play
1/27

Earn XP
Description and Tags
JCU Summer session 1 with Dr.Robert
Name | Mastery | Learn | Test | Matching | Spaced | Call with Kai |
|---|
No analytics yet
Send a link to your students to track their progress
28 Terms
Define Statistics
the art and science of collecting, presenting, analyzing and interpreting data
data→____→____
data→statistics→information
Define Data
facts and figures
ex) can be numbers, can also be words
Define Data Set
all data collected in a study
Define Elements
entities on which data are collected
also called unit/subject
ex) person, country, car, day
Define Variable
characteristics of interest for the elements
ex) ppl are elements. Hair color is the variables
Define Observation
set of measurements obtained for each element
No observations always= No elements
this means there is a 1-1 relationship between elements and observations
What are the 4 scales of elements
Nominal Scale
Ordinal Scale
Interval Scale
Ratio Scale
Define Nominal Scale
objects, adjectives, numbers
Define Ordinal Scale
nominal data with meaningful order or rank
ex) excellent, good, poor; 1st, 2nd, 3rd
Define Interval Scale
ordinal data; fixed interval between values
always numeric
differences between scores are meaningful
no meaning zero
ex) 10o, 20o, 30o. 25/05, 27/05, 29/05.v
it’s not twice as hot, or twice as many days. It’s just 10 degrees hotter, or 2 days later
Define Ratio Scale
interval data with meaningful ratios
Time, distance→ ex) speed
Height, weight→ BMI
*Must have a ZERO value*→ nothing exists for variable at zero
ex) 10 years, 20 years, 30 years, 0 years
you can double values, and have a zero value
Which one has a zero value? Interval Scale or Ratio Scale
Ratio Scale
Pick whether it is categorical or quantitative for the following scales of measurements
Nominal Scale
Ordinal Scale
Interval Scale
Ratio Scale
Nominal Scale is categorical
Ordinal Scale is categorical
Interval Scale is quantitative
Ratio Scale is quantitative
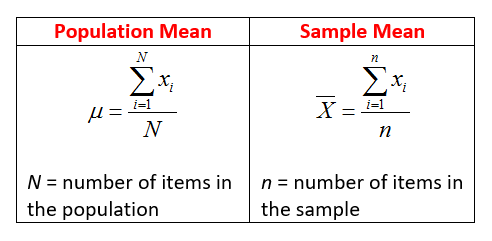
Mean
(average)
sum of all results divided by number of results
The mean had information from all of your data set
Median
the result in the middle
(n+1)/2 if it’s a even data set
Mode
the result that occurs most frequently (can be less than or equal to 1)
the tallest bar in a frequency distribution
can have more than 1 answer
Percentiles equation
i=(p/100)n
if i is not an integer: round UP
if i is an integer: average of the values in positions i and i+1
and then divided it all by 2 like you would when finding median in an even data set
Quartiles
divided into 4 equal parts
division points are referred to as quartiles
Q1 first quartile (25th percentile)
Q2 second quartile (50th percentile)
Q3 third quartile (75th percentile)
What are the measures of variability?
range
interquartile range
Range is
the largest value-smallest value
influenced by extreme values
Interquartile Range (IQR)
overcomes extreme values
difference between Q3 and Q1
range for the middle 50% of data
IQR=Q3-Q1
What are measures of spread?
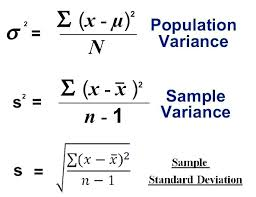
Variance
Standard deviation
Variance equation
Sum of deviations are always equal to ___
zero
the Deviation from mean is
the distance from the a specific data point to the mean
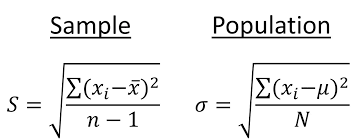
Standard Deviation
the square root of the variance
Coefficient of variation (%) equation=
standard deviation/mean times 100