Research methods 2
1/49
There's no tags or description
Looks like no tags are added yet.
Name | Mastery | Learn | Test | Matching | Spaced | Call with Kai |
|---|
No analytics yet
Send a link to your students to track their progress
50 Terms
What is the baseline significance level in psychology research and why?
0.05- balance between making a type 1 and type 2 error
What does a higher range indicate?
Less consistency
What does p ≤ 0.05 mean?
Probability that the results are due to chance is less than or equal to 5
What are stringent levels?
Highly significant e.g. p ≤ 0.01
If we need to be more confident than accepting a 5% probability that the results are due to chance
What are non-stringent levels?
When are they used?
Low significance e.g. p ≤ 0.1
If we need to demonstrate an effect/difference/relationship
What is a type 1 error?
False positive
Wrongly accepting experimental, when null should be accepted
Happens with lenient significance levels
What is a type 2 error?
How to reduce it happening?
False negative
Wrongly accepting null, experimental should be accepted
Happens with stringent significant levels
2) use 5% level, use less stringent levels or increase sample size
What to do if it is unclear whether data is ordinal or interval?
Regard as ordinal
How to tell whether the result is significant based off critical and calculated values?
If there is an R in the test, critical has to be higher than calculated for the result to be significant
What is the critical value and what is the calculated value?
Critical- value from statistical test table (have to find from table)
Calculated- value produced after statistical test done (have to work out)
How to calculate the calculated value in sign test?
Sign that occurs less frequently
How to calculate df for chi squared?
(no. of rows-1) x (no. of columns-1)
What is content analysis?
What is the purpose of content analysis?
A technique for analysing data according to themes
Make analysis more objective and identify trends
How to carry out content analysis?
1) Researchers come up with aim/hypothesis to investigate
2) Select sample
3) Create coding units
4) Carefully go thru sample + record any instances of the coding unit that occurs
5) Produces quantitative data
Strengths of content analysis? (3)
No ethical issues- no consent needed as content is published
Flexible method- used to suit any aim
Statistical analysis is possible- identify patterns in data- easier to compare findings from similar studies- acts as reliability check- scientific technique
Weaknesses of content analysis?
Reductionist- detailed, in depth sample reduced to numbers- subtle message in commentary is lost and loses its richness and complexity as it is taken out of context
Subjective- categorising and coding is biased as it is based on what the researchers believe is important- not valid or trustworthy
Key features of thematic analysis?
Coding + identifying patterns and themes
Specific e.g. quotes to support or challenge themes
Original qualitative form
How to carry out thematic analysis?
1) Familiarise with data + transcribe
2) Coding to initially analyse transcript
3) Look for emerging themes
4) Define and name each separate themes
5) Write up report
Strength of thematic analysis?
Less reductionist than content analysis- data still in depth + contains original message
Weaknesses of thematic analysis?
No statistical comparison- reliability harder to establish
More subjective- bias from the researchers gender, culture, background are highly likely when interpretations are made
How to define interval data?
The units are of fixed intervals/differences between the scores are fixed
Why are correlations a useful preliminary tool for further research?
Relatively quick + economical to conduct- uses forms of established (secondary) data to assess patterns of variables before researcher commits to more lengthy and time consuming research methods
Forms basis of starting point for further experimental research
Why do correlations allow studies of variables which can’t be manipulated in experiments?
Don’t require manipulation of behaviour and are used when it may be unethical/impractical to manipulate variables artificially in experiments
Doesn’t break ethical guidelines
Weakness of correlations?
Variables aren’t being manipulated so we can’t state whether one variable has caused the effect on the other variable as there could be other extraneous variables that are having an effect
Can’t establish cause and effect
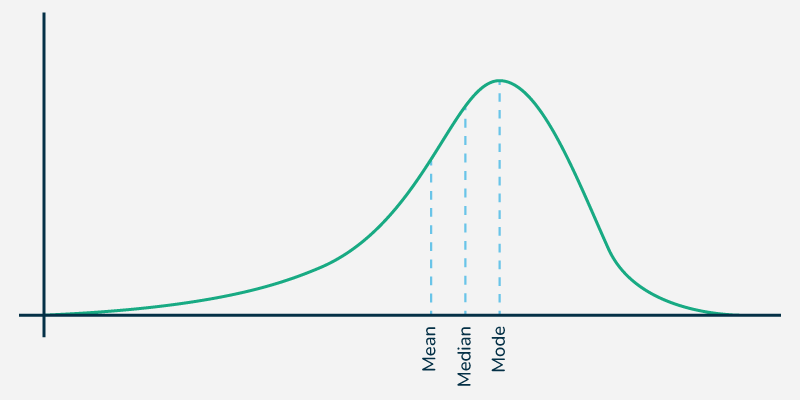
What does a negative skew look like and what does it mean?
Long tail end at left side (negative = left)
Mean at left side of median and mode
Large amount of data about mean score i.e very easy test so very high scores
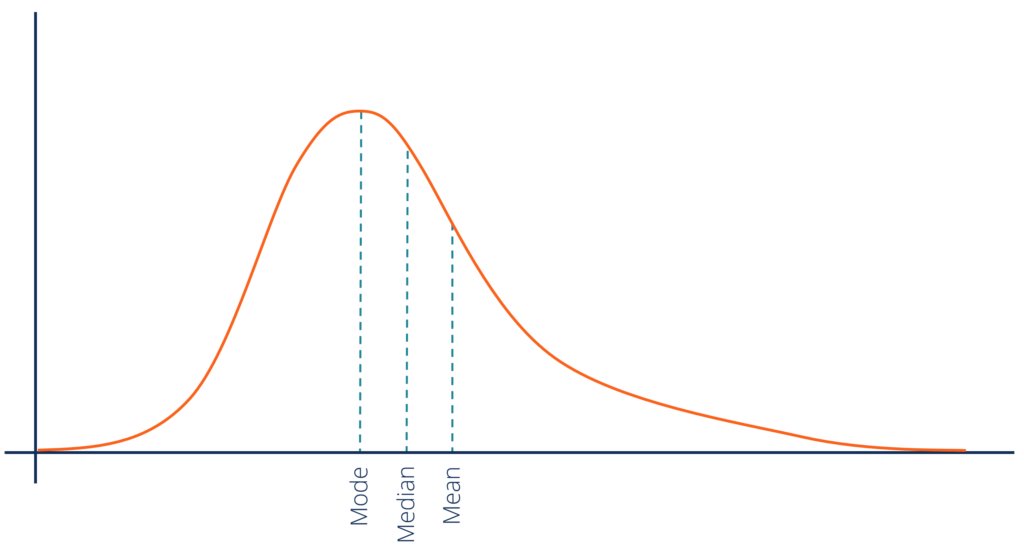
What does a positive skew look like and what does it mean?
Long tail end at right side (positive = right)
Mean at right side of median and mode
Large amount of data below mean score i.e. very hard test so very low scores
When are bar charts used?
With discreet categorical data e.g. hair colour
When are histograms used?
Used to illustrate distribution/frequency of data items
With continuous data e.g. weight
When are scattergrams used?
To show a relationship between 2 variables i.e. correlations
Strength and weakness of mean?
Strength- most sensitive measure of CT- - includes all values in data set- most representative
Weakness- easily distorted by extreme values- could be unrepresentative
Strength and weakness of median?
Strength- not affected by outliers- useful when mean isn’t appropriate + easier to calculate
Weakness- not as sensitive as mean- doesn’t include all data values
Strength and weakness of mode?
Strength- easiest measure to calculate + unaffected by outliers
Weakness- crude measure- unrepresentative in small data sets- less useful when several modes
Strength and weakness of range?
Strength- easiest measure of dispersion
Weakness- only takes two most extreme values into account- unrepresentative
Strength and weakness of SD
Strength- sensitive and precise measure of dispersion- all values taken into account for calculation
Weakness- doesn’t say full range of data + can be affected by outliers
What does a large SD indicate?
A large variation from the mean- values are spread out around mean score
Data points out over wider range of scores
What does a small SD indicate?
Not a lot of variation from the mean- values are clustered together around the mean
Data points close to mean of the set
What is primary data?
Data which is collected by the researcher first hand and is gathered directly from the p’s themselves for the purposes of the research and to test the hypothesis put forward by the researcher
Strength of primary data?
Authentic- collected first hand from the p’s themselves- specifically targeted to meet the researcher’s needs + focused on purpose of research
Weakness of primary data?
Time consuming to collect- investigations require planning and preparation
What is secondary data?
Data which has been collected from p’s by other ppl (not the researcher themselves) and already exists
Researcher makes use of this data for their own research purposes and to test their hypothesis
Strength of secondary data?
Easily accessible- requires minimal effort to collect as it already exists
Weakness of secondary data?
Content may not meet the researcher’s needs and it could be lacking in valuable info. or be outdated
What is a meta analysis?
Researcher combines findings from a number of previously published studies, all dealing with the same research question, and provides a statistic to represent an average and the common overall effect
Strength of meta analysis?
Greater statistical power- more ability to generalise findings to wider population
Evidence based
Weakness of meta analysis?
Difficult + time consuming in searching for appropriate studies to examine
Complex statistical skills and techniques required
Strength of quantitative data?
Objective- free from bias
Capable of being analysed statistically- allowing comparisons to be made
Weakness of quantitative data?
Fails to consider participant emotion or feeling
Lacks insight into reasons behind human behaviour
Strength of qualitative data?
Allows respondents to develop thoughts, feelings and emotions
Gives meaningful insight- high in external validity
Weakness of qualitative data?
Difficult to analyse statistically- comparisons difficult to make
Conclusions based on subjective interpretations
How use of inferential stats would improve investigation
allow the researcher to establish whether the relationship is significant/due to chance
allows the (alternative) hypothesis to be accepted/null to be rejected
can more accurately show the strength of the relationship
to increase the scientific credibility/validity/objectivity of the research.