Learning Objectives EXAM 3 Ecology
1/63
There's no tags or description
Looks like no tags are added yet.
Name | Mastery | Learn | Test | Matching | Spaced | Call with Kai |
|---|
No analytics yet
Send a link to your students to track their progress
64 Terms
Describe common life-history trade-offs. Draw graphs showing some of these trade-offs.
Fecundity (# of gametes, seeds, etc.)
Gene Flow (movement of alleles from one population to another)
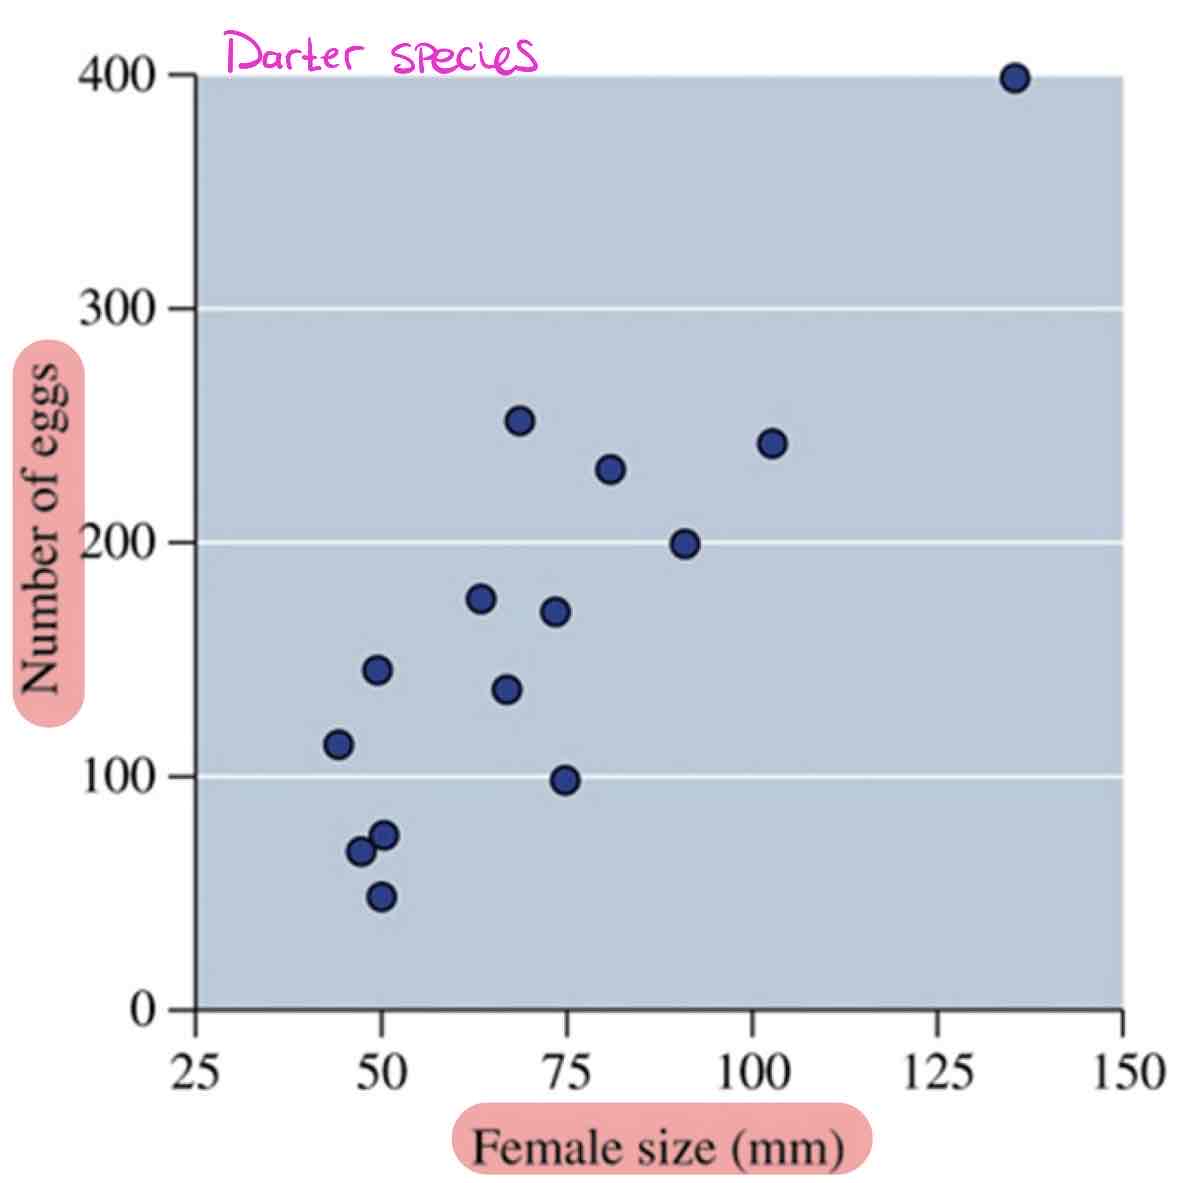
Species with HIGH fecundity tend to lay small eggs. > The darter species that lay small and many eggs are the species with high gene flow.
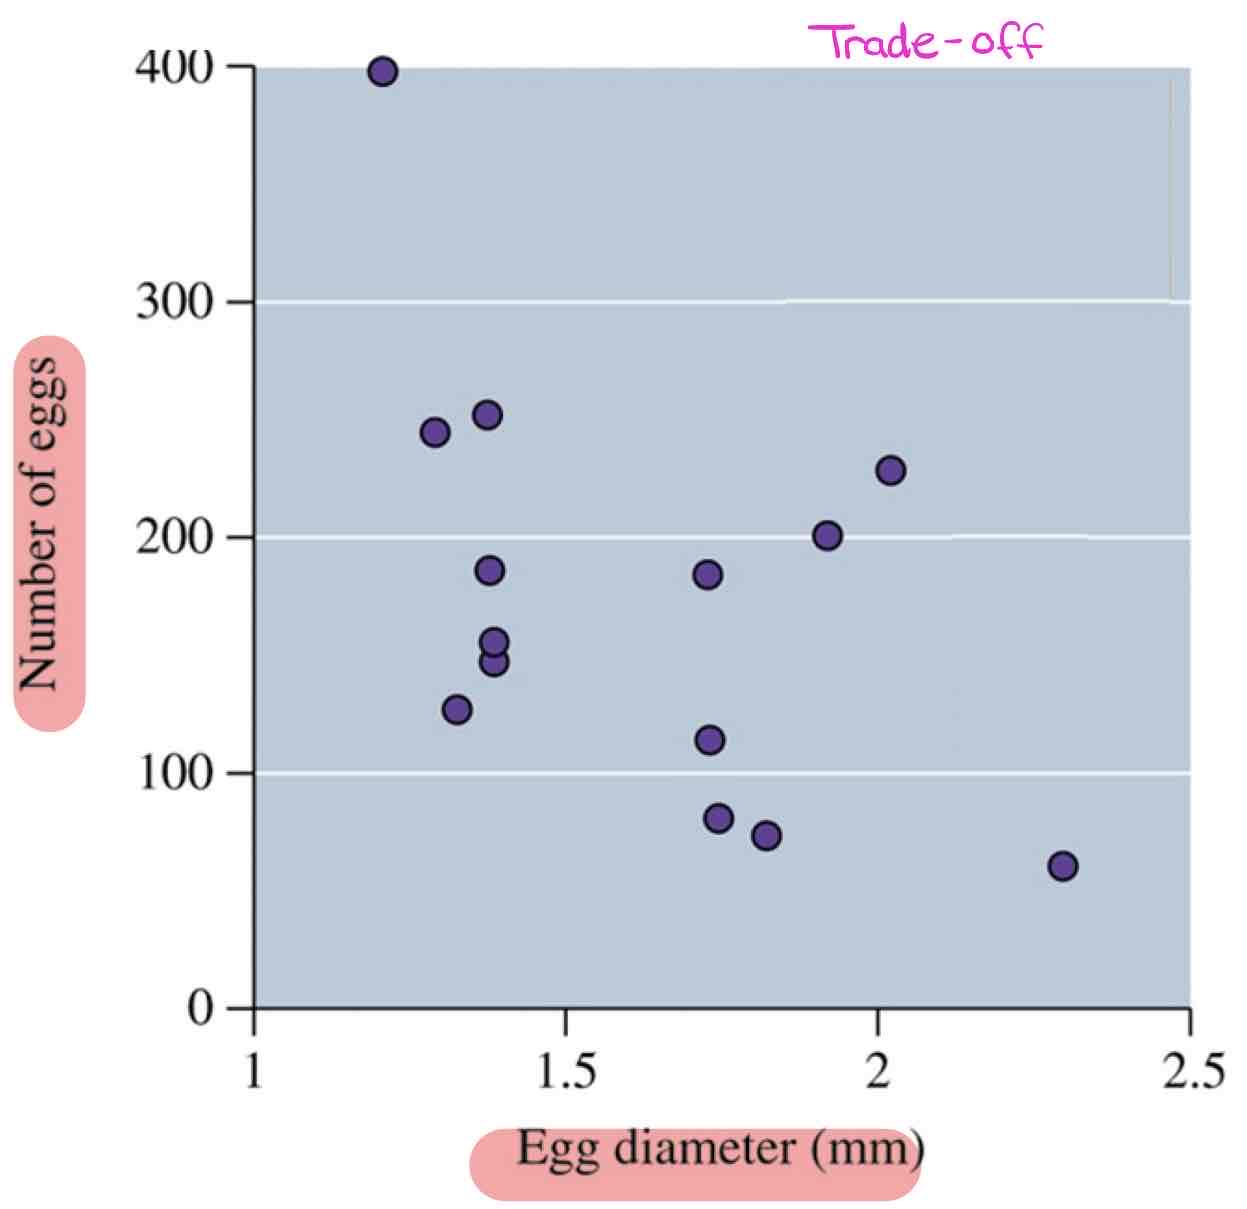
TRADE-OFF: can lay many eggs or large eggs, but not many large eggs.
Growth & Maintenance ←Trade off→ Reproduction
Many Offspring ←Trade off→ Large Offspring
Use the principle of allocation to explain why life-history trade-offs occur. For instance, explain why a plant might produce many seeds or large seeds, but not many large seeds.
PoA: Given limited access to energy, if an organism allocates resources to one function (e.g., growth, maintenance), it reduces the amount of energy available to other functions (e.g., reproduction)
AN ORGANISM CANNOT DO BOTH, ONLY ONE
Many Offspring ←Trade off→ Large Offspring
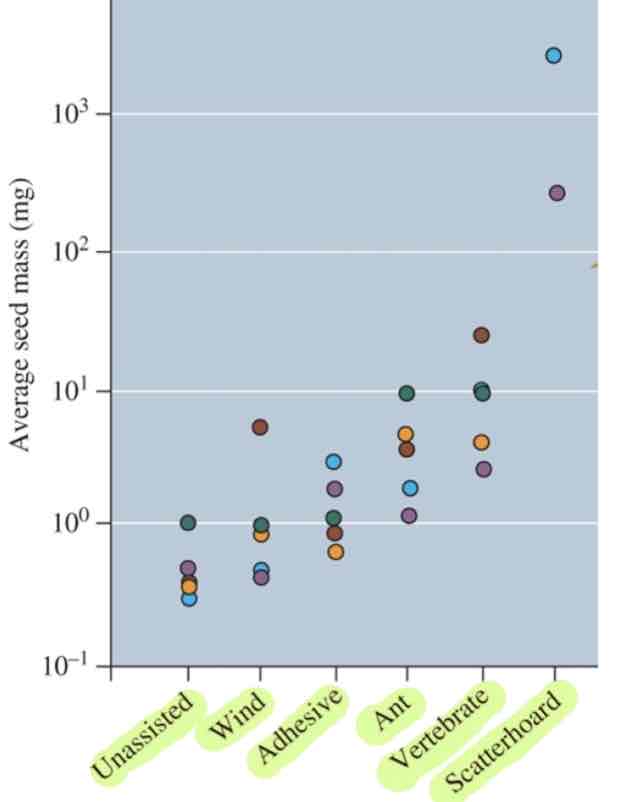
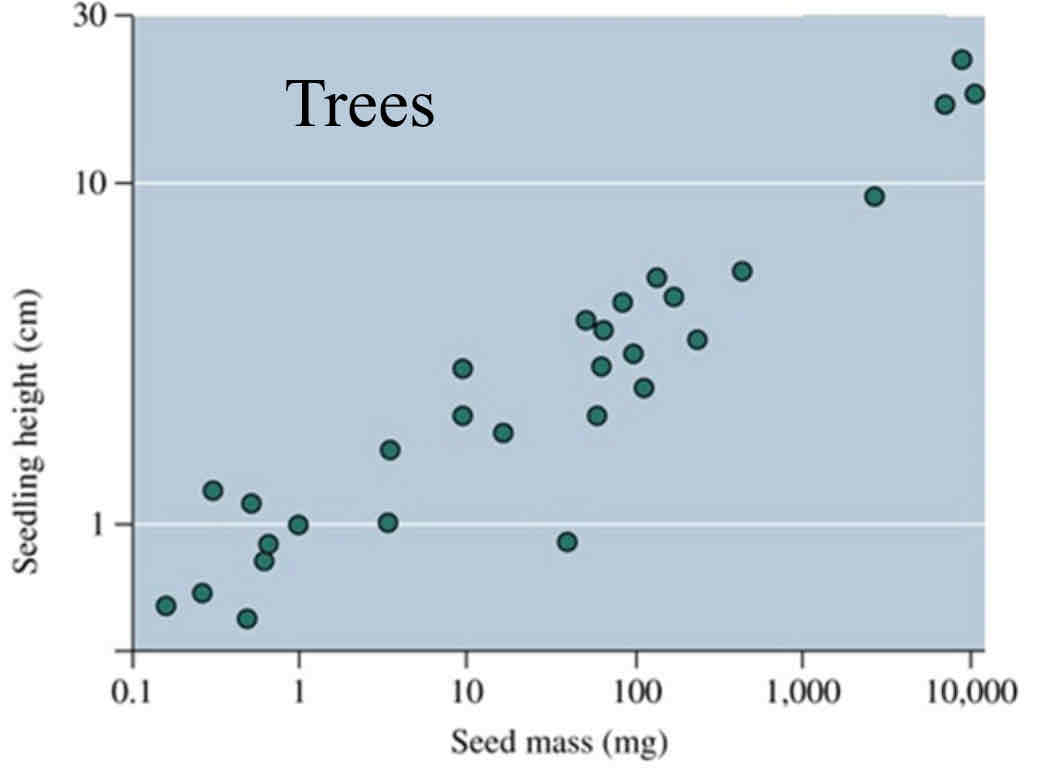
- Species producing larger seeds produced fewer seeds. Mode of seed dispersal depends on size. Seed dispersal establishes RANGE.
> Seed size dictates how far a seed is able to travel based on the MASS of the seed.
Allocating more energy per offspring (larger seed) = a parent organism will produce fewer offspring.
Identify how different life history strategies can have different ecological and evolutionary consequences, such as dispersal, gene flow, and the growth rate of young organisms.
Gene Flow: movement of genes from one population to another.
Polymorphic Locus: the site of a gene with many alleles.
Similar allele frequency among same population of species → HIGH gene flow (i.e. darter species that lay small and many eggs are the species w/ high gene flow.)
Different allele frequency among same population of other species → LOW gene flow (Larger offspring is able to avoid river drift vs smaller offspring, able to promote future genetic differentiation; larger egg species - not dispersing).

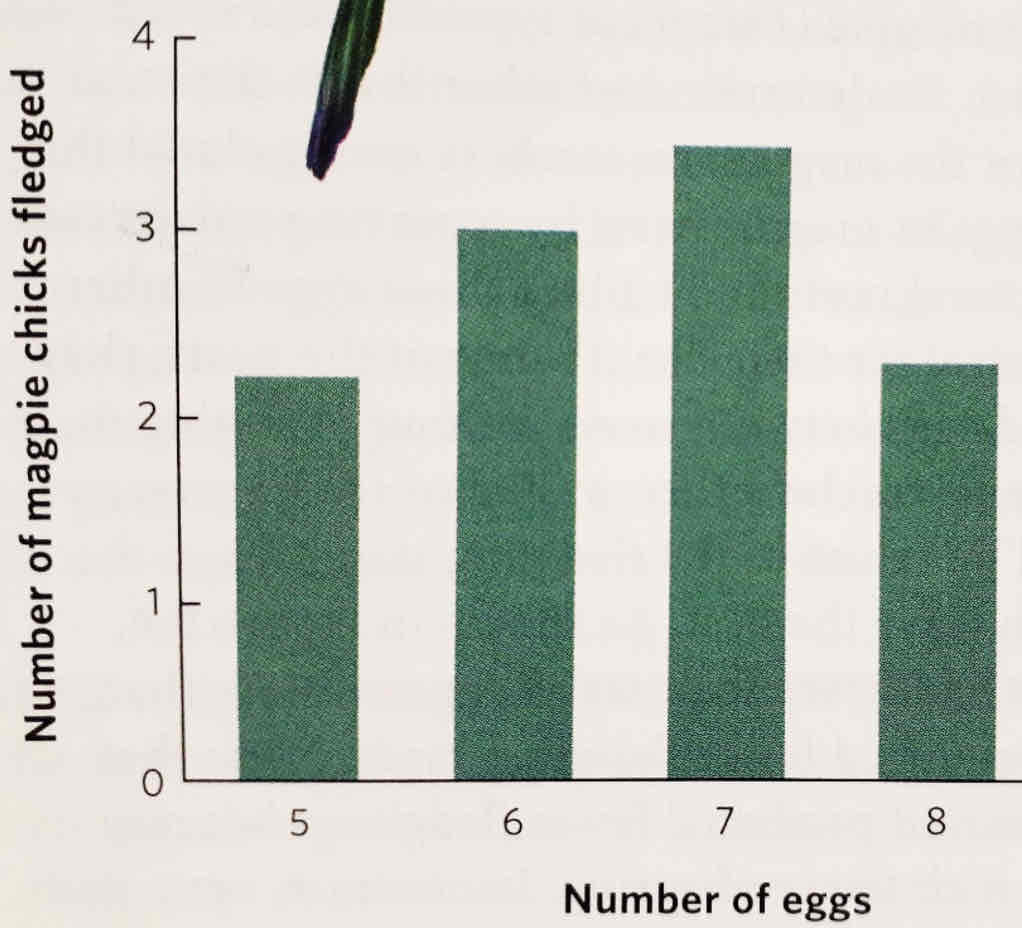
Explain why fitness is highest at intermediate clutch sizes in birds. That is, why does fitness decrease at lower or higher numbers of eggs?
Magpies tend to lay cluthes w/ 7 eggs, which results in 3-4 successfully fledged chicks (strong enough to fly).
Fewer eggs → fewer fledged chicks
More eggs → less nourished chicks → few fledglings
Clutch size is a heritable trait; if the size of 7 yields greatest fitness, and is heritable, then clutch size of 7 becomes common in the population.
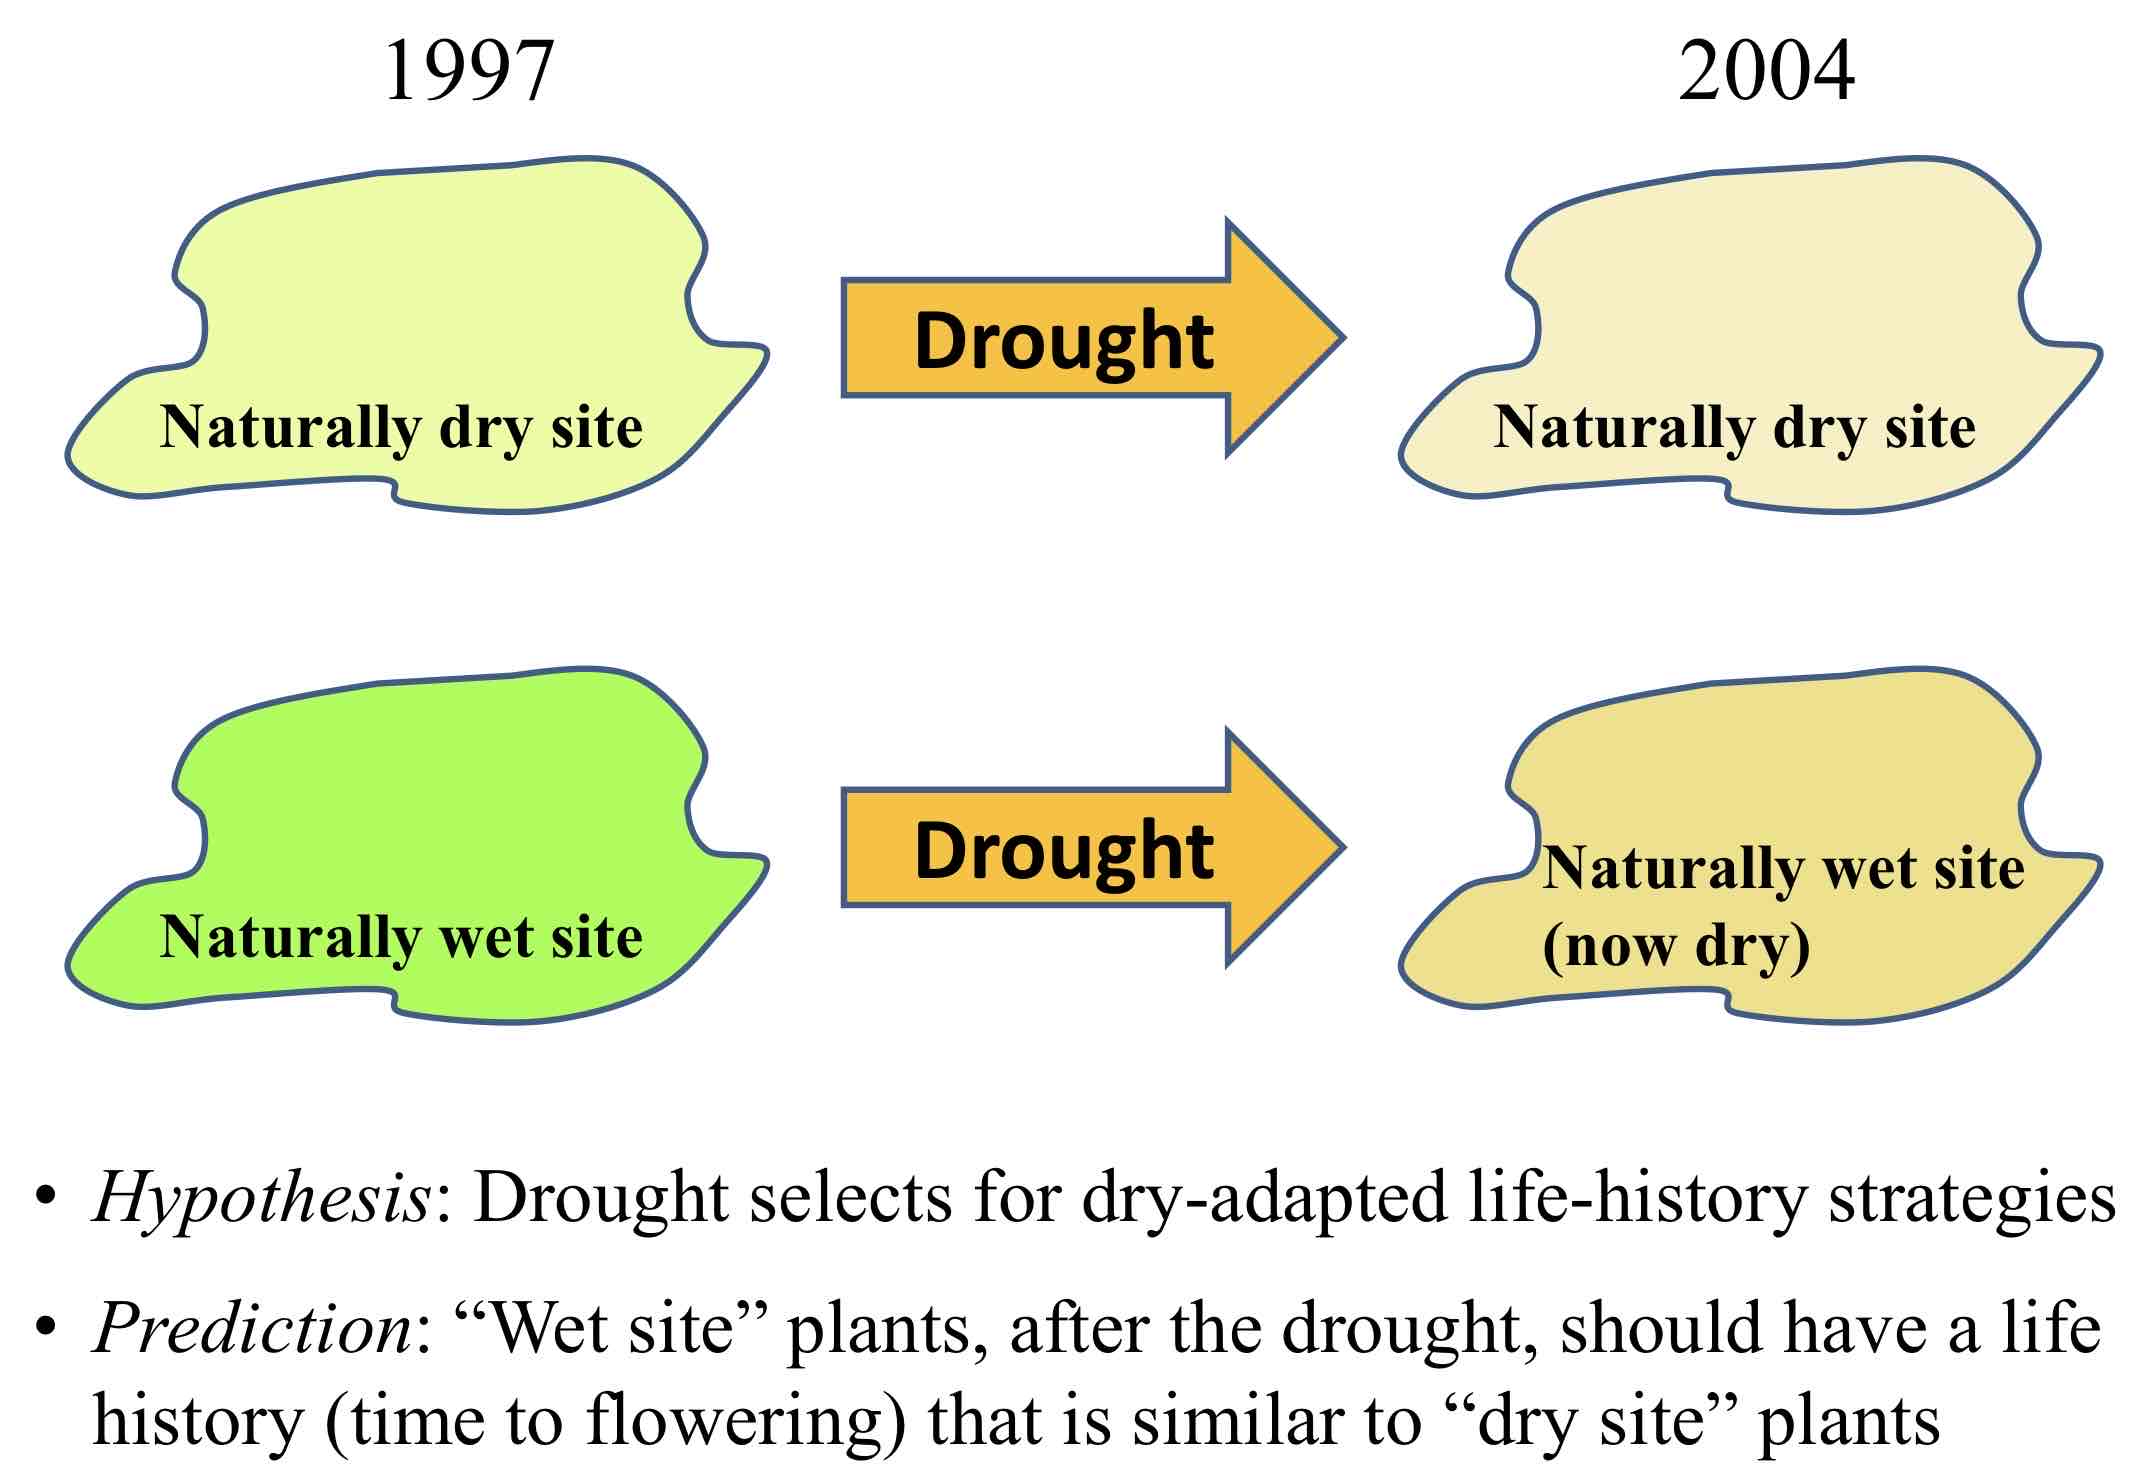
7. Describe experimental evidence that demonstrates how life history traits in mustard plants evolve in response to drought.
Environmental change → Selection for adaptive life histories
[Dry site population, 41 day flowering]
[Wet site population, PRE drought, 59 days flowering] some individuals in this population have a life history phenotype (ie. earlier flowering) that is suited to dry conditions.
[Wet site population, POST drought 45 day flowering] experienced drought looks more like a “dry site” population than “wet site”.
> Because the mustard plants are from the same species, the phenotype for earlier flowering was passed on due to it already growing better in dry sites, hence why post-drought they were still able to grow faster after.
PREDICTION: “Wet site” plants, after the drought, should have a life history (time of flowering) that is similar to “dry site” plants.
![<p>Environmental change → Selection for adaptive life histories</p><p>[Dry site population, 41 day flowering] </p><p>[Wet site population, <strong>PRE</strong> drought, 59 days flowering] <u>some individuals in this population have a life history phenotype (ie. earlier flowering) that is suited to dry conditions.</u></p><p>[Wet site population, <strong>POST</strong> drought 45 day flowering] experienced drought looks more like a “dry site” population than “wet site”.</p><p>> Because the mustard plants are from the same species, the phenotype for earlier flowering was passed on due to it already growing better in dry sites, hence why post-drought they were still able to grow faster after.</p><p>PREDICTION: “Wet site” plants, after the drought, should have a life history (time of flowering) that is similar to “dry site” plants. </p><p></p>](https://knowt-user-attachments.s3.amazonaws.com/76860725-f548-4047-ba08-c56cda0704ce.jpeg)
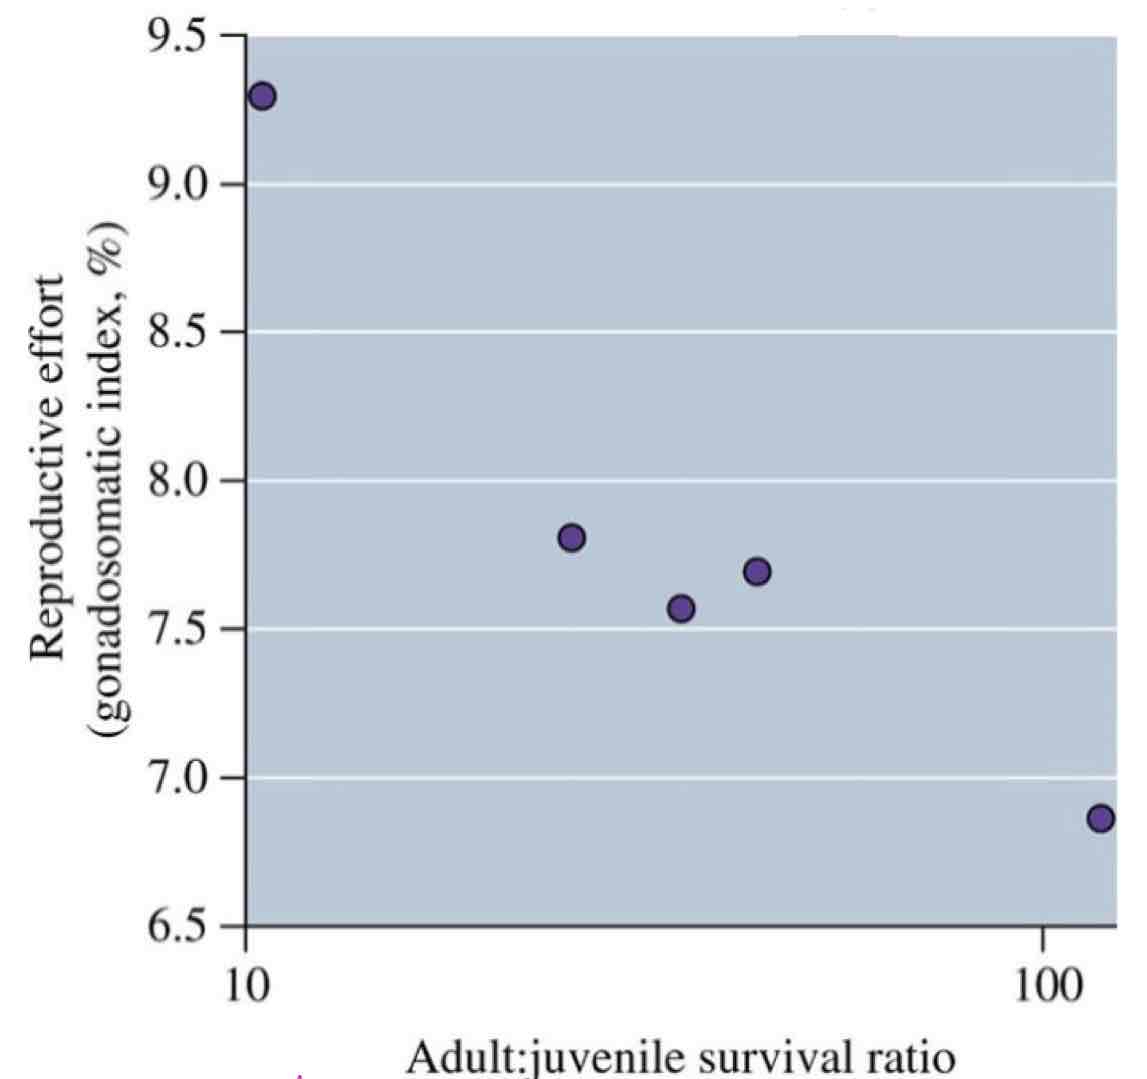
8. Consider life history strategies in which adult survivorship is high. Identify other life history attributes that are linked to high adult survival.
For instance, in species or populations with high adult survivorship, does maturity happen early in life or is it delayed, and what is the allocation of energy to reproduction vs. to growth?
Adult survival & age at maturity
- Species with delayed reproduction generally have higher adult survivorship; High allocation to reproduction is associated with high mortality.
(Early reproduction → Less self maintenance)
Adults survive longer if they invest less in reproduction.
> Where adult survivorship is HIGH, there is LOW investment in reproduction.
> Where adult survivorship is LOW, there is HIGH investment in reproduction.
(study done of pumpkinseed sunfish)
9. Distinguish competitive, exploitative, mutualistic, and commensal interactions according to how these interactions affect the fitness of organisms participating in them.
Competition → occurs when multiple organisms use a resource that is in scarce supply relative to demand; negative impacts on fitness is an outcome of competition
Exploitation → occurs when one organism obtains resources, nutrients, or energy by consuming all or part of another, not always lethally (+,-).
Mutualism → a relationship between two species where both benefit. Between plants and fungi, for example, it might turn into parasitism.
Commensalism → a relationship between two species where one benefits and the other is unaffected/neutral.
10. Provide a general definition for the process of competition for resources.
Explain why the decline in isopod survival at high isopod densities is not evidence for intraspecific competition.
Competition occurs when multiple organisms use (or “share”) a resource that is in scarce supply relative to demand (a limiting resource).
INTRAspecific competition: indirect and involves resource sharing.
INTERspecific competition: direct and involves active conflict
Mechanism was cannibalism between isopods. At high population densities, birth rates decline and death rates increase, resulting in no net population growth. Adding food to the high-density group of isopods actually did not increase survival
Logistical population growth is an outcome of intraspecific competition. When density is high and resources are scarce, individuals must compete with members of their own population to obtain resources.
11. If nitrogen is a limiting resource, and the organisms in a population are competing for nitrogen, describe how population density or organism size will respond to the addition of more nitrogen.
→ If the population is grown at high density, the organism size will not grow that much even with the addition of nitrogen.
→ If the population growth is grown at low density, the biomass will increase with the addition of nitrogen, but will slowly decrease as the biomass increases.
12. Identify evidence you would use to determine that intraspecific competition was occurring.
If intraspecific competition were occurring, then how would high population density affect survivorship and mortality rates, the growth of individual organisms, and reproduction or fitness?
- Intraspecific competition would decrease survivorship, individual growth, and reproduction as population density increases.
Evidence for intraspecific competition:
- 1) Self-thinning in plants = start with a high population density of seeds. Not enough resources to support the growth to adulthood for all of the seeds. Intraspecific competition for space, light, water, etc. As some plants increase in size, most will die (decrease in population density).
-2) Declining plant food quality at high herbivore density will result in poor herbivore survival and poor performance/growth at high density.
13. If intraspecific competition is occurring, explain how and why population growth rate changes as population density increases
(hint: use logistic growth to describe the consequences of intraspecific competition on population growth rate, that is, the effect of high N on dN/dt).
If we are starting with a brand new species that just got established in one location, we should see an exponential increase as resources are abundant. However, everything has a carrying capacity, where competition for resources will start to occur. Members of the same species will now compete for food, space, water, mates, habitat, etc. This means the more fit member will be able to successfully reproduce. This will cause the graph to appear logarithmic since the location can only support a certain number of individuals.
● Birth rates decline, death rates increase at high population density
● Changing rates result from reduced resource abundance at high density
● When density is high and resources are scarce, individuals must compete with
members of their own population to obtain resources
● Logistic population growth is a reflection or outcome of intraspecific competition
14. Describe the process of self-thinning in plant populations, and explain why it occurs.
Self thinning occurs when there are not enough resources to support all of these individuals growing into adulthood.
- There is intense competition for space, light, water, and nutrients among individuals growing close to each other.
- As plants increase in size, most die, so they decrease in numbers. Self thinning.
15. Distinguish intraspecific competition from interspecific competition.
INTRAspecific competition: indirect and involves resource sharing.
INTERspecific competition: direct and involves active conflict
16. Show how the logistic growth equation is modified to account for interspecific competition.
Explain how the "–α 21N1" term affects the population density (N2) at which population growth (dN2/dt) reaches zero.
Can N2 reach K2 before population growth reaches zero?
Population density cant get as high as K.
"–α 21N1" is a perimeter that indicates the intensity of the competition.
17. State the propositions of the competitive exclusion principle.
Competitive Exclusion Principle
- Two species with identical niches cannot coexist indefinitely. (A shared resource will eventually become depleted to a level that is too low for the less efficient species to persist)
- Species that do coexist must have different niches, corresponding with different adaptive traits. (must coexist by using different resources will have different adaptations.)
18. Use the competitive exclusion principle to explain why resource partitioning is necessary for the coexistence of different species.
Trait variation permits resource partitioning.
Resource partitioning is when species use different resources typically within their realized niches for better fitness when exposed to competition.
By using different resources (resource partitioning), the species don’t have the same feeding niches, and they co-exist.
E.g. Finchs and beak size.Each species specializes on eating seeds of a different size. Galapogos finch species eating larger seeds have larger beaks.
19. Illustrate evidence from Galápagos finches and from parasitoids (flies and wasps) showing that trait differences among species permits resource partitioning and therefore coexistence.
Competition consists of a limited supply of resources, which should reduce fitness. Selection should favor traits that help individuals access resources that are not heavily exploited, thus leading to less competition.
FINCHES: the use of different food sources among coexisting Galapagos finches correspond with difference in beak properties.
FLIES & WASPS: Wasps developed on smaller caterpillars, flies developed on larger caterpillars.
20. Define character displacement in terms of
(a.) what evolutionary process causes it, and
(b.) how it affects trait variation (phenotypes), resource partitioning, and the intensity of competition.
Character Displacement: an evolutionary shift in a populations traits to reduce niche overlap and competition; an evolutionary change that occurs when two similar species inhabit the same environment.
Under such conditions, natural selection favors a divergence in the characters, morphology, ecology, behavior, or physiology of the organisms.
a) Species that coexist in the same niche causes character displacement. In order to live in the same niche, they must use different resources to survive.
b) Character displacement causes phenotypes in a population to become different. Their phenotypes will vary so that they can use different resources (such as the Galapagos finches and their beak sizes). Reflects selection for traits that reduce competition (ie. traits that permit resource partitioning), because less competition → greater fitness.
If two species with identical niches cannot co-exist, then will one species lead to the local extinction (extirpation) of other species with similar niches?
21. Examine frequency distributions of beak size in allopatric and sympatric populations of Geospiza species in the Galápagos Islands.
Identify evidence from those data that indicate that competition for food drives character displacement of beak sizes.
When populations of the two species occur apart (when they are allopatric), they have similar beak sizes, with some degree of overlap in size.
When populations of two different species live in the same place when they are sympatric), their beak sizes diverge from one another. No geographical separation.
Reflects selection for traits that reduce competition (traits that permit resource partitioning), because less competition → greater fitness.
22. Design an experiment to determine whether the population density of one species is limited by competition with another species.
(Hint: consider experiments with the Tribolium flour beetles and the paramecium species.)
Experiments were conducted in which beetle populations were maintained for 2 years in single-species colonies under hot and wet conditions.
- each flour beetle species persisted when grown alone (in the absence of the other species). Will they persist if both species are reared together?
If either species occur together, abiotic conditions suitable for both, one species excludes the other. (bottom graph)
If a population of either beetle species is alone, it persists. (top graph)
A species that can persist well under certain conditions (within fundamental niche) can be driven to exclusion under the same conditions when forced to compete with the other species.
23. Use the results of this experiment to demonstrate that certain physical environmental conditions (e.g., temperature, humidity) might be within a population’s fundamental niche, but not within its realized niche when forced to compete with another species.
24. Design an experiment to test the hypothesis that exploitation (predation, parasitism, herbivory) can regulate the population density of an exploited (prey, host) species. You might consider examples from class, such as caddisfly grazing on algae and bacteria, bird and bat predation on herbivorous insects, and insect herbivory on purple loosestrife.
25. Many ecological phenomena occur over broad scales, and cannot be studied through direct and replicated experimental manipulation. Describe the evidence that supports the hypothesis that fox regulate hare density in Sweden. How is the "natural experiment" that affected foxes in Sweden similar to the manipulative experiment conducted with stream caddisfly larvae?
26. Is exploitation always the most important factor regulating the density of a population? Distinguish between top-down and bottom-up controls on the population density of an herbivore species.
27. Design a 2 x 2 factorial experiment to test the relative importance of top-down (predation) and bottom-up (food supply) controls on the density of an herbivore population.
28. Illustrate results from a 2 x 2 factorial experiment indicating that food supply and predation have an interactive (or non-additive) effect on the population density of an herbivore.
29. Provide examples of complex (three-species) interactions, in which the interaction between two species is affected by the presence of a third species. For instance, explain how the presence of Plagiorhynchus affects the predator-prey interaction between starlings (birds) and pillbugs, or how the presence of a parasite affects the competitive interaction between two Tribolium beetle species.
30. Identify different forms of refuge that prey organisms benefit from, and the impacts of refuges on predator and prey population dynamics.
31. In studying population dynamics, we learned that one pattern of population growth was population cycles. Provide evidence that population cycles can arise from exploitation interactions between a consumer (predator) population and its food (prey) population.
─ Create a graph where you plot predator abundance (y axis) vs. prey abundance (x axis)
─ Create a graph where you plot both predator and prey population densities vs. time
Distinguish between facultative and obligate mutualism.
33. Distinguish mutualism from commensalism.
34. Explain how the relative fitness achieved by mutualist vs. non-mutualist individuals in a population determines the evolution of mutualism in that population.
35. Identify the mutualistic partners that are central to endosymbiotic theory, and describe the roles played by endosymbionts that became organelles (mitochondria and chloroplast) within modern eukaryotic cells.
36. Identify the services to plants that are provided by plants’ many mutualistic partners. In return, identify the benefits that plants provide back to their mutualistic partners.
37. Compare and contrast nitrogen-fixing bacteria and mycorrhizal fungi in terms of
(a.) which domain of life they are in (bacteria vs. eukarya),
(b.) the resources they provide to plants,
(c.) where they get those resources from (i.e., from atmosphere vs. from soil), and
(d.) the benefits they receive from plants.
38. Describe the process of nitrogen fixation, in terms of
(i.) how nitrogen is cycled,
(ii.) the organisms performing N fixation, and
(iii.) where those N-fixing organisms get their energy from.
39. Draw graphs to describe how mycorrhizal fungi affect the water relations of their host plants (properties such as leaf water potential and transpiration rate).
40. Describe the benefits of plant diversity in polyculture milpa farms for plant mycorrhizal associations.
41. Identify soil conditions in which plants might reduce investment in mycorrhizal fungi.
42. Identify the services that Pseudomyrmex ants provide for acacia trees, and the resources that Are acacia trees provide to ants.
43. Create graphs illustrating how the growth and survival of young acacia shoots benefit from the partnership with ants.
44. Describe the relationship between coral polyp animals and zooxanthellae algae, identifying the benefits they provide to one another.
45. Describe the exchange of resources and services between coral and decapod crustaceans (e.g., crabs). Compare this exchange with the exchange of benefits between acacia trees and ants.
46. Draw lognormal frequency distributions of species abundances, showing that most species in a community are present in low to modest abundance, and few species are very abundant (remember that your x axis should be logarithmic).
47. Draw a rank abundance curve. Interpret rank abundance curves in terms of species richness and evenness.
48. Describe elements of biodiversity in terms of genetic diversity, species diversity, community diversity, and functional diversity.
49. Discuss the relationship between diversity and environmental complexity. Provide examplesof environmental complexity, including both the visually obvious forms (e.g., the complex architecture or structure of physical habitat) and the not-soobvious forms (e.g., patchiness or heterogeneity in the availability of resources such as water and nutrients).
50. Provide evidence (using examples from class) that diversity declines as soil fertility in an ecosystem increases.
51. Explain why fertilization of an ecosystem causes a reduction in the species diversity of its community. Provide an explanation based on evolutionary considerations, and an explanation based on spatial ecological considerations.
52. Draw a graphical depiction of the intermediate disturbance hypothesis (draw the “diversity vs. disturbance curve”).
53. Explain why the intermediate disturbance hypothesis predicts low diversity in environments with low levels of disturbance and in environments with high levels of disturbance, but greater diversity in environments with intermediate levels of disturbance.
54. Illustrate examples that support the intermediate disturbance hypothesis.
55. Distinguish the local “alpha” diversity of a single community from the regional “gamma” diversity of a broad region that contains numerous distinct communities.
56. Imagine two lakes with mostly the same fish species. Describe species turnover (is it high or low?) between the fish communities of these two lakes. Now imagine two lakes that have mostly different fish species from one another; describe the species turnover between the fish communities of these two lakes.
57. Recognize that insular habitats include places like islands, mountain tops, nature preserves, and lakes (that is, an insular habitat is a place surrounded by a large area that is inhospitable to that habitat's organisms).
58. Draw graphs to describe the relationship between the diversity found in an insular habitat and that habitat’s geographical properties of size and isolation. (How does diversity change as island size increases or as island isolation increases?)
59. Explain why size and isolation affect the diversity found in insular habitats. That is, how do size and isolation affect the rate at which new species colonize an insular habitat, and the rate at which already-present species go extinct?
60. Graphically illustrate the equilibrium model of island biogeography to show how rates of colonization and extinction change as the number of species in an area (e.g., an island) increases.
61. Use the graph you just drew to predict S, the equilibrium number of species (the equilibrium species richness) you expect to find in an insular habitat.
62. Define species turnover within a community between two points in time, and explain how species turnover can be high, even though diversity remains unchanged.
─ (Note: In learning objective 56, species turnover refers to differences between communities, whereas here, species turnover refers to changes over time within a community.)
63. Illustrate how experimental island manipulations (for example, removing all animals and observing recolonization, or manipulating island size), and how the formation of new islands, have been used to test biogeographical predictions about species richness.
64. Extend the predictions of island biogeography to explain the diversity of very large landmasses, such as entire continents.
65. Describe the latitudinal gradient in diversity, and extend the predictions of island biography to explain why diversity differs among biome types.
66. Identify historical and regional influences that “break the rules”, and cause patterns in diversity which do not conform to the “standard” principles (like the importance of area, isolation, and environmental heterogeneity for controlling diversity).