ATOC 3050 Final
1/110
There's no tags or description
Looks like no tags are added yet.
Name | Mastery | Learn | Test | Matching | Spaced | Call with Kai |
|---|
No analytics yet
Send a link to your students to track their progress
111 Terms
El Nino
Warm phase, ocean temps in central/eastern tropical Pacific warmer than average
La Nina
Cold phase, ocean temps in central/eastern tropical Pacific colder than average
Standard atmospheric pressure at sea level
1013.25 mb or spa
Depth of a column
Pressure decreases more rapidly with height in a cold dense column, rather than warm less dense
Hydrostatic Equation
Relationship between the change of pressure with height and density of air
Warm Column
At given height above surface, pressure in a warm column will be greater than cold column
assuming both gave same surface pressure
PGF
Force exerted on the air by presence of a pressure gradient
Pressure moves from high pressure to lower pressure
Closest spaced isobars: strong PGF and winds
Perpendicular to isobars
Horizontal pressure difference aloft
PGF is established at surface which causes air to move from the cold column to the warm
warm air advection aloft
cold air advection at surface
Constant height map
Map shows how pressure varies with horizontal location at fixed height
Constant pressure map
Map shows how the height of a constant pressure surface varies with horizontal location
if temp does not vary horizontally and SLP is same at every location, then no change in height on constant pressure and no change in pressure on constant height
related to surface pressure and temp of column
Height of constant pressure
as air warms, constant pressure surface moves up
as air cools, constant pressure surface moves down
Pressure contours on height map vs pressure map
On constant pressure map, areas of low height correspond to locations of low pressure (and vice versa)
Ridge
Region of high heights or pressure on constant pressure or height map
Trough
Region of low heights or pressure on a constant pressure or height map
Surface map
wind is CCW and inward around L
wind is CW and outward around H
Upper air map (500 mb)
Wind is parallel to height contours, with lower height to left of wind
Common pressure levels
1000 mb: provides similar info to SLP maps
500: middle of troposphere, steering level - far from surface
Common elevations
4800-9800 ft (1460-3000 m): shows lower troposphere state and temp, useful to identify fronts
30100-38700 ft (9180-11800 m): near tropopause, useful to identify jet streams
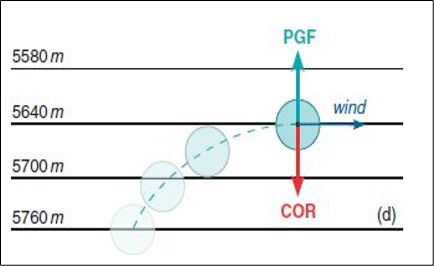
Centrifugal force
If an air parcel is turning, it experiences centripetal acceleration in direction it is turning
Coriolis deflection
Earth rotates faster at Equator than at poles
Shorter distance (x) to travel in same amount of time means slower speeds (v) closer to the poles
Coriolis force
Acts to right in NH
Acts to left in SH
Magnitude is proportional to wind speed and greater at higher latitudes and zero at equator
Only can change wind direction, not speed
Magnitude of CF
Between two lows: weak gradient, low PGF and CoF, weak wind
Between high and low: strong gradient, high PGF and CoF, strong wind
Friction Force (Turbulent Drag)
Result of turbulence transporting atmospheric momentum to the ground and acts in atmospheric boundary layer
turbulent drag slows wind and acts in direction opposite to wind
Surface vs Upper Layer winds
Upper layer: traveling in response to PGF and CoF, not influenced by surface friction
Wind Advection
Wind can transport air that has different velocity past a fixed location causing wind to change over time at that location
not really a force due to describing movement/transport process itself
Advection
Depends on:
gradient of what is being advected, larger gradients result in larger advective changes
direction of wind relative to gradient, wind blowing in direction of gradient increases advective changes
strength of wind along gradient, stronger wind increases advective changes
Geostrophic Wind
When CoF and PGF forces are equal and opposite (balanced)
travel parallel to geopotential heights
Horizontal winds: Geostrophic wind
When at rest, PGF is only force
Straight flow: no centrifugal force, no turbulent drag due to being above boundary layer
CoF will increase as wind speed increases and will turn to make it perpendicular
Geostrophic: balance between PGF and CoF (parallel isobars)
How geostrophic wind speed changes as distance between isobars changes
As PGF increases, Geostrophic speed increases
As isobars are closer: PGF increases
CoF must also increase for geostrophic balance, but can only increase as wind speed increases
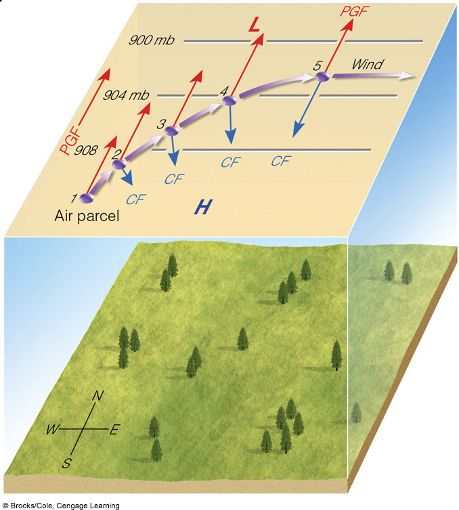
Surface vs Geostrophic Winds
Upper Level winds: Aloft with parallel isobars, winds “stay in their lane”
Surface winds (near geostrophic): “cross their lanes” due to surface friction
Gradient Wind
A wind that blows at constant speed, parallel to curved isobars or height contours above level of friction
PGF and CF not in balance
net force that results from these forces cause CCW around L, CW around H
Horizontal winds: Gradient winds
Accounts for air flow along a curved geopotential height contours
Extension of concept of geostrophic wind (move along straight and parallel isobars
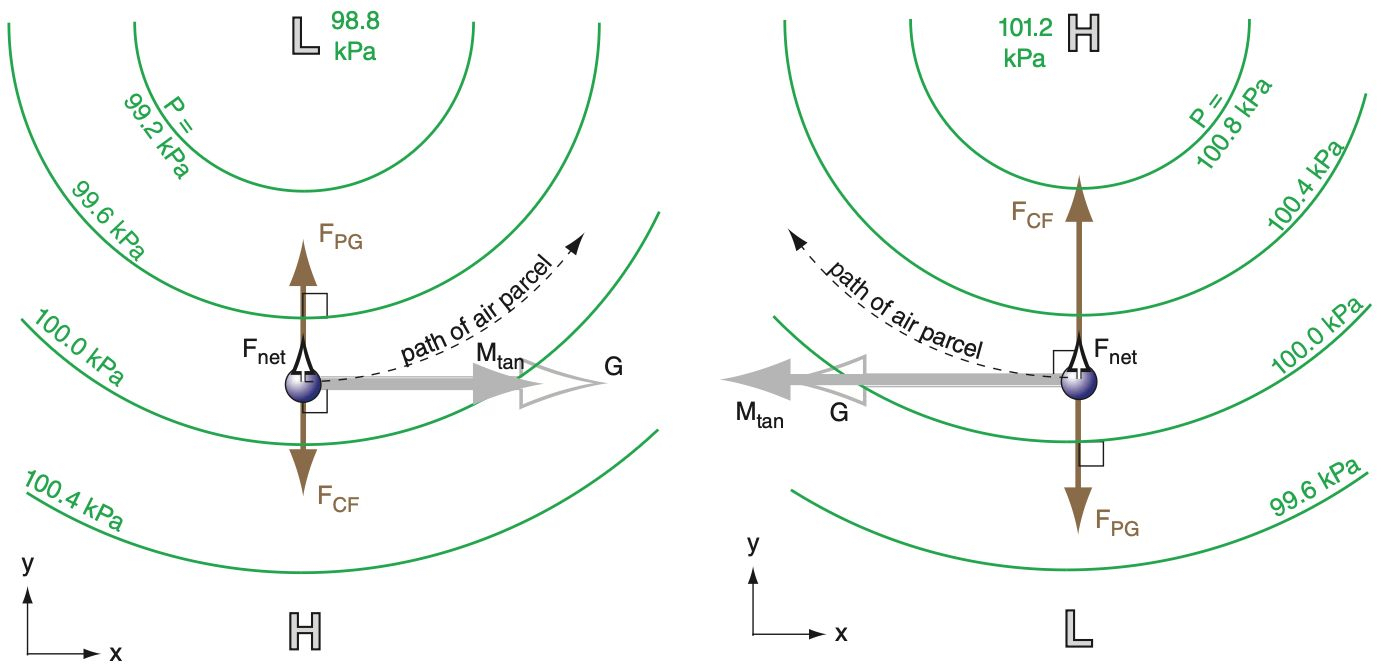
Same magnitude PGF, different pressure centers
Gradient WS around L (CCW flow) less than around H (CW flow)
Low: PGF = Coriolis + Centrifugal
High: PGF + Centrifugal = Coriolis
Gradient WS vs Geostrophic WS around a Low
PGF = Coriolis + Centrifugal
Geostrophic is PGF and CoF, while Gradient is PGF, CoF, and Centrifugal
High vs Low pressure systems and Gradient Wind
Low: PGF > CoF since centrifugal is balancing
weaker CoF than PGF means wind turns in direction of PGF
High: PGF < CoF since centrifugal is balancing the difference
stronger CoF than PGF means wind turns in direction of CoF
Winds on Upper Level Charts
In gradient wind balance where height contours are curved
Winds geostrophic where height contours are straight
Horizontal winds: Surface winds
In atmospheric boundary layers, include turbulent drag force
Turbulent drag opposes motion and slows wind speed leading to weaker CoF
PGF > CoF, winds turn in direction of PGF
Winds influenced by Friction
slower than geostrophic or gradient winds
will blow at an angle across isobars from high pressure towards low pressure
therefore winds spiral inwards L, outwards H
Vertical Forces and Motion
Forces acting on air in vertical:
PGF (from surface to upper atmosphere)
Gravitational force
Frictional Force
Advection
Conservation of Mass
Relationship between mass inflow and outflow and changes in density is expressed by continuity equation
Horizontal convergence or divergence is balanced by vertical motion
Horizontal convergence leads to vertical divergence
Horizontal divergence leads to vertical convergence
Vertical Motion
Result of friction: air coverages into L at surface, diverges from H at surface
results in rising motion above L centers, sinking motion above H centers
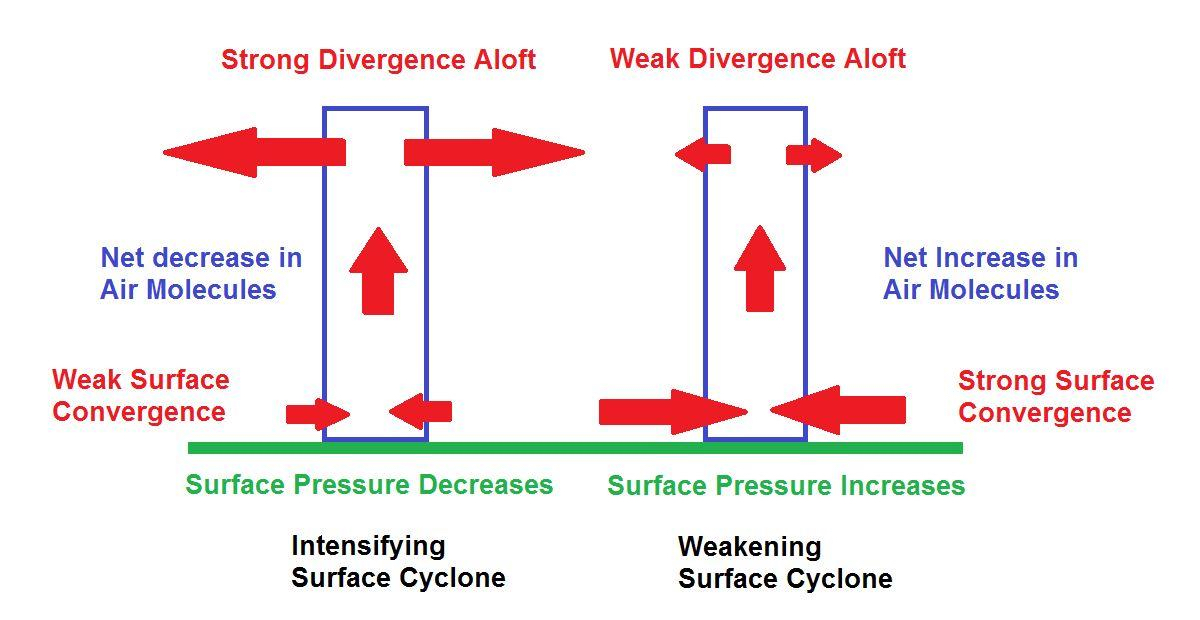
Effect of Mass Conservation
Upper level DIV increases: more air from below has to replace diverging air aloft and surface CON decreases
Upper level DIV weakens: surface CON will increase
Three Cell Atmospheric Model
Hadley, Ferrel, Polar
Jet Stream
Long, narrow, and shallow band of fast moving air
typically located just below the tropopause
westerly
polar jet stream: located near polar front at elevation of 9 km, very steady
subtropical jet stream: located near 30 latitude at elevation of 12 km, extremely variable
decrease of altitude of tropopause from tropics to polar regions
Jet Stream Seasonal Variation
Larger temp gradient between pole and equator in winter than summer, cause stronger jet stream in winter
strength of jet stream related to horizontal temp gradient
Baroclinicity
Baroclinic: density depends on both temp and pressure
strong temp gradient: baroclinic
Barotropic: density depends on only pressure
no temp gradient (ex. tropics): barotropic
Temp and Jet Streams
decrease in temp from tropics to poles
higher heights in tropics and lower heights in polar regions
in stratosphere, temp increases from tropics to poles (opposite)
Strongest geostrophic: occur where pressure surfaces have steepest slope, so where the jet stream is located
Polar Front
Largest temp gradient found near polar front (boundary separating cold polar air and warm tropical air)
moves equatorward in winter, poleward in summer
at any given moment, north/south temp gradient is concentrated along fronts
largest slope of constant pressure surfaces is located along front
Thermal Wind Effect
Relationship between horizontal temp gradient and changes in geostrophic wind speed with height
Height of an upper-level constant pressure surface will increase as air below that pressure surface warms (from hypsometric equation)
in area with large horizontal temp contrast, there will be a large horizontal height difference at given pressure level
Highs
Identified as relative maxima in pressure on constant height maps or height on constant pressure maps
ridge: extended area of relatively high pressure (height)
Highs at Surface
Causes:
general circulation, highs are located in subtropics or polar regions
subsidence (upper level convergence)
monsoonal season temp contrasts: shifts in subsiding air due to changes in land/sea contrasts
cooling air (highs form over cold regions)
Centrifugal Force and Upper Layer Winds
To compensate the imbalance and additional forces (CE), Coriolis must increase/decrease and in turn increase/decrease wind speed
Gradient winds travel faster than geostrophic “over” ridges, travel slower “through” troughs
Upstream side of trough tends to have slower wind speed but downstream side have stronger
Upper Level CON and DIV
Surface low/high is aligned with DIV/CON zone in upper atmosphere
high and low centers are not aligned and generally shift to the west
Air Mass
Widespread body of air whose temp and humidity are fairly similar in any horizontal direction at a given altitude
movement results in changing weather
Area over which air mass originates provides its characteristics
best source is large flat areas with uniform temp or moisture
longer it stays over area, more likely to adopt certain properties
Air Mass Characteristics
Classified based on temp and moisture characteristics:
Moisture
Continental
Maritime
Temp
Polar
Tropical
4 Most Common in NA
Continental polar (cP)
Maritime polar (mP)
Continental tropical (cT)
Maritime tropical (mT)
Formations/Modifications to Air Masses
Formation:
transient weather patterns will cause air masses to move out of source region
Once moves out of region:
modifications due to surface fluxes, radiative heating/cooling, flow over mountains
Continental Polar (cP)
Winter: cold and dry, cold weather/clear skies
Summer: cool and dry, relief from humid weather in central US
Forms in northern interior of NA
Arctic (A)
Winter only air mass: extreme old and dry
Forms in snow/ice covered NA and Arctic
Related to the extreme cold air outbreaks with extreme negative temps
Maritime Polar (mP)
Cool/cold and moist (dependent on source regions and time of year)
Forms over sub-polar cold oceans of north Pacific and north Atlantic
cP, flows over cold ocean, gain moisture, leads to mP
Variable weather conditions dependent on season and locations
mP, move inland, lifted over mountains, rain (lower), snow (higher)
Modification of mP
As air rises over mountains clouds form, latent heat released, precipitation falls on windward side of mountain
On lee side, air warms adiabatically and is warmer/drier
Maritime Tropical (mT)
Hot/warm and moist
Forms over subtropical oceans (Pacific, Atlantic, Gulf of Mexico)
Can lead to record heat and humidity
Responsible for severe weather in central and gulf coast
West coast: warm with heavy rain
Central: warm/humid with flow/low clouds
Continental Tropical (cT)
Hot/dry, no precipitation, can lead to drought in summer
Forms over subtropical land areas (southwestern US, Mexican plateau)
Fronts
Boundary between two air masses of different density
Characterized by:
Large horizontal temp gradients
Large horizontal moisture gradients
Strong horizontal wind gradients
Relative minimum in pressure
Clouds and precipitation
Identifying Fronts
Change in temp (large gradient)
Change in absolute humidity (Large dewpoint gradient)
Pressure and pressure changes (min. pressure along front)
Clouds/precipitation patterns
Cold Fronts
Zone of cold (polar or arctic), dry air replacing warm, moist air (tropical)
Slopes upward towards pool of cold air
Steep slope
Speed: 20-30 mph
How to locate Cold Fronts
Strong temp gradient
Change in moisture content of air (large changes in dewpoint depression over short distance)
Shift in wind direction (large change in speed/direction over short distance)
Strong thunderstorms
Fast moving
Warm Fronts
Front where warm (tropical) air is advancing and replacing cold (polar or active) air
Gentile slope
Uplift confined to small region
Speed: 10 mph
Clouds become lower and precipitation begins as front approaches
High clouds far ahead of front
Weather as result of Warm Front
T: cool/cold with increase in T after front passes (warm air replacing)
Td: rises as front approaches and passes (warm and moist air), steady at higher value
Pressure: falls as front approaches and rises after front passes
less dense air, convection, low pressure, warm air settle, higher pressure
Overrunning warmer and less-dense air rides up and over colder more dense air
How to locate Warm Fronts
Strong temp gradients
Shift in wind direction
Change in pressure
Warm vs. Cold Fronts
Warm fronts slower than cold
Advancing warm air is less dense than cold, warm moves slower
Harder to replace dense air mass
Cold front advancing cold air is more dense than warm air it is displacing
Due to slower movement of warm fronts their slopes are usually shallower than cold fronts (1:300)
Frontal Inversion
Cold air replaces warm , so T increases with height as you move up through front
Warm air rides up and over cold air so T increase with height as you move up front
Stationary Fronts
Front not moving but separates cold and warm air masses
Clouds and light precipitation along/near front
Dryline Fronts
Boundary that separates moist (maritime, mT) and dry (continental, cT) air
thunderstorms common along front
temp is warm on both sides
high Td ahead of dryline since it is moist (mT) and low Td behind dryline (cT)
Frontogenesis
Strengthening of a front as the temp contrast across the front increases
Frontolysis
Weakening or dissipation of a front as the temp contrast across the front lessens
Processes for Frontogenesis/Frontolysis
Kinematics: wind might increase temp gradient
Thermodynamics: spatial differences in heating/cooling can strengthen/weaken front
Dynamics: flow associated with front can enhance kinematic/thermodynamic effects
Occluded Fronts
Front that forms when a cold front (dense) catches up to and overtakes a warm front (less dense)
Clouds and precipitation: similar to warm front
T: little change with slight decrease after front passes
Td: little change
Pressure: minimum at front
Stages of Occluded Front
Cold front moves faster than warm
Cold front catches up due to being denser than warm
Cold air completely surrounds low-pressure center, occluded front is the boundary between warm and cold
Extratropical Cyclones
Extratropical: refers to something outside of tropics (middle or high latitudes)
Cyclone: area of low pressure
Cold Core Low
Low pressure system with coldest temperature located near its center
Strengthening cold core low is tilted with height
ETC Characteristics
Pressure: low (950-1000 mb)
Wind: CCW, inward spiral, rising air over low, moderate to strong speed
Size: 500-1000 km
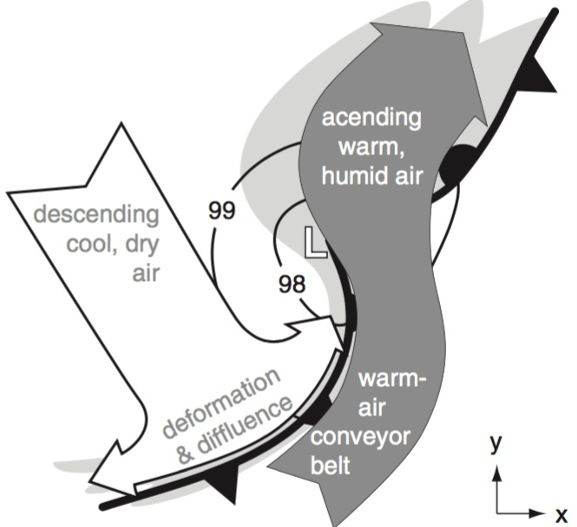
3 Dimension Airflow
Behind cold front: descending cool, dry air
Ahead of cold front (in warm sector): warm air moves towards/over warm front
This is the warm air conveyor belt
Ascending warm, humid air: responsible for area of cloud cover ahead of warm front
Cyclogenesis
Development or intensification of a cyclone
net DIV in a column of atmosphere will cause surface pressure to decrease and cyclogenesis to occur
Cycloysis
Weakening or dissipation of a cyclone
Polar Front Theory
Model of how mid-latitude storms develop: birth, growth, decay
connects storms with dynamics of the polar front
transition zone between cold in polar cell and warm in ferrel cell
Cyclone Evolution
Stationary Front
Frontal Wave
Open Wave
Mature Stage
Advanced Occlusion
Cut-Off Cyclone
Stationary Front
Cold and warm air (winds) are both flowing parallel to stationary front and have opposite direction
initially a stationary front is located in mid latitudes
cyclogenesis favors baroclinic zone (temp gradient creates this zone)
Frontal Wave
Perturbation occurs at the intersection of two air masses where there is large temp gradient causing a wave pattern to develop
CCW flow begins to develop around low'
hard to predict due to being small feature
more DIV than CON
Open Wave
Frontal wave to open wave where pressure decreases and wind strengthens
Warm sector: region of warm air between advancing cold and warm fronts
westerly
clouds and precipitation ahead of warm front and along/behind cold front
Mature Stage
As cyclone continues to move northeastward the pressure continues to fall, winds increase and waves develop into mature cyclone
Known as “Initial Occlusion”
warm sector narrows
strong wind, heavy precipitation
Advanced Occlusion
Cyclone is now occluded, cold air surround cyclone leading to lower temp gradient (decay stage)
Dry tongue (intrusion): cool, dry air wraps around cyclone
warm air is forced aloft
surface low begins to be removed from upper level DIV and pressure begins to increase (cyclolysis)
Triple point: where the occluded, warm and cold fronts meet (new low may form, AKA secondary low)
Cut-off Cyclone
Cyclone dissipates
lasts several days to more than a week
few storms directly follow this
Stages/Relationship between Upper/Surface
Upper level CON leads to sinking air and suppresses clouds
Upper level DIV helps to deepen cyclone
Upward motion through DIV help to form clouds and precipitation
Lee Cyclogenesis
Development of a cyclone on the lee side of a mountain range
Lee side low: low pressure center that develops on the downwind side of a mountain range
Behind mountains: no rotation
On mountains: DIV, CW, H, anticyclone
Leeside: CON, CCW, L, cyclone
Rossby Wave
Height of mountain, driven by changing Coriolis parameter with latitude
Cause of DIV or CON
Upper level processes (troughs or ridges)
Diabetic heating (modifying temp independent from pressure changes)
Boundary layer effects: friction, surface heat and moisture fluxes
Jet streaks
Boundary Layer Effects and Cyclogenesis
Low level CON into surface low results in rising
Rising, air cools adiabatically, RH increases, clouds and precipitation from
Friction in boundary layer causes wind to spiral causing CON
Diabatic heating
Modifying temp independent from pressure change
Caused by latent heat release as clouds form
Heating causes upper level pressure/height to rise which results in upper level DIV and causes surface pressure to fall