Correlations
1/6
There's no tags or description
Looks like no tags are added yet.
Name | Mastery | Learn | Test | Matching | Spaced | Call with Kai |
|---|
No analytics yet
Send a link to your students to track their progress
7 Terms
What is a correlation and how is it shown graphically?
a statistic that identifies the strength and direction of a linear relationship between 2 co-variables
Plotted on a scattergram
How does a correlation study differ from an experiment?
An experiment involves manipulating the IV
A correlation study involves co-variables instead if IV & DV
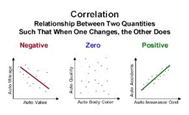
What would a positive, negative, and zero correlation look like on a scattergram
State and explain the main weakness of correlational research
Can’t establish cause and effect because it doesn’t manipulate an IV
Variable A may cause B to change or vice versa
Variable C may cause both A and B to change
Explain why correlational studies are often used rather than experiments for ethical and practical reasons
Ethical - can do a correlation when it’s not acceptable to manipulate variables since it wouldn’t protect participants from harm
Practical - can do a correlation when it’s impossible to manipulate the IV
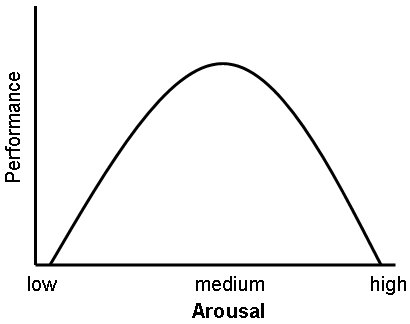
Explain how a zero correlation could involve a set of results which display a clear pattern on a scattergram
Could show an inverted U shape
E.g. performance and arousal
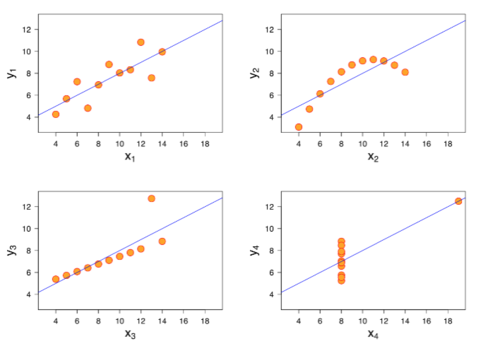
Explain how despite having the same correlation coefficient in 2 studies, it may not be possible to draw the same conclusions about the association between the covariables
different patterns can lead to the same correlation coefficient
But there patterns would lead to different conclusions