Geography - Midterms
 Call Kai
 Learn
Learn Practice Test
 Spaced Repetition
 Match
Match Flashcards
 Knowt Play
1/42

Earn XP
Description and Tags
Population Change and Natural Increase, The Demographic Transition Model, Population Pyramids, and Dependency Ratio
Name | Mastery | Learn | Test | Matching | Spaced | Call with Kai |
|---|
No analytics yet
Send a link to your students to track their progress
43 Terms
What is the definition of demographics?
Specific, statistically identifiable segments of a human population
How is population growth different from just population size?
Population size is the country’s total citizens
Population growth is the increase in population at a specific time
What is the definition of birth rate, and how is it usually measured?
Number of births per year / 1000 people
(Births / Population) x 1000
What is the difference between natural increase and decrease?
Natural increase means the population grows naturally due to births > deaths
Natural decrease is when population decreases having deaths > births
What does fertility rate mean?
A demographic metric measuring average number of children born to a woman over her lifetime
How does the total fertility rate differ from the general fertility rate?
Total fertility rate means the average number of children in a woman’s lifetime
General fertility rate means the annual number of births per 1,000 women of childbearing age
What is the definition of infant mortality rate?
Probability of an infant dying before their first birthday (calculated as the number of infant deaths / 1000 births)
What is life expectancy?
The average number of years a person is expected to live
What is the difference between immigration, emigration, and migration?
Emigration means exiting your home country to live elsewhere
Immigration means entering a new country to settle
Migration is the general process of moving
What is an age cohort?
A group of people born within the same specific time frame (around the same age)
Who is included in the category of dependents?
Children under 15 and elders over 65
What is the definition of a dependency ratio?
Number of dependents / Working-age adults
What does the DTM stand for?
Demographic Transition Model (Shift in population over 5 stages)
In population studies, what is an anomaly?
An anomaly is a data point that significantly deviates from established patterns
What does the sex ratio measure?
The relative number of males to females in a population
What is economic development?
The process of improving economic well-being / quality of life through strategic initiatives, job creation, and infrastructure investment
What does MEDC and LEDC stand for?
More Economically Developed Country (MEDC)
Less Economically Developed Country (LEDC)
What is used to calculate natural increase using birth rate and death rate?
birth rate - death rate = natural increase
How do you identify whether a population is growing, stable, or decreasing based on vital rates?
Growing = Birth rates > Death rates, Stable = Birth = Death, Decreasing = Birth < Death
How is a country's rate of natural increase typically connected to its level of economic development?
Advancements in healthcare systems, technology, and better knowledge
What does the Demographic Transition Model show/track over time?
How a country's birth / death rates, and total population size change over time as it develops
What is the Stage 1 of the DTM regarding birth/death rates, and total population?
High birth / death rate
Total population to remain low and relatively stable with violent fluctuations
What is the Stage 2 of the DTM regarding birth/death rates, and total population?
High birth rate, Low death rate (rapid decrease)
Total population grows significantly
What is the Stage 3 of the DTM regarding birth/death rates, and total population?
Low birth rate (rapid decrease), Steady death rate
Total population grows steadily
What is the Stage 4 of the DTM regarding birth/death rates, and total population?
Low birth / death rate
Stable total population
What is the Stage 5 of the DTM regarding birth/death rates, and total population?
Extremely low birth, low death rate
Total population begins to shrink due to birth rates < death rates
How do birth/ death rate, and population growth change as it moves from Stage 1 to 5?
Moves from high birth / death rates ( pre-industrial ) to low birth / death rates ( developed economies )
What are the two main demographic variables displayed on the axes of a population pyramid?
Age ( y-axis ) and gender ( x-axis )
How does the shape of a population pyramid change as a country progresses through DTM Stages 2, 4, and 5?
Broad-based triangle ( Stage 2 ) to a rectangular shape ( Stage 4 ) and then to an inverted, top-heavy pyramid ( Stage 5 )
What does an unexpected "bulge"/"indent" in a single age cohort on a population pyramid represent?
It could represent an unusual spike in births, a mass influx of immigrants, a period of high economic prosperity, etc.
What historical event that could cause an anomaly in a population pyramid?
Wars ( sudden high death rates, post-WWII "baby bust" ), famines / epidemics, government policies (China’s One-Child Policy ), mass migration, cultural beliefs, etc.
How can a government use a population pyramid to plan for future public services?
To forecast future societal needs / allocate resources efficiently, by analyzing the age, sex, and distribution of a population
What is the mathematical formula used to calculate the dependency ratio from population data?
( under 14 % + over 65 % ) / working population x 100
What does a high dependency ratio suggest about a country’s economy and workforce?
Increased economic pressure on the workforce, signaling strains on public finances, potential labor shortages, and a heavier tax burden to fund healthcare and pensions.
What does a low dependency ratio suggest about a country’s economic advantages?
Increased labor supply, higher savings rates (boosts domestic capital for businesses / infrastructure ), reduced social spending, economic growth potential, etc.
What is the social/economic impact of a country facing severe old-age dependency?
Shrinking Workforce & Slower GDP Growth, escalating Fiscal Pressure, shrinking tax base, and decreased savings & investment
What is the social/economic impact of a country facing severe youth dependency?
Stifled capital accumulation, resource diversification ( governments are forced to spend massive amounts of public funds on basic social infrastructure ), high youth unemployment / wage "scarring"
Why is the dependency ratio a useful but imperfect metric for measuring the actual economic burden on a working population?
Because many people over 65 still work while 15 - 18 children are not legally allowed to work full-time
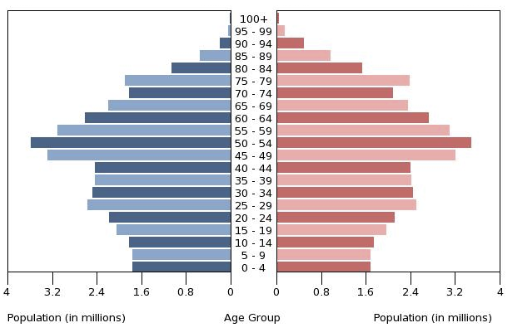
What stage is this? Why?
Stage 5 (There is negative population growth as the top and bottom are smaller than the middle section)
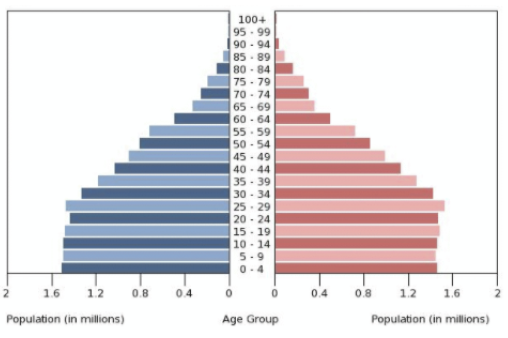
What stage is this? Why?
Stage 3 (There is rapid growth as there is a wide base and concave curve peak, however it is not the earlier stages as people are usually living until their 60s)
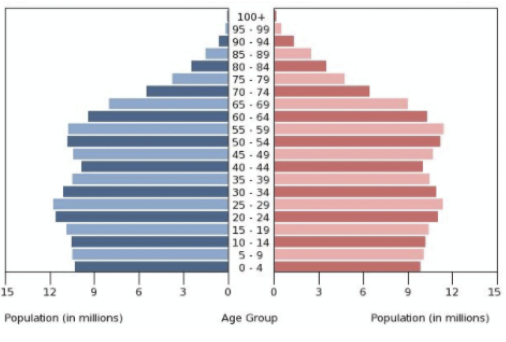
What stage is this? Why?
Stage 4 (There is negative population growth as the top and bottom are smaller than the middle section except 35 to 49)
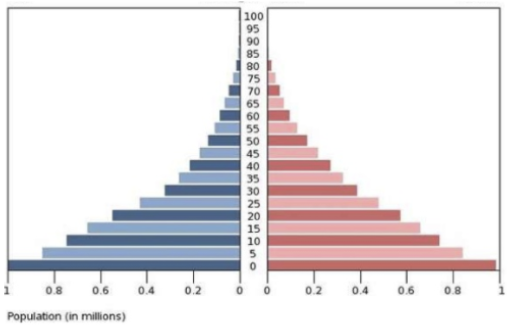
What stage is this? Why?
Stage 1 (Wide base with a concave curve peak, meaning high birth/death rate)
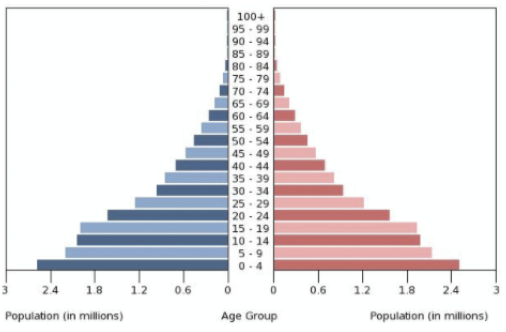
What stage is this? Why?
Stage 2 (Wide base with a concave curve peak with slightly less babies born)