Stats Exam 1
1/28
Earn XP
Description and Tags
ST 260 Daniel Balena
Name | Mastery | Learn | Test | Matching | Spaced | Call with Kai |
|---|
No analytics yet
Send a link to your students to track their progress
29 Terms
Type I error
occurs when the sample gives evidence to reject the null hypothesis, but the null hypothesis is actually true (also known as a false positive).
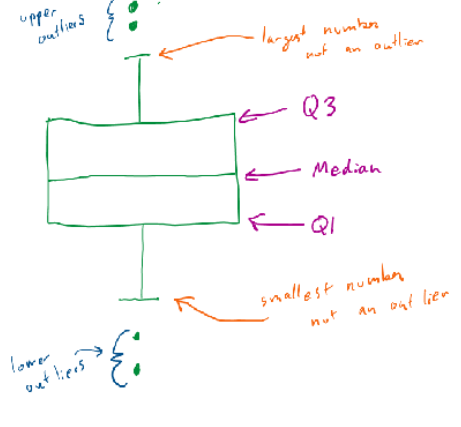
Box and whisper graph
Categorical data
“names” not numbered measurements (countif and vlookup)
Scale data
number, measurements
Discrete
numbers that are “isolated” i.e. shoe size (scale)
Continuous
number data with unlimited options between any two numbers i.e. foot length (scale)
Nominal
names or categories with no implied order (i.e. state, eye color)(categorical)
If the test statistic is "further away" from zero (i.e., the center of the bell-shaped curve) than the critical value, the null hypothesis ______ be rejected. This means the test statistics is in the "rejection region".
Should
For a hypothesis test, if the p-value is more than the alpha given, the null hypothesis ______ be rejected.
Should not
ordinal
names with an implied order i.e. credit rating category (categorical)
Suppose you calculate the correlation coefficient for a dataset containing the daily gains/losses of Ford's stock price and Starbuck's stock price for the past year. The correlation coefficient is calculated to be a number close to 0. If the price of Ford's stock increased the next day, what would you expect the price of Starbuck's stock to do?
Option A: Increase
Option B: Decrease
Option C: Wouldn't expect one stock price to affect the other
Wouldn't expect one stock price to affect the other
Frequency
the number of times a specific value, observation, or event occurs in a dataset or experiment
mean definition
a measure of central tendency in statistics representing the sum of all values in a dataset divided by the total number of value
Rank
(n+1)/2 n=number of data points
median
The middle value in an ordered dataset, representing the 50th percentile where half the data points are lower and half are higher
Mode
The value in a list of quantitative data that occurs more than any of the other values.
Intersection
only elements that are found in both sets are kept (interchangeable with “and”)

Complement
a set is all the elements (in the sample space) not in the set.

Conditional Probablitity
occurs when additional information shrinks the sample space of the probability assignment
Normal Distribution
For this distribution the mean, median, and mode are always equal to each other, and the mean/median/mode can take on any number from negative infinity to positive infinity.
When does an outlier exist
if a datapoint is larger than the upper limit or lower than the lower limit.
Exponential distribution
For this distribution the mode is always equal to zero, and the mean is always larger than the median.
Uniform distribution
For this distribution there is no mode, and the mean and the median are always equal to each other.
Standard normal distribution
For this distribution the mean, median, and mode are always equal to zero.
range
The distance between the largest and smallest values in a list of quantitative data.
Interquartile range
The distance between the value that is larger than 75% of the values and the value that is larger than 25% of the values in a list of quantitative data.
Standard deviation
The "average" distance each value is from the mean in a list of quantitative data.
Variance
The "average squared" distance each value is from the mean in a list of quantitative data.
Type II error
occurs when the sample gives no evidence to reject the null hypothesis, but the null hypothesis is actually false.