Kine 2050 (final exam)
1/193
There's no tags or description
Looks like no tags are added yet.
Name | Mastery | Learn | Test | Matching | Spaced | Call with Kai |
|---|
No analytics yet
Send a link to your students to track their progress
194 Terms
What did the father of science fiction, H.G. wells (1903) hypothesize?
"Statistical thinking would one day be as necessary for good citizen ship as the ability to read and write"
Are the consequences of mathematical innumeracy as obvious as illiteracy?
No
What are the consequences of mathematical innumeracy?
• Lack of numerical perspective
• Misunderstanding of probability
Why study statistics?
• In order to understand a scientific discipline it is necessary to know the procedures for evaluating scientific evidence
• Many groups and individuals attempt to influence your behaviour with statistical arguments. Knowledge of statistics enables you to evaluate arguments in a responsible manner
What is statistics?
• The science of the collection, organization, analysis, and interpretation of data
• A set of procedures and principles for collecting and organizing data and analyzing information in order to help people make decisions when faced with uncertainty
The discovery of knowledge
1) Asking the right questions
2) Collecting useful data which includes deciding how much is needed
3) Summarizing and analyzing data with the goal of answering the question(s)
4) Making decisions and generalizations based on the observed data
5) Turning the data and subsequent decisions into new knowledge
What are the two types of statistics?
1) Descriptive
2) Inferential
What are descriptive statistics?
• Organize, describe and summarize a small dataset
• Results obtained represents the entire dataset
• Can constitutes the first stage of analysis
• Often used when researchers begin a new area of investigation
What are inferential statistics?
• Take data from a sample and make conclusions about the population
• Use a smaller dataset to make estimates and draw conclusions about the greater population (that the sample is drawn from)
• Can be used to determine cause and effect relationships, test hypothesis and make predictions
What is a population?
All of the objects that researchers want to describe or make inferences about
What is a parameter?
A characteristic of population
What is a sample?
• Sub-group of population that researcher believes represents the population
• A group of specific size (n=) is selected and measured
What is a statistic?
A characteristic of sample
What is the best way to make sure that a sample is representative of a population?
Make sure the sample is randomly selected from the population
What is a random sample?
An unbiased sample
How do you ensure that a sample will be unbiased?
Every element of the population must be equally likely to be selected to the sample group(s)
What constitutes data
1) Observations (= individuals or cases)
2) Variables (observations' attributes)
What are variables?
• Characteristics of a person, object or phenomenon that is amenable to change and is measurable
• Any observable/measurable property of organisms, objects, or events
Variables can be either
1) Quantitative (numerical)
2) Qualitative (categorical)
What is quantitative data?
Can be expressed as numbers (numerical data) which can be added, subtracted, multiplied
What are examples of quantitative data
• Age (years)
• Blood pressure (mm of Hg)
• BMI
• Pulse per minutes
• Exercise in hours per week
• Coffee drinking in ounces per day
What are the types of quantitative data?
1) Continuous
2) Discrete
What is continuous data?
Can theoretically take on any value within a given range (height)
What is discrete data?
Can only take on certain values (number of children in a family, number of cities)
What is qualitative data?
Variables describe a quality or attribute of the individual
What are the types of qualitative data?
1) Binary (two categories)
2) More than two categories
What are examples of binary data?
• Treatment/placebo
• Disease/no disease
• Exposed/Unexposed
• Did you have breakfast in the morning? (yes or no)
What are examples of multi category data?
• Hair colours (blond, brown, red etc)
• Teams
• Majors
What are the four levels of measurement?
a) Nominal (qualitative)
b) Ordinal (qualitative)
c) Interval (quantitative)
d) Ratio (quantitative)
• More information conveyed as one moves from A to D
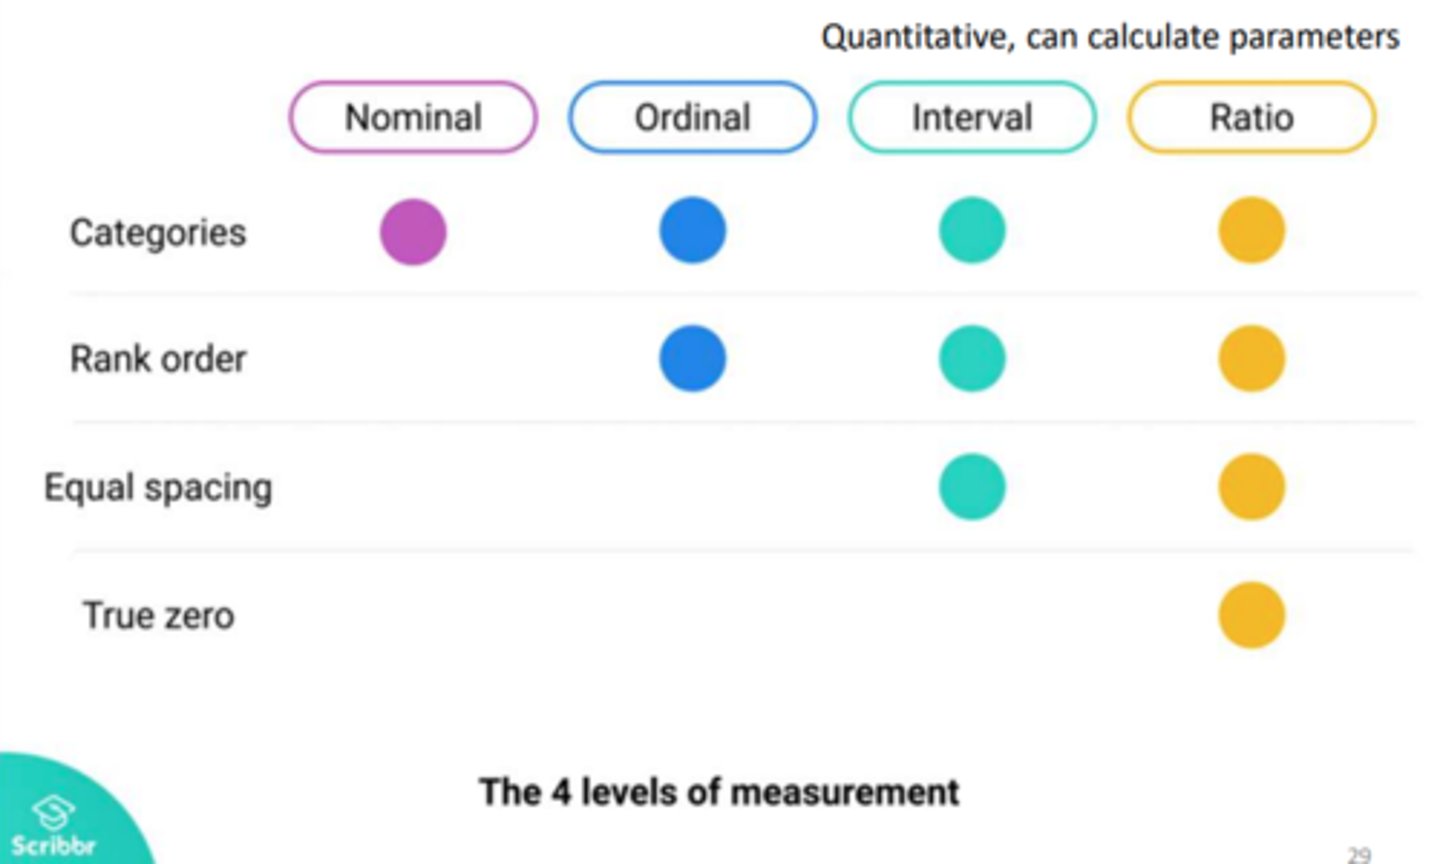
What is nominal data?
• Data placed in categories (no ordering)
• Can't be quantified
• Mutually exclusive
• Examples (blood type, type of car owned, gender, colour of paint)
What is ordinal data?
• Data is ranked
• Examples (all contests, preference (first, second, third), mineral hardness, cancer stages, University ranking, letter grades)
What is interval data?
• The levels of the variable are in order and evenly spaced apart (equal intervals)
• Zero point is arbitrary
• Therefore not proportional (or multipliable)
can calculate the difference between levels
• Examples (temperature (F, C) temperature can be below 0 degree Celsius (-10 or -20)
What is ratio data?
• Same as interval but zero is absolute or true • Zero indicates an absence of the variable
• Can compare not only with respect to the difference but as a proportion (twice as old, 10% heavier)
• Examples (age, distance, weight, time, money etc)
What is an independent variable?
• The variable that the experimenter manipulates or changes, or being characterized, and it's assumed to have a direct effect on the dependent variable
• A variable whose effects on the dependent variable we wish to study
What is a dependent variable?
• The variable of that is being tested or measured
• A variable whose changes we wish to study a response variable
• The variable that is "dependent" on the "independent variable"
Can the dependent variable cause a change in the independent variable?
No, but the independent variable can cause a change in the dependent variable
What are the "ideals" of experimental control?
• To imply causation, the experimenter eliminates the influence of all variables that could affect the dependent variable except the one (s) directly manipulated
• All conditions are kept the same for all participants except the effect of the independent variable
Whats are the "realities" of experimental control?
• Impossible to control all variables that could affect the dependent variables
• Researchers control the variables they ca
• Other influences that are not controlled are assumed to be randomize (we assume the effects are "washed out" if they are "spread out" over the groups)
What are the three functions of statistical methods?
1) To assist in describing data
2) In making inferences or generalizations from experimental data (sample) to larger groups (population)
3) In studying causal relationships
What is a frequency distribution?
Lists all possible data values or type, and the frequency of occurrence of each one
What is the purpose of a frequency distribution?
• Organize and describe the data in table form
• Reveal the pattern of the scores/observations
What are the types of frequency distributions?
a) Ungrouped
b) Grouped (class intervals)
What is ungrouped distribution?
• Frequency of all the possible data values or items in your dataset
• Can be nominal/ordinal categories or quantitative but small number of single values
What is grouped distribution?
• Applies when all "possible data values" would be too many, so data are arranged and separated into groups called class intervals
• Each class intervals includes a range of data
What are ungrouped distribution examples?
• Categorical (blood type, majors, teams)
• Quantitative (number of kids in a household, number of town/cities you have lived in, etc)
What are grouped distribution examples?
• Annual salary, reaction times for any of motor tasks, weight, commuting time to York
• Continuous values (need a range) but can be discrete (age)
What are the seven steps in constructing a grouped frequency distribution?
1) Count the number of scores
2) Identify highest and lowest score (max - min = range)
3) Identify smallest unit of measurement (by how much can your score increase from one participant to another)
4) Decide on appropriate number of class intervals
5) Decide on the score range of each class interval (i)
6) Round this class interval to make the this range pretty
7) List class intervals of scores in order (make sure that intervals have 1) same width (range of number), 2) no overlap across intervals, 3) no gaps)
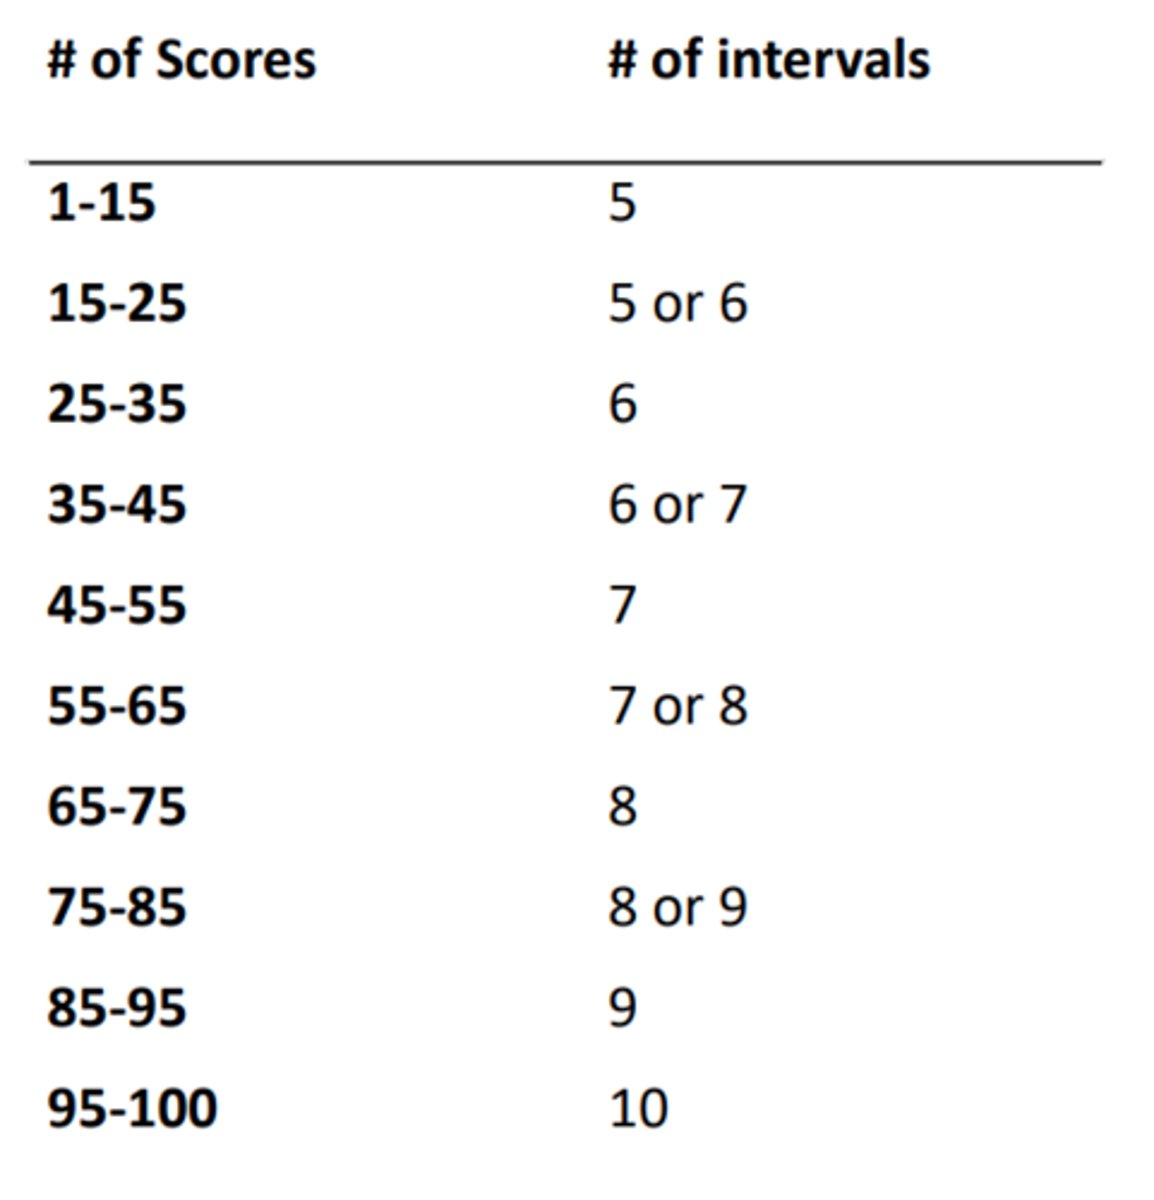
How do you calculate step 5 of constructing a grouped frequency distribution?
i = width of class interval (range of scores)
i = largest score-smallest score/number of class intervals
When to use ungrouped distributions?
1) When data are items rather than numbers (nominal or ordinal (qualitative) values)
2) When can use all possible data values without being too many (< 15)
3)
When to use ungrouped distribution?
When data values are continuous (weight, time, blood pressure) or too many possible data values (age, or salary)
What are graphs?
• A pictorial representation of a frequency distribution or other data
• Helpful in understanding concepts (frequencies, mean, standard deviation)
What are bar graphs?
• Depict frequencies or other group statistics (mean of the dependent measure for each group as a vertical bar for each group or category)
•. The groups or categories are on the x-axis is nominal so the order of the categories doesn't matter
• Separated by some space
What are histograms?
• Uses vertical bars to depict frequencies of an interval/ratio variable (but not other statistics)
• Histogram differs from a bar graph in that it does not having spaces between the bars
• Ungrouped frequency distribution is depicted by a bar graph while grouped frequency distribution is depicted by a histogram
What are the key characteristics of a histogram?
Peaks, spread, symmetry
What is a peak?
• The tallest cluster/s of bars
• Represent the most common values/bulk of data
What is a spread?
How much the data varies
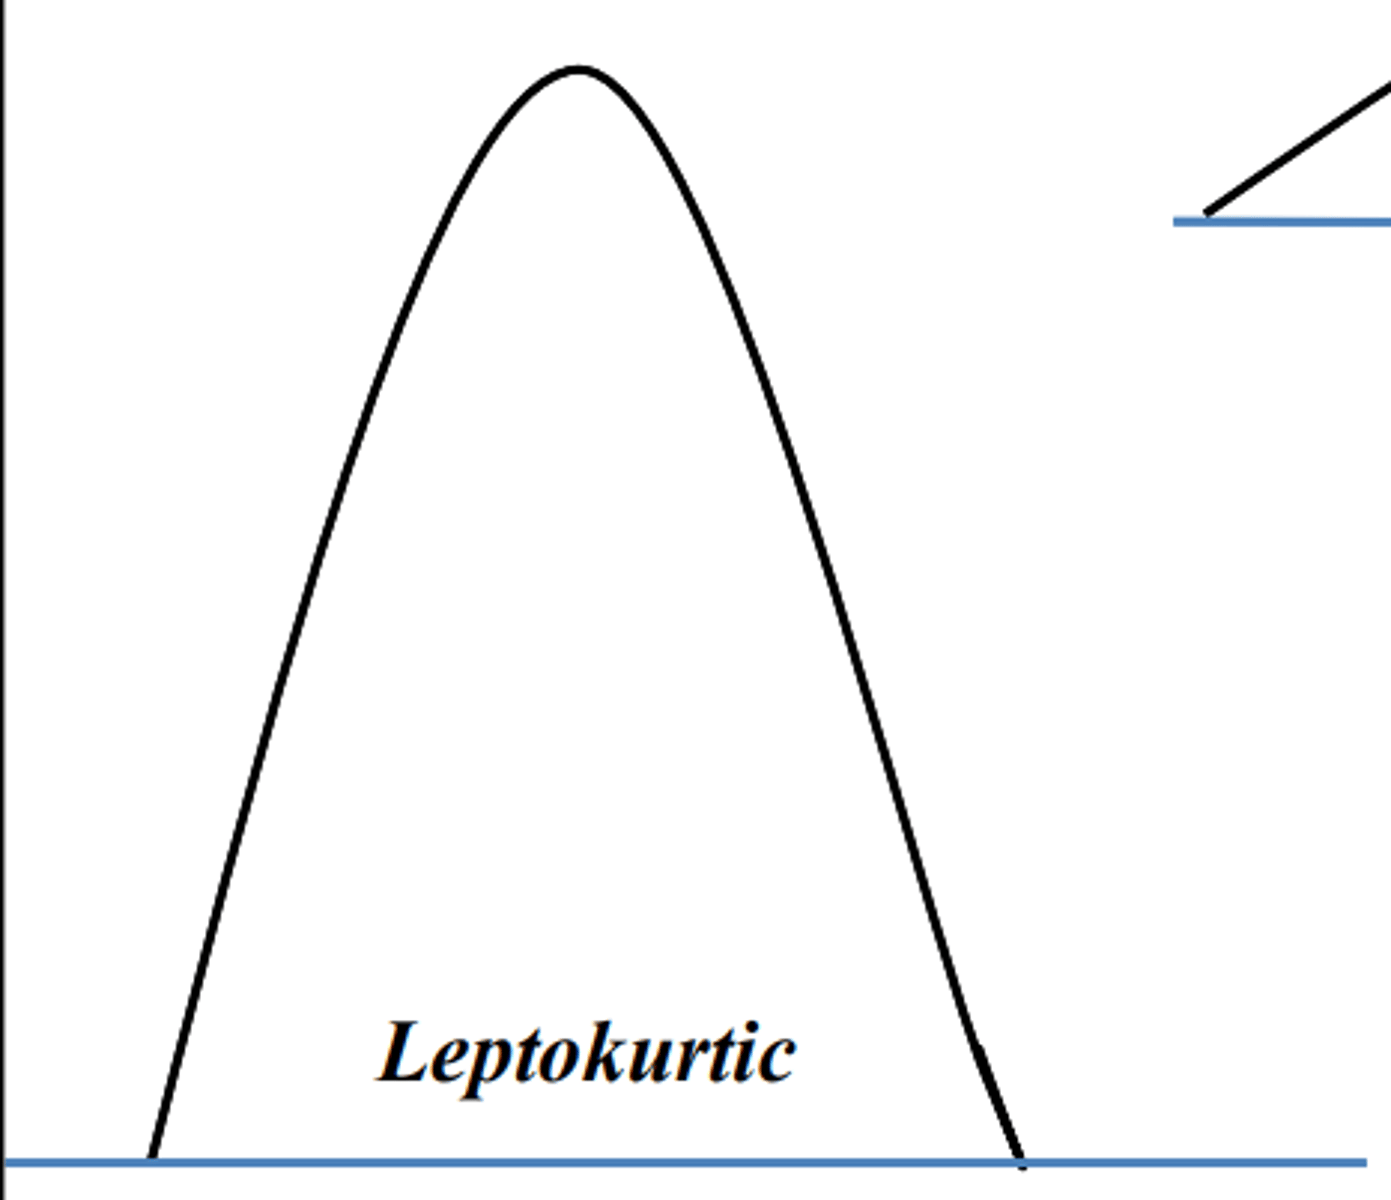
What is kurtosis?
• The relative peakedness or flatness of the distribution
• It reflects whether the scores are more or less evenly distributed throughout the measurement range
What is leptokurtic?
The scores are bunched together with steeply sloping sides
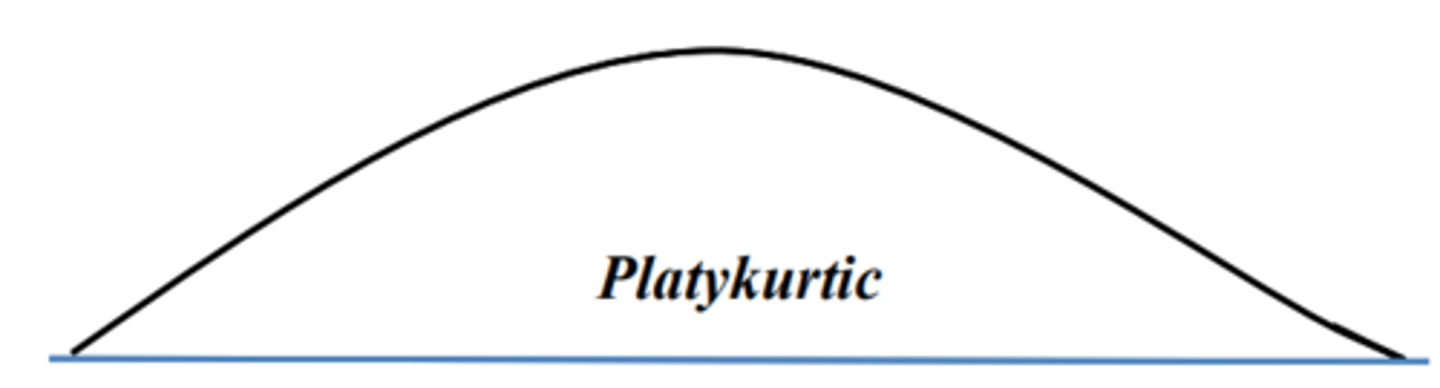
What is platykurtic?
• The scores are more evenly spread out
• Greater proportion of the scores fall toward the ends, or tails
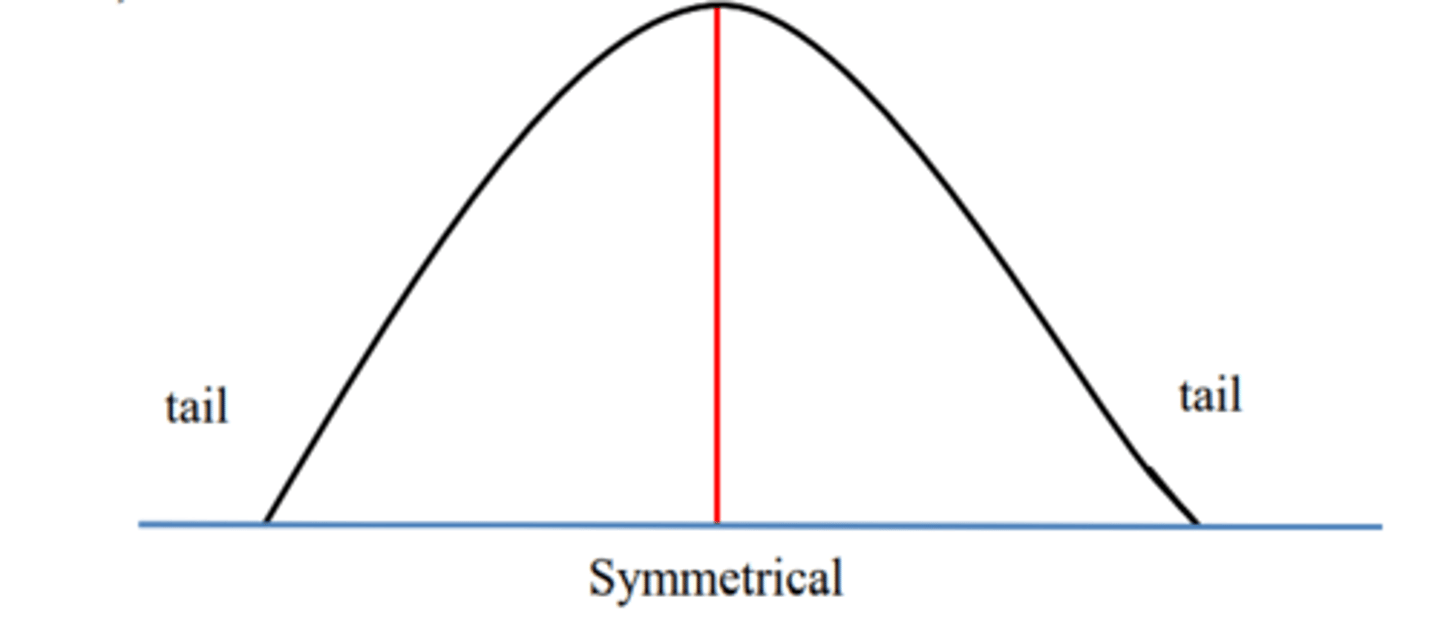
What is symmetry in a normal distribution?
• A distribution is termed symmetrical when the data frequencies decrease at equal rates above and below a central point
• Visually bisected (one half is mirror image of the other)
What is a non symmetrical distribution?
Skewed (bunching of the observations at one or the other end of the measurement range)
What are the types of non symmetrical skews?
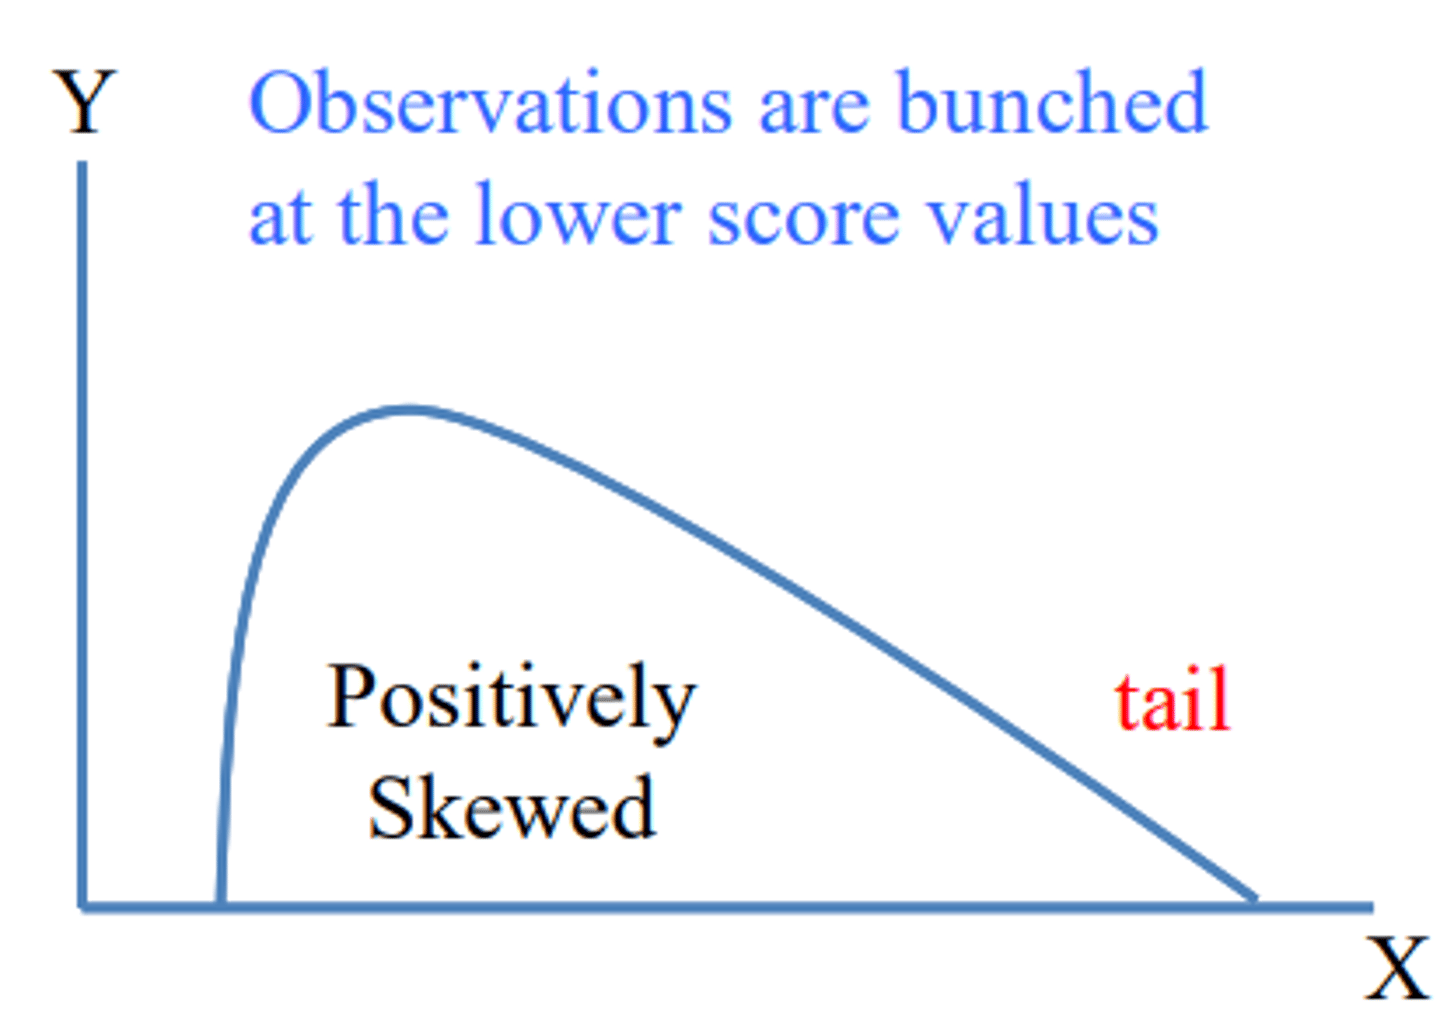
1) Positively skewed
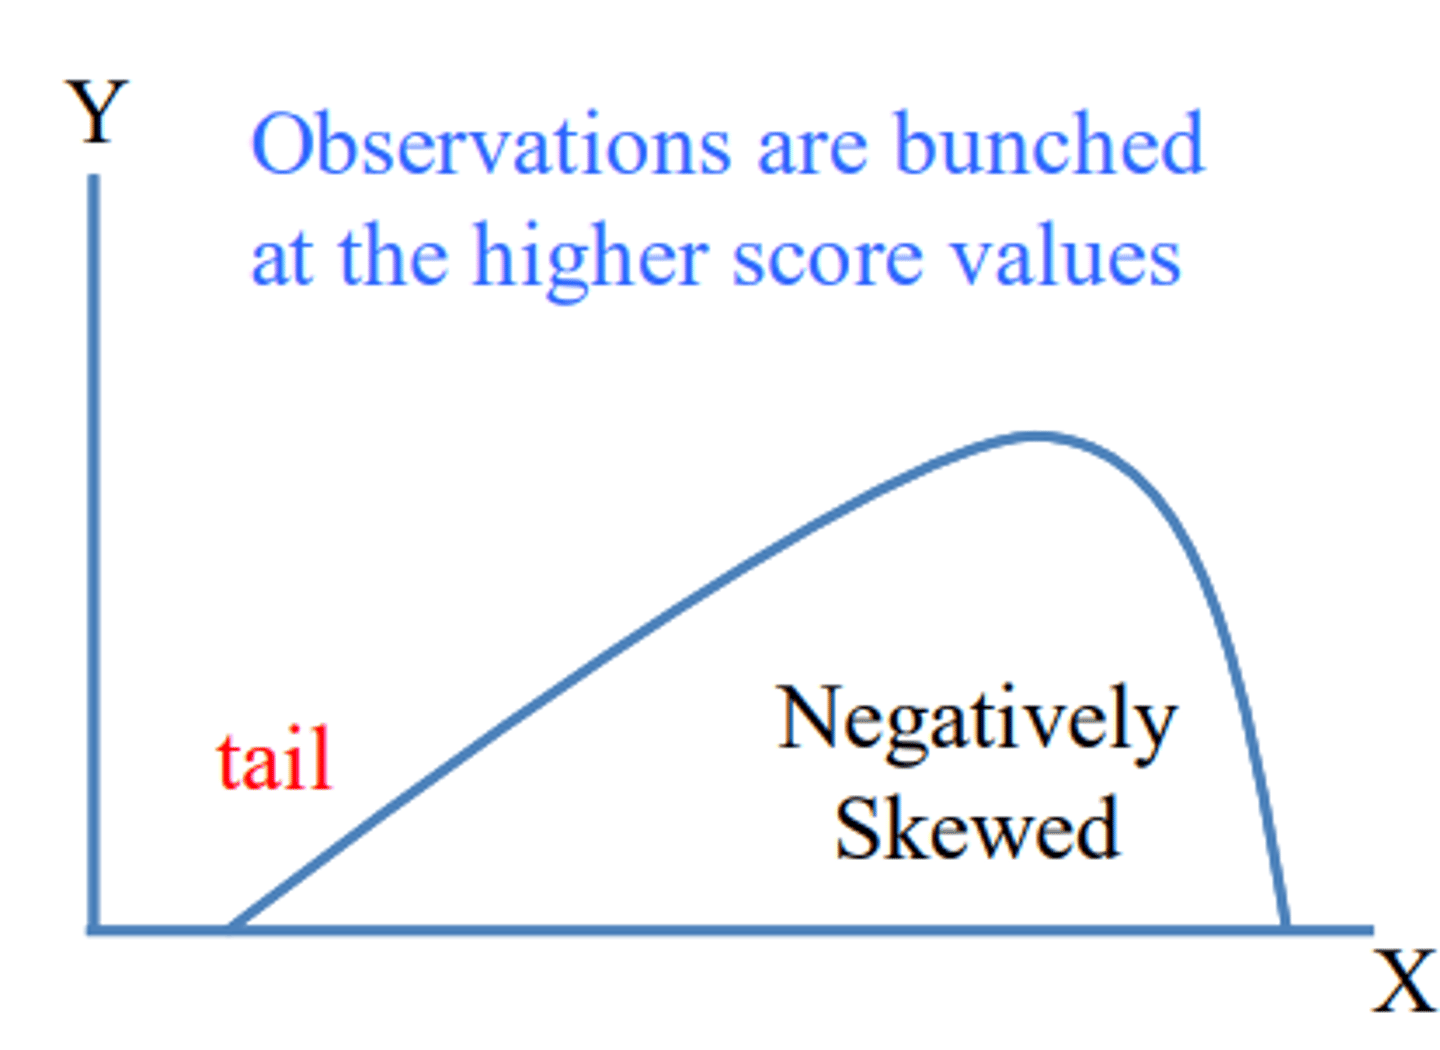
2) Negatively skewed
What is positively skewed?
Observations are bunched at the lower score values (tail on the right side)
What is negatively skewed?
Observations are bunched at the higher score values (tail on the left side)
What are outliers?
• Data values that are far away from other data values
• Strongly affect your results.
What is central tendency?
• Center of data set
• A single summary number which indicates where many of the scores lie
What are the three measures of central tendency?
1) Mean
2) Median
3) Mode
What is a mean?
• Arithmetic average
• Calculate by hand from raw scores (mean = Σx/n (the sum of the scores divided by the number of scores)
• The mean of a sample of X scores is symbolized as (x-bar) ← statistic
•. The mean of a population is symbolized by Greek letter μ (mu) ← parameter
What is a median?
The score which divides the total number of scores in half = 50th percentile
How do you calculate the location of the median?
L = n + 1/2
What is the mode?
•.Score that occurs most often (most common value)
•.Bimodal = more than one mode
• Mode is only useful for categorical data, or possibly very large datasets of interval/ratio data
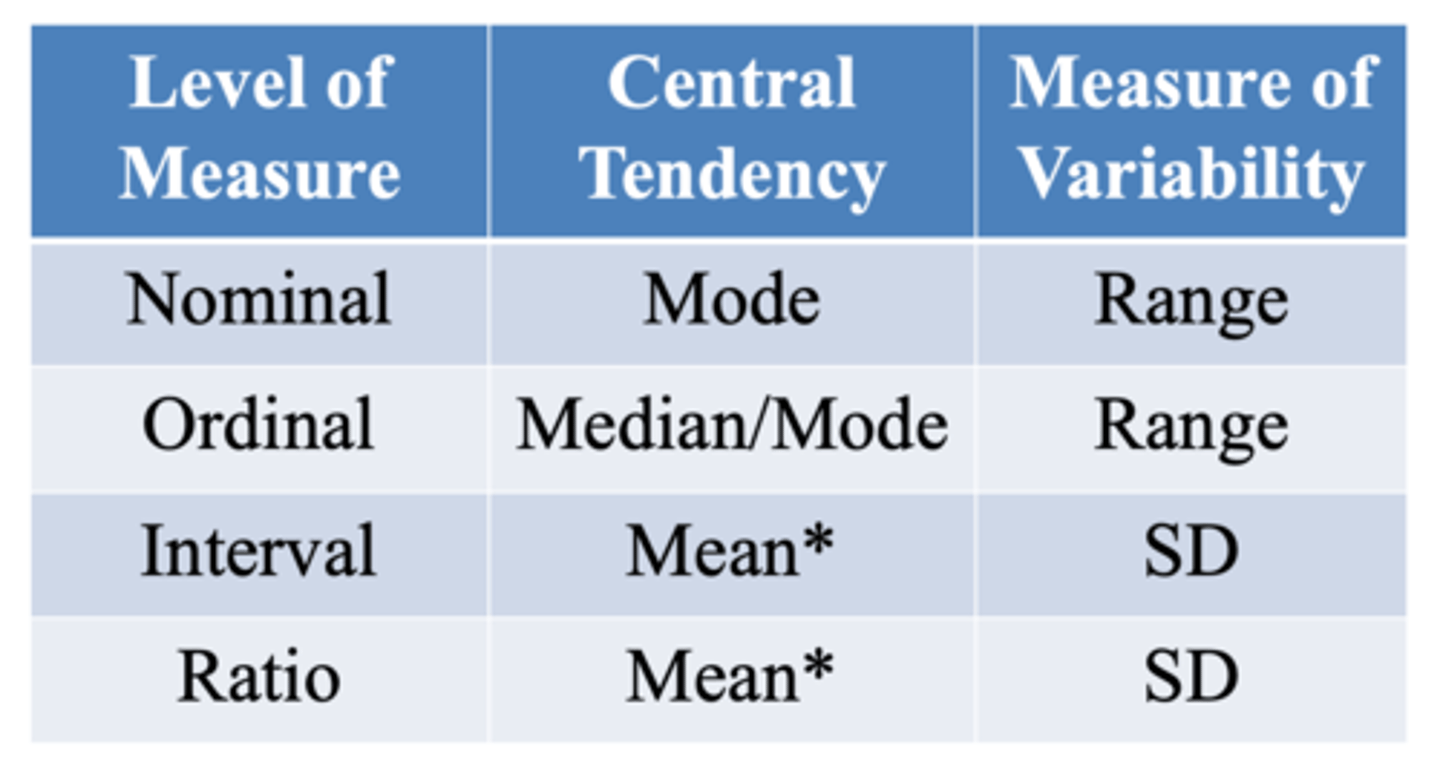
Which measure to use?
1) Nominal → mode (can't calculate mean or median)
2) Ordinal → median
3) Interval or ratio → mean and/or median (use median instead of mean if highly skewed distribution or if have outliers (median not as affected)
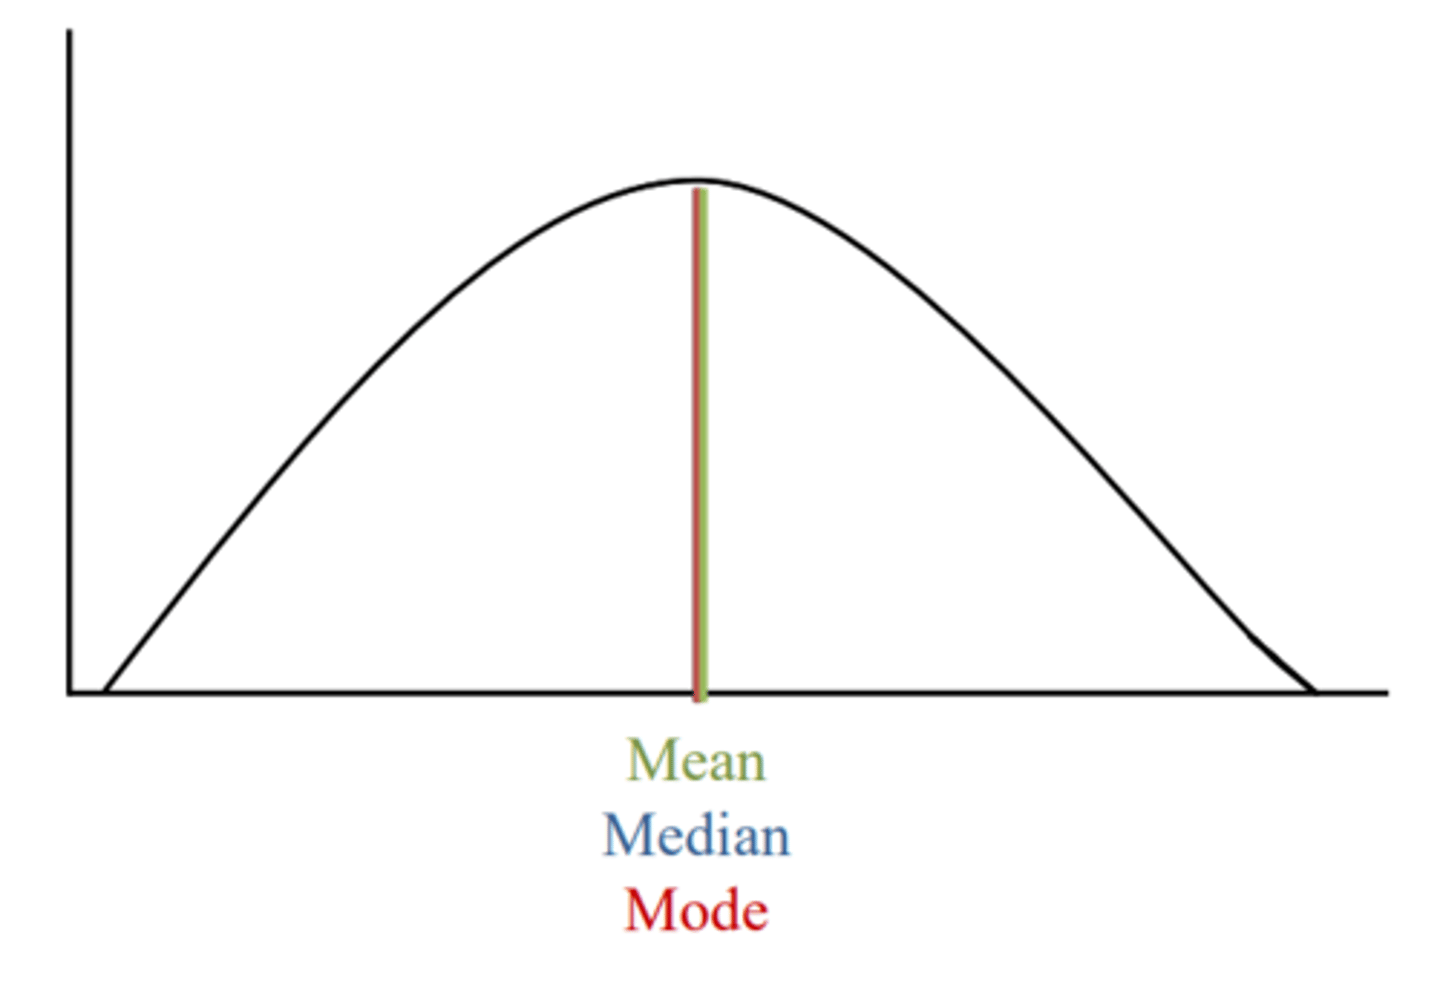
Measures of central tendency in a normal distribution
Mean = median = mode
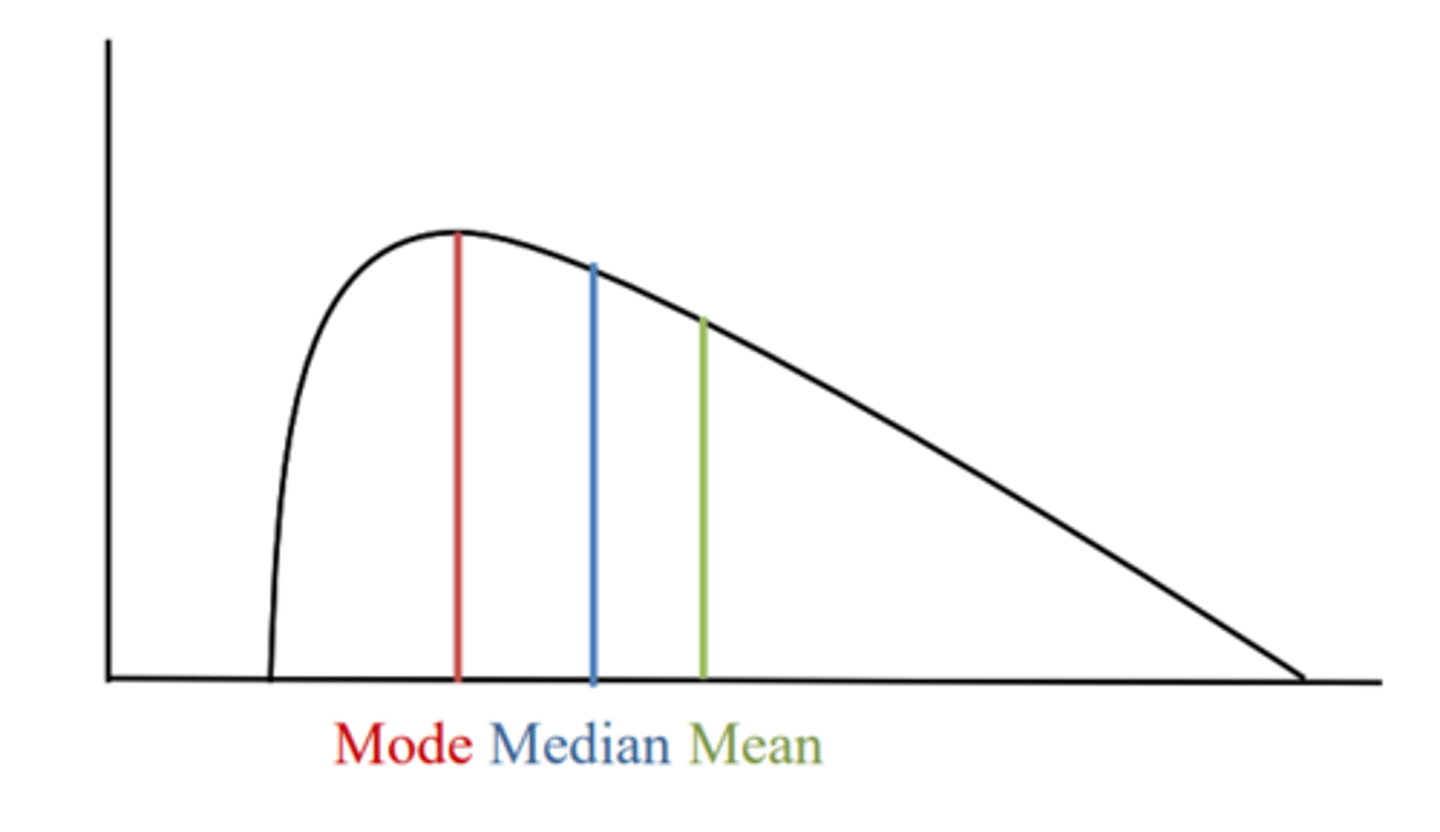
Measures of central tendency in positively skewed data
Mode → median → mean
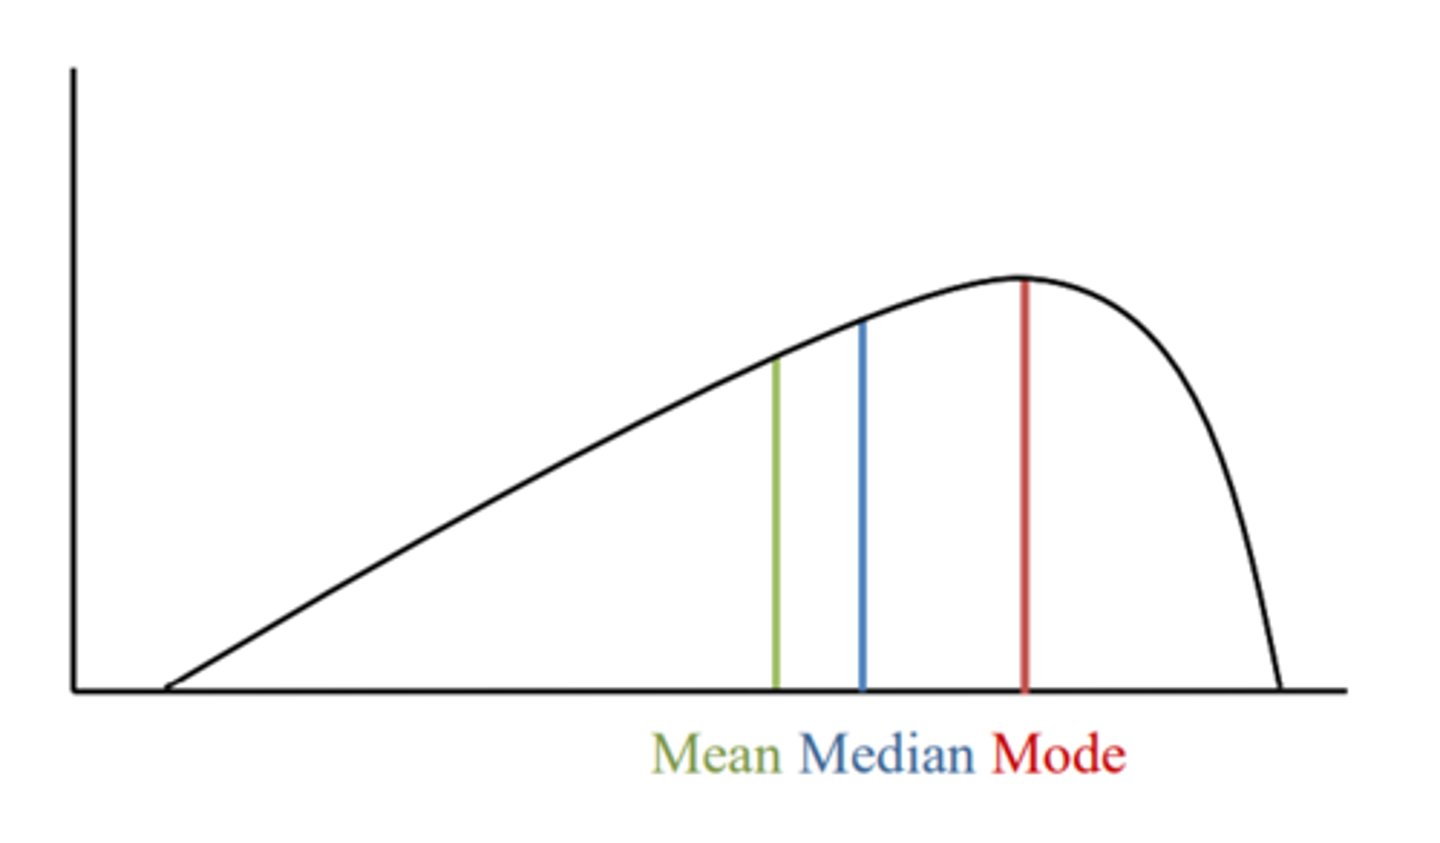
Measures of central tendency in negatively skewed data
Mean → median → mode
What are the most common measures of variability?
1) Range
2) Standard deviation = √variance
What is the range?
• Total spread in data
• Range = highest score - lowest score
What are the advantages and disadvantages of range?
• Advantages (very quick, can be used for all levels of measurement)
• Disadvantages (influenced by single extreme scores)
What is average deviation?
How much each score deviates (varies) from the mean
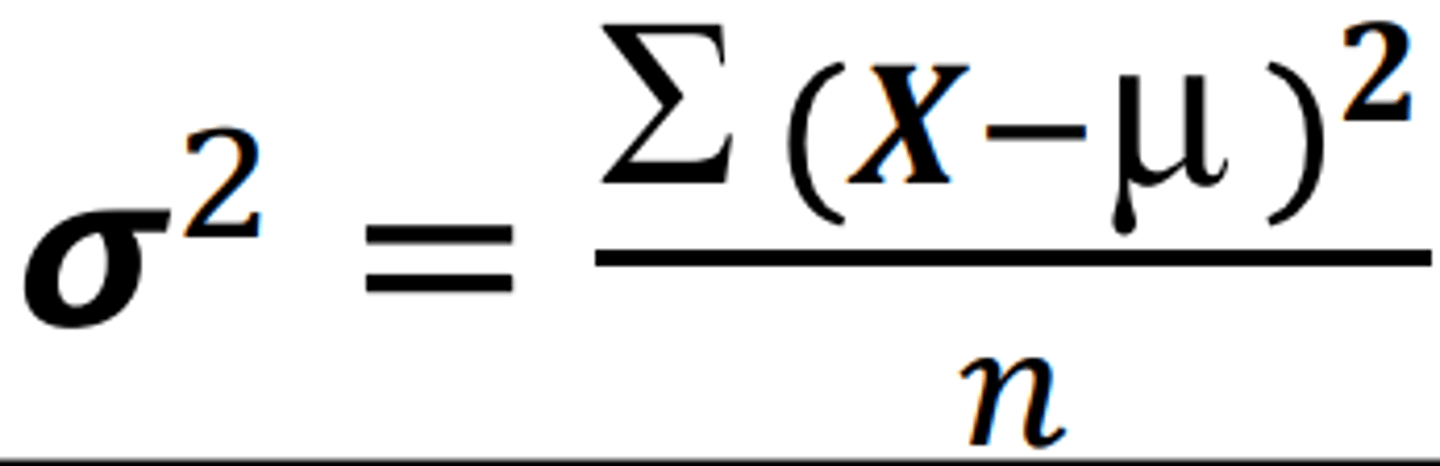
What is variance (σ2 Greek letter sigma squared)?
• The most used measure of dispersion is the variance
• When divide the sum of squares by n (statistically known as the variance)
What is the sum of squares?
• The sum of the squared deviations from the mean
• ∑(X - μ)2
• Always a positive value
What is the variance formula?
What is standard deviation?
• Measure of variability for scores about the mean
• Measure of deviations of all the scores from the mean, expressed as a single number
• Larger spread in scores → greater deviation → greater variability
• s can equal to 0 only if there is no spread (all n observations have the same value)
What percentage of datas fall within one standard deviation of the mean?
68%
What percentage of data falls within two standard deviation of the mean?
95%
What percentage of data falls within three standard deviation of the mean?
99%
What is the interpretation of the standard deviation?
Method of specifying percentage of scores falling within certain score limits around the mean
What is a quick but crude (if there is no extreme scores) estimate of the standard deviation?
SD = range/4
What are the properties of the mean?
• Uniqueness (for a given set of data there is one and only one mean)
• Simplicity (it is easy to understand and to compute (average or arithmetic mean)
• Affected by extreme values (all values enter into the computation)
What are the properties of the median?
• Uniqueness (for a given set of data there is one and only one median)
• Simplicity (it is easy to calculate)
• It is not affected by extreme values as is the mean
What are the properties of the mode?
• Sometimes it is not unique
• It may be used for describing qualitative data
• It is not affected by extreme values
How much skewing before using median instead of mean?
Rule of thumb (if mean and median differ by 1 SD or more then use median)
What are interquartile ranges (IQR)?
• Measure of variability, based on dividing a data set into quartiles
• Quartiles divide a rank-ordered data set into four equal parts
•. The values that divide each part are called the first, second, and third quartiles and they are denoted by Q1, Q2, and Q3 respectively
• Interquartile range = Q3 - Q1
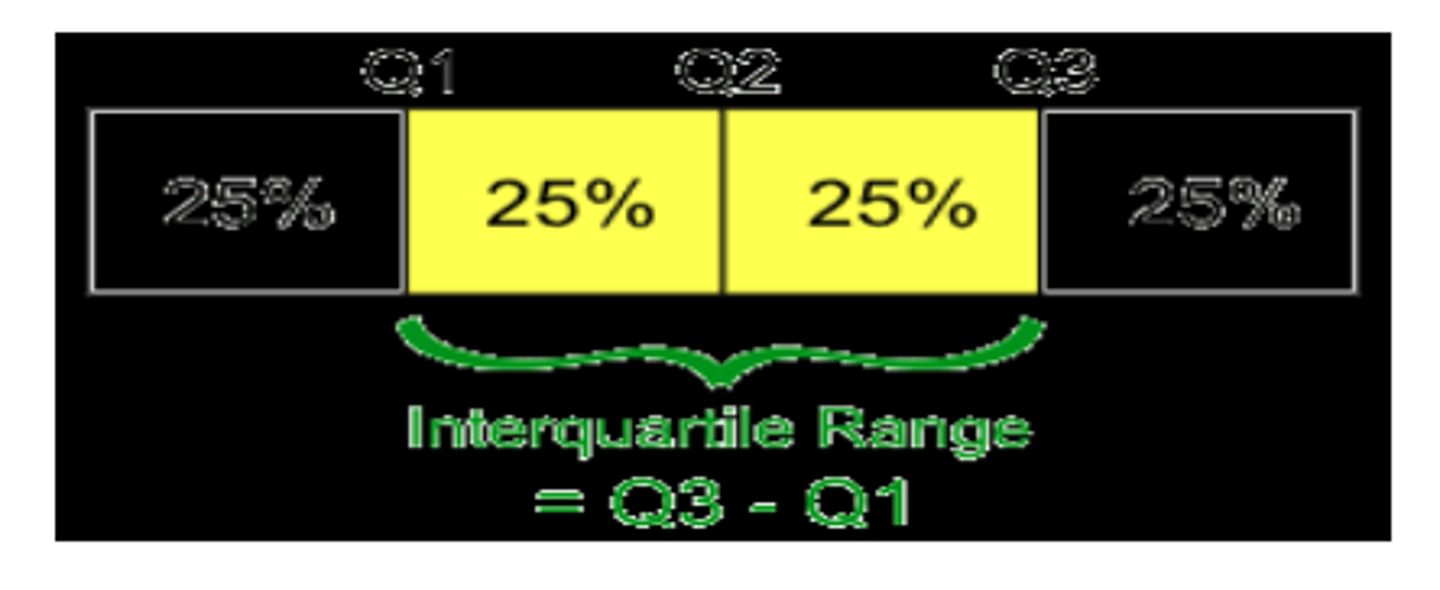
Application of quartiles
• First quartile (Q1) = 25th percentile
• Second quartile (Q2) = 50th percentile
• Third quartile (Q3) = 75th percentile
What are percentiles and z-scores?
• A method of describing the standing of an individual in relation to a group
• Achieved by translating an individual’s raw score into either percentile or z-score (transformation)
What is a percentile score?
The percentage of people in the group who have the same raw score or a lower raw score, than the one in question
How to calculate a percentile for ungrouped data?
1) Order the scores
2) Locate the scores
3) Calculate the percentile = ordinal rank of a given value/number of values in the data set x 100
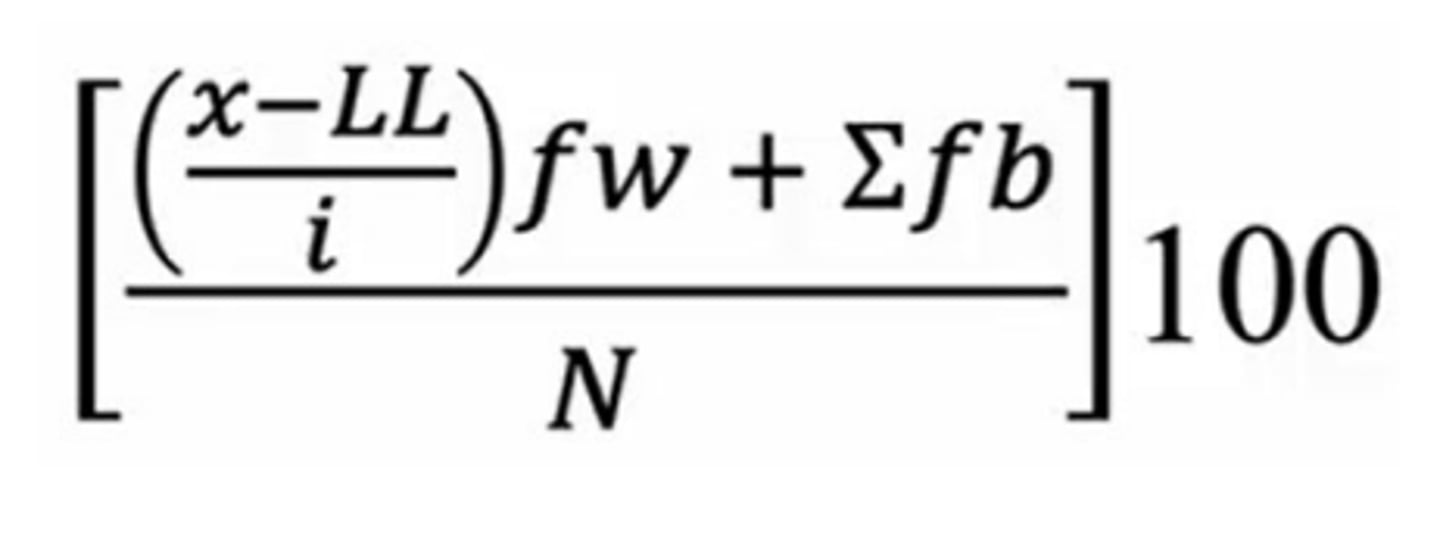
How to calculate a percentile for grouped data
• x = the score you are converting to percentile
• LL = lower limit of the class interval that contains the score
• i = the size of each class interval
• fw = the frequency of scores in the interval that contains the score
• ∑fb = sum of the scores below the interval
• N = number of scores in the data set
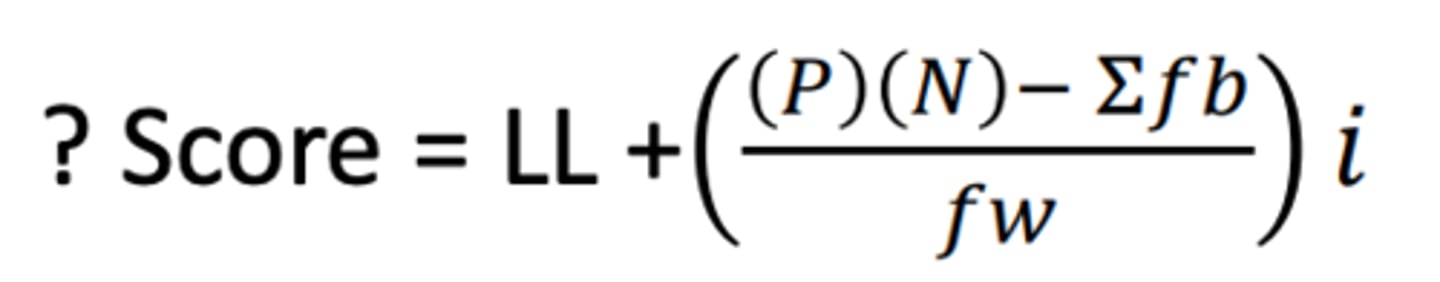
How to find a raw score of a given percentile
• P = percentile as decimal
• N = number of scores in the data set
• LL = lower limit of the class interval that contains the score
• i = the size of each class interval
• fw = the frequency of scores in the interval that contains the score
• ∑fb = sum of the scores below the interval
Connection between percentiles and z scores
1) Both are transformations form raw score to another scale
2) Both can be used to compare an individual with respect to a group