2.5 Consumer & Producer Surplus
1/24
There's no tags or description
Looks like no tags are added yet.
Name | Mastery | Learn | Test | Matching | Spaced | Call with Kai |
|---|
No analytics yet
Send a link to your students to track their progress
25 Terms
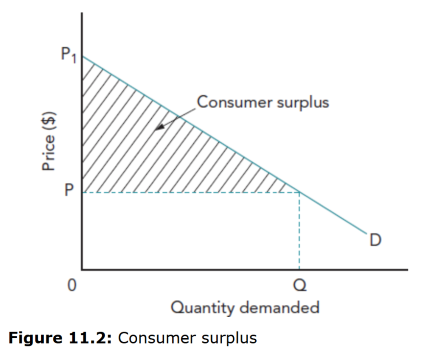
What is consumer surplus (CS)
The difference between what a consumer is willing to pay for a good and what they actually pay (its market price).
How is consumer surplus shown on a diagram
The area above the price line and below the demand curve.
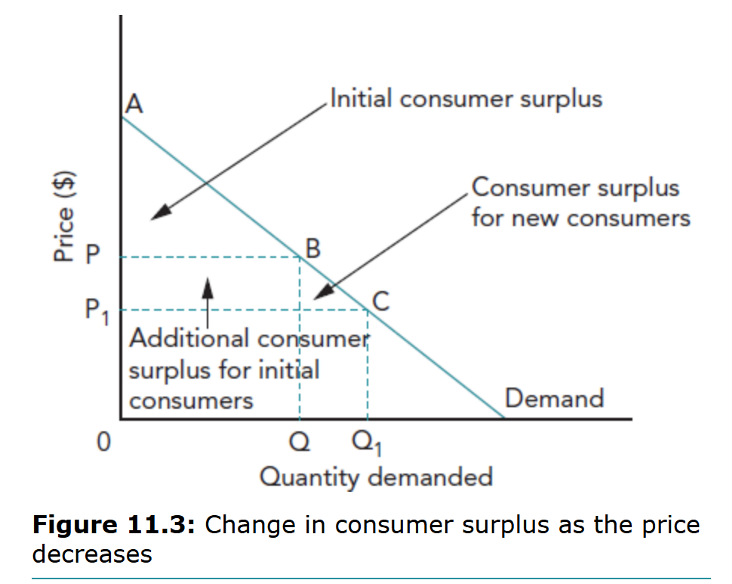
- CS decreases as price increases as less people are prepared to pay the higher prices. (vice versa if the price decreases)
Show on a diagram the effect of a price decrease on consumer surplus.
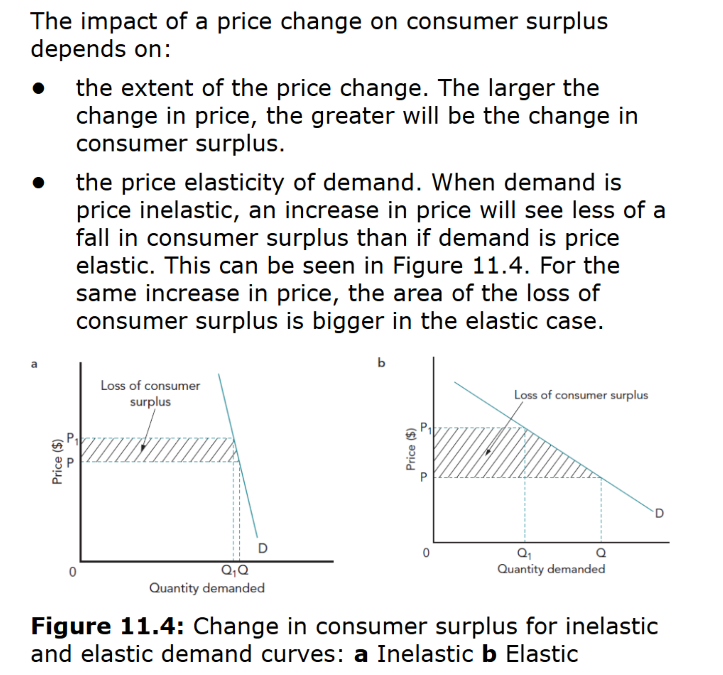
What does the impact of a price change on consumer surplus depend on (2 + diagrams)
also depends on whether the price increased or decreased
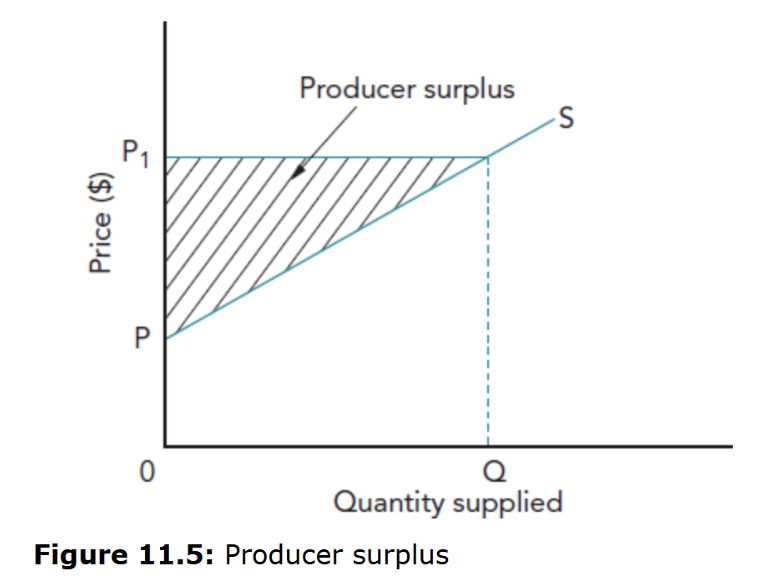
What is producer surplus (PS)
The difference between the price a producer receives and the (minimum) price they are willing to accept.
How is producer surplus shown on a diagram
The area below the price line and above the supply curve.
- Anything the firm sells below p1 is because it is willing to sell to consumers at a discounted price
- There is a price P below which the producer is unwilling to supply anything since the costs of production would not be covered
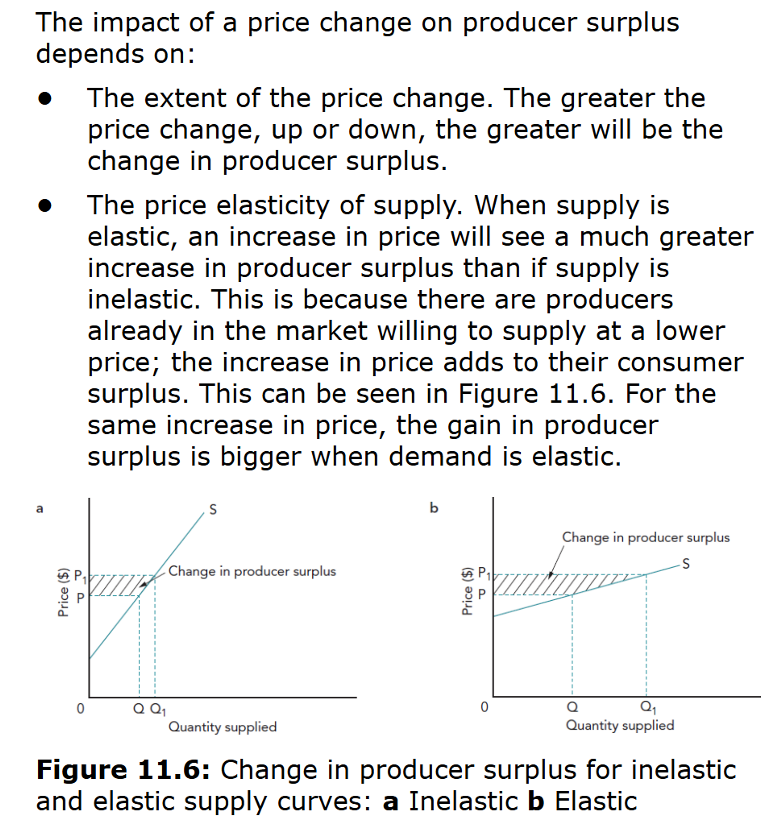
What does the impact of a price change on producer surplus depend on (2 + diagrams)
also depends on whether the price increased or decreased
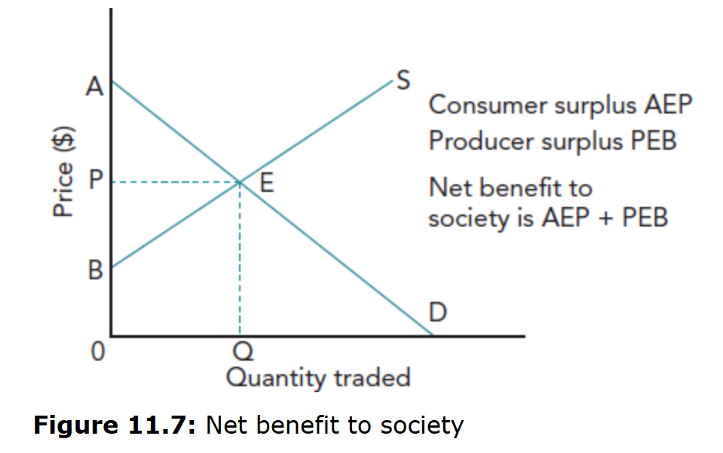
How to show on a diagram consumer and producer surplus together + what does their sum represent
Their sum represents the net benefit to society of this market's operations
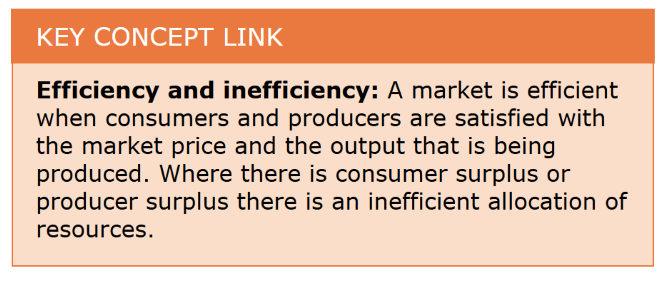
Key concept link - efficiency
What are the four causes of changes in consumer & producer surplus
Price changes
2. Shifts in demand
3. Shifts in supply
4. Government interventions (taxes & subsidies)
How does a price increase affect CS and PS
• CS falls (consumers pay more, buy less)
• PS rises (producers receive higher price per unit)
How does a price decrease affect CS and PS
• CS rises (consumers pay less, buy more)
• PS falls (producers receive less per unit)
How does an increase in demand affect CS and PS
• D shifts right → P ↑, Q ↑
• CS rises (more consumers benefit from willingness to pay)
• PS rises (producers sell more at higher price)
How does a decrease in demand affect CS and PS
• D shifts left → P ↓, Q ↓
• CS falls (fewer consumers benefit)
• PS falls (producers sell less at lower price)
How does an increase in supply affect CS and PS
• S shifts right → P ↓, Q ↑
• CS rises (cheaper, more quantity for consumers)
• PS may rise or fall depending on elasticity
How does a decrease in supply affect CS and PS
• S shifts left → P ↑, Q ↓
• CS falls (consumers pay more, fewer bought)
• PS rises (higher price per unit, fewer sold)
How does a tax affect CS and PS
• S shifts left → P consumers pay ↑, Q ↓
• CS falls (pay more, buy less)
• PS falls (receive less after tax)
• Government collects tax revenue → part of surplus transferred
How does a subsidy affect CS and PS
• S shifts right → P consumers pay ↓, Q ↑
• CS rises (pay less, buy more)
• PS rises (receive more per unit, sell more)
• Government pays subsidy cost
How does PED affect changes in consumer surplus
• Inelastic demand → Q falls slightly → CS ↓ slightly
• Elastic demand → Q falls sharply → CS ↓ greatly
How does PES affect changes in producer surplus
• Inelastic supply → Q ↑ slightly → PS ↑ slightly
• Elastic supply → Q ↑ significantly → PS ↑ significantly
What is total surplus
CS + PS → measures total welfare in the market.
How is market efficiency related to CS and PS
• Efficient market → total surplus maximised
• Deadweight loss occurs when taxes, price floors, or ceilings reduce total surplus
Give an example of real-world application of CS and PS.
• Food market: price subsidies increase CS (cheaper food) and PS (farmers sell more)
• Tax on cigarettes reduces CS (consumers pay more) and PS (producers sell less)
Why is understanding CS and PS important for government policy (3)
• Shows winners and losers of taxes/subsidies
• Helps assess market efficiency and welfare effects
• Guides policy design to maximise social welfare
✅ Key exam tips:
Always draw and label diagrams for CS and PS.
2. Show shifts in demand or supply and highlight new CS/PS areas.
3. Include elasticity effects on magnitude of changes.
4. Link to market efficiency, welfare, and government policies.
5. Use real-world examples: food, transport, tech products.