UNIT 8 bio
1/39
There's no tags or description
Looks like no tags are added yet.
Name | Mastery | Learn | Test | Matching | Spaced | Call with Kai |
|---|
No analytics yet
Send a link to your students to track their progress
40 Terms
A researcher proposes a model of an enzyme-catalyzed reaction in which a reactant is converted to a product. The model is based on the idea that the reactant passes through a transition state within the enzyme-substrate complex before the reactant is converted to the product.
Which of the following statements best helps explain how the enzyme speeds up the reaction?
The enzymes active site binds to and stabilizes the transition state, which decreases the activation energy of the reaction.
A population of 250 birds inhabit the canopy of a tropical rain forest that has a carrying capacity of 400 birds.
What is the maximum population growth rate (Ymax) if the population grows to 283 in one year?
0.35
The deep ocean floor communities contain very little life. In constant darkness, the water at these depths hovers around 2°C. Sparsely distributed in this environment are hydrothermal vent ecosystems. Superheated water streams out of the vents at temperatures approaching 400°C. These waters are rich in inorganic materials, including carbon dioxide and hydrogen sulfide. Hydrothermal vent zones have a density of organisms 10,000 to 100,000 times greater than found on the surrounding seafloor.
Scientists have studied these vents to determine the energy source for these communities and the identity of the primary producers in the perpetual darkness of the ocean floor. As expected, they found a total absence of photosynthetic organisms at all vents, identifying mats of bacteria as the producers of the carbon compounds that are used by the rest of the community for growth, repair, and as an energy source.
'hich of the following describes how the vent bacteria harvest energy to produce organic ompounds for use by the vent community?
The bacteria function as chemoautotrophs, extracting energy from hydrogen-rich inorganic molecules.
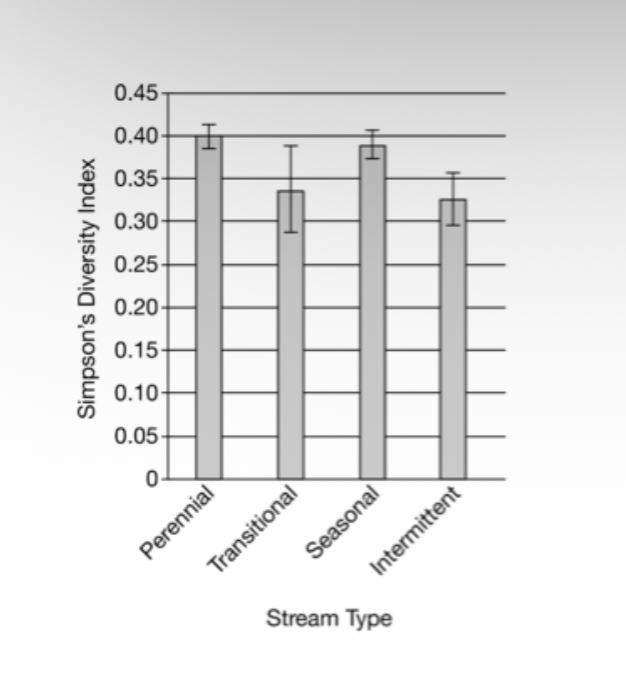
Researchers studied the diversity of macroscopic invertebrates in different areas of watershed ecosystems. They collected samples from 58 sites along 11 streams in the same geographical area. Their data were classified by stream type and can be found in Figure 1. The stream-type classifications range from the perennial stream type, which always has water, to the intermittent stream type, which is dry for more than nine months during the year.
Figure 1. Diversity of macroscopic invertebrates in different stream types. Error bars represent a 95% confidence interval (
two Standard Errors from the mean).
Which of the stream types had a statistically lower macroscopic invertebrate species diversity than the seasonal streams?
Intermittent streams only
Interactions among populations determine how they access resources within a community.
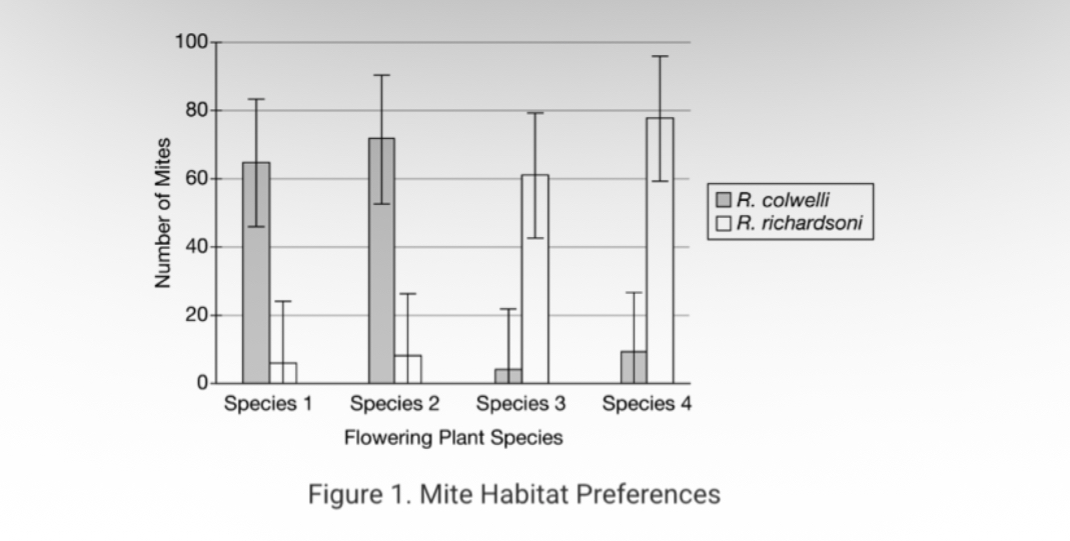
In Costa Rica, two different species of mites, Rhinoseius colwelli and Rhinoseius richardsoni, exhibit a high degree of interspecies competition. Both mite species live within the flowers of plants, and adult male mites tend to kill mites if they belong to a different species. An experiment was carried out to determine whether these aggressive interactions have resulted in niche partitioning by R. colwelli and R. richardsoni, of different flower species, with each mite species living in different plant species. The results are summarized in Figure 1.
Which of the following is an accurate interpretation of the data in Figure 1 ?
R. richardsoni is found significantly more frequently on Species 3 and Species 4 compared to Species 1 and Species 2.
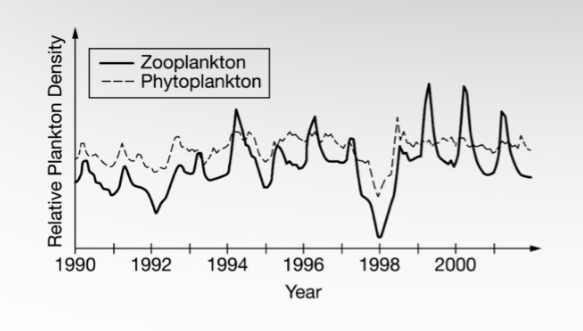
Phytoplankton (dashed line) are important because they occupy the bottom of the food web absorbing CO2, functioning as a carbon sink. A scientist suggests that an El Niño event in early 1998 caused a significant decrease in the abundance of phytoplankton that year in the equatorial Pacific Ocean.
Figure 1. Relative abundance of plankton over time in the eastern equatorial Pacific Ocean
Which of the following observations would best support this alternative hypothesis?
Previous dips in plankton abundance coincided with other El Niño events.
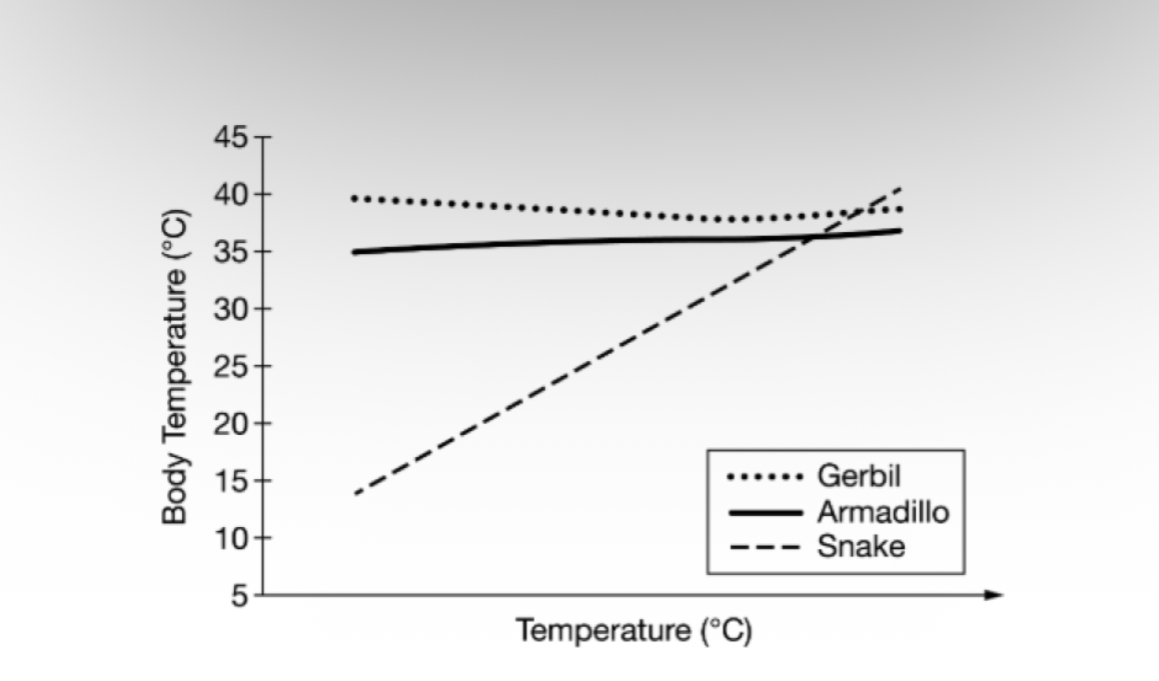
In an experiment, three different animals were exposed to a series of environmental temperatures and their body temperatures were assessed at multiple temperature points etween 10 and 40 degrees Celsius. Ten different individuals of each type of animal were included in the study to produce an average body temperature profile for each type of animal. Figure 1 shows the data collected.
Figure 1. Effect of environmental temperature on body temperature of selected animals
Which of the following statements is most consistent with the data in Figure 1 ?
Snakes display behaviors that allow them to absorb or radiate heat as required.
A fish population of 250 in a pond has a maximum annual rate of increase of 0.8.
If the carrying capacity of the pond is 1,500 for this species, what is the expected population size after one year?
417
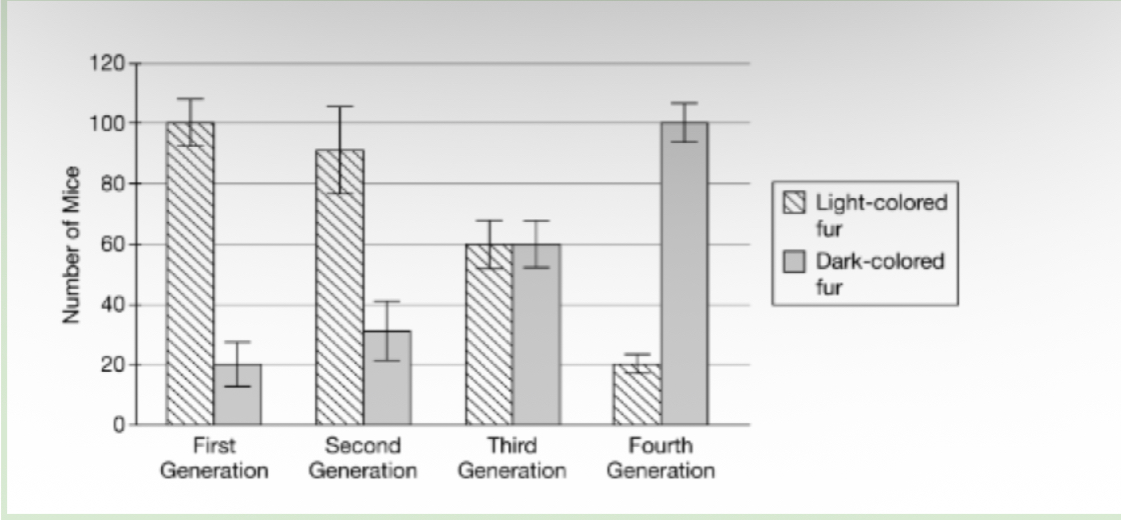
Fur color is a genetically controlled trait in mice. A population of a species of mouse that typically lives in habitats with light-colored soil was studied for several generations. The background color of the habitat of this population became darker after the second generation due to human activity. A researcher sampled approximately 120 mice in each generation and recorded the fur color phenotypes as shown in Figure 1.
The researcher claims that there is no selective advantage to fur color, so light and dark fur color phenotypes are present in similar frequencies in the fourth generation of this mouse population. Based on the data in Figure 1, which of the following best evaluates this null hypothesis?
The null hypothesis is rejected, because the change to a darker background color led to an increase in the dark-colored fur phenotype.
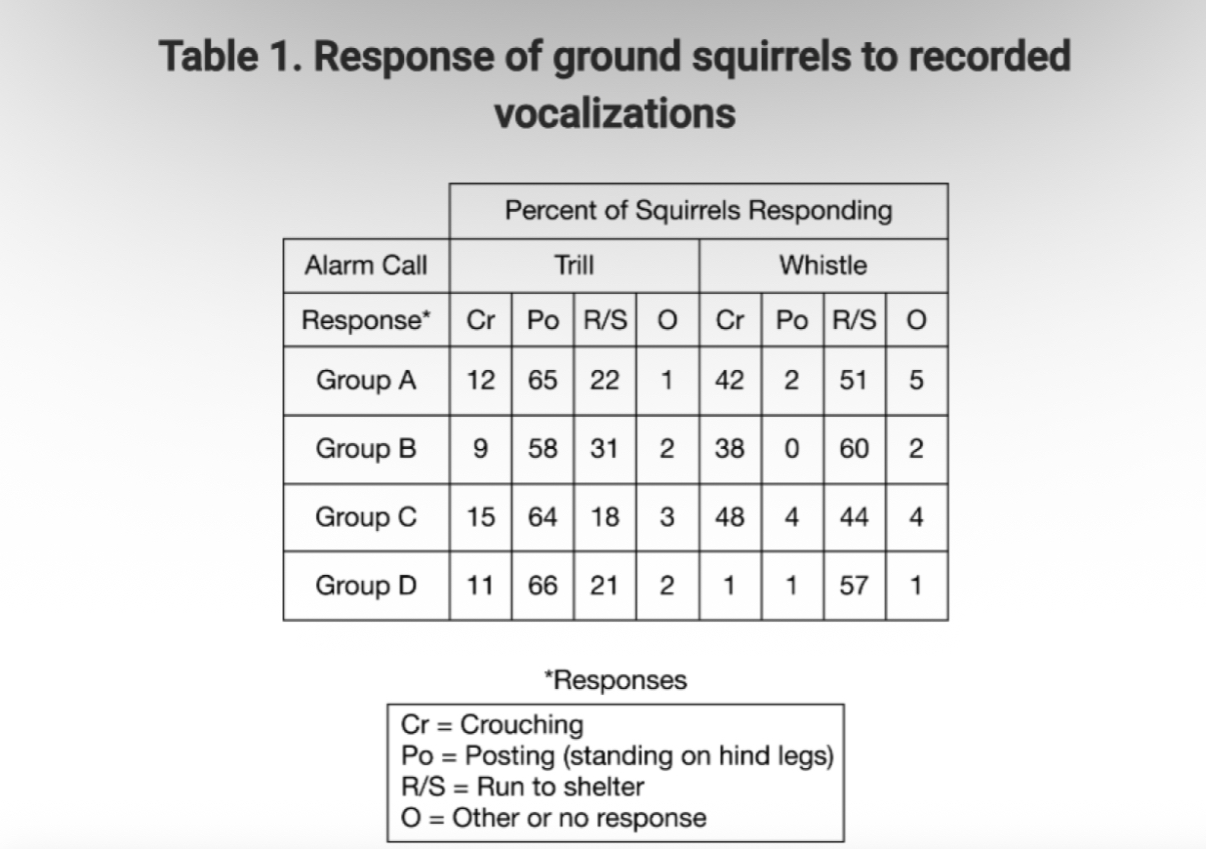
Scientists are studying the two primary vocalizations made by Belding's ground squirrels (Urocitellus beldingi). The trill call consists of a series of medium-pitched notes given rapidly, while the whistle call consists of a single high-pitched note. The objective of the experiment is to determine the function of each vocalization. Recordings of the calls were played to four different groups of squirrels, and the response of each individual squirrel was documented. The responses are summarized in Table 1.
Which of the following correctly identifies the dependent variable and the independent variable for the experiment?
The independent variable is the type of alarm, and the dependent variable is the percent of squirrels responding.
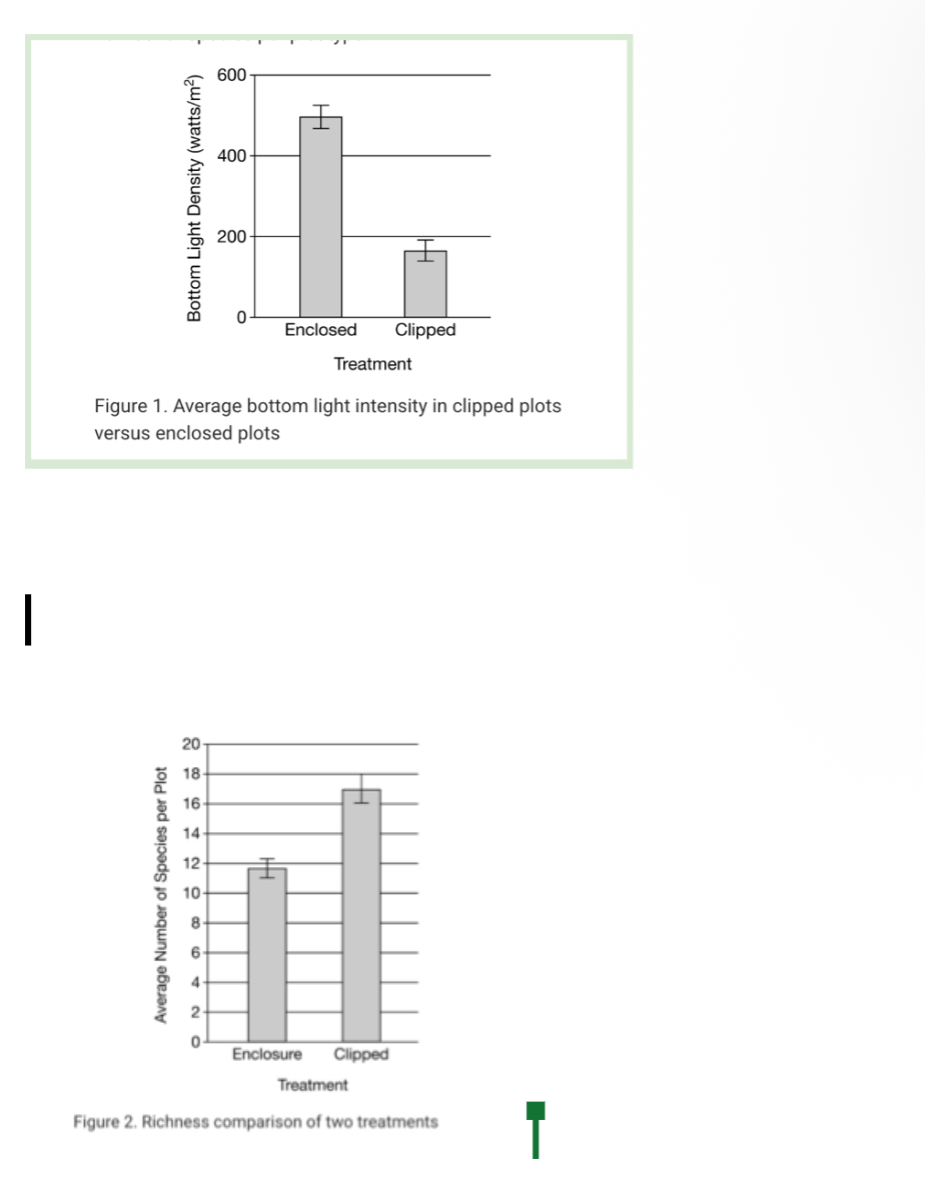
In an experiment to determine the effect of light availability on species richness in an environment, a grassland was divided into 26 plots that were assigned to one of two treatment groups:
Clipped - plots were mowed to simulate the grazing of herbivores that maintain the low height of grasses.
Enclosure - plots were enclosed in fences, and grasses were allowed to grow undisturbed to their maximum height.
After eight years, data was collected on the amount of light penetration to the soil (bottom light density) and the number of species in the two treatment groups.
Figure 1 shows the averaged light penetration measurements, and Figure 2 shows the averaged number of species per plot type.
Which of the following statements is consistent with the data shown in the figures?
Different patterns of energy availability in ecosystems will affect species richness.
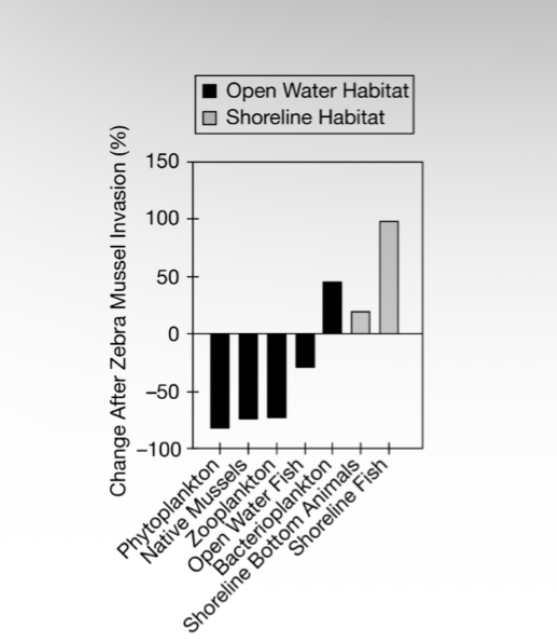
Zebra mussels are an invasive species that has become widely established throughout the United States.
Figure 1 shows the percent change in the population sizes of selected groups of organisms in the Hudson River since the introduction of zebra mussels. In this study chlorophyll-containing bacteria are considered phytoplankton and all other bacteria are considered bacterioplankton.
Figure 1. Change in biomass of selected Hudson River organisms after the introduction of zebra mussels
Which of the following hypotheses about the effect of zebra mussels on the Hudson River community is best supported by the data in Figure 1 ?
The reduction in primary productivity has resulted in an unstable community that will eventually collapse.
Researchers were studying species diversity in a savanna rangeland community in southwest Queensland, Australia. Researchers counted the numbers of plants species in four different categories at two nearby sites within the savanna rangeland; one lightly grazed by herbivores and one heavily grazed by herbivores (Figure 1).
Which of the following best predicts the results of a drought in the savanna research area with regards to community resilience to this environmental change?
The lightly grazed area is likely to recover more quickly from the drought due to greater biodiversity.
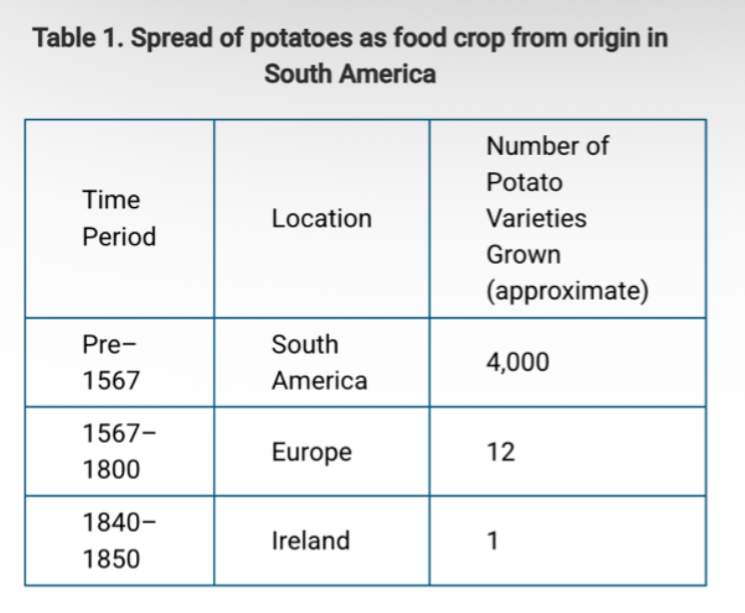
Potatoes as a food crop originated in South America.
There are over 4,000 variations of potato grown there.
Potatoes were brought to Europe by Spanish colonists in the late 1500s. One variety became the chief crop grown in much of Ireland by the early 1800s. Table 1 summarizes the spread of potatoes as a food crop.
The Irish Lumper variety of potato was introduced into Ireland in the early 1800s. The Lumper soon became the only variety of potato grown in much of Ireland. The potato blight destroyed most of the Lumper crop between 1845 and 1852 resulting in the death of about 1 million Irish from starvation.
A researcher suggests that the Irish monoculture (growing a single crop) of the Lumper potato did not significantly change the overall resistance of the potato crop in Ireland to diseases. Which of the following observations best refutes this null hypothesis?
The number of fatalities from the Irish potato famine was greater than the rest of the European countries combined.
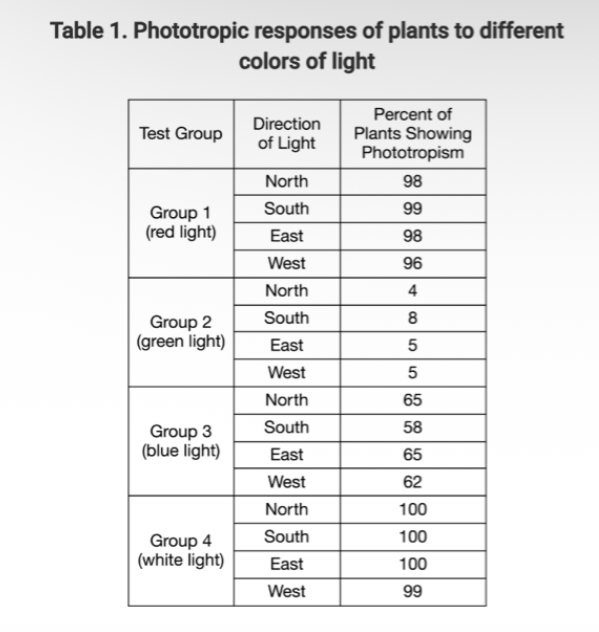
A group of biologists were investigating the effects of light color on phototropism (growing toward the light source) in tomato plants. Four groups of tomato plants were grown in the same greenhouse under identical conditions. Each group was then placed in a different room, each room having a different color of light, exposed to that single color of light from different directions for one week at a time. After each week, the biologists counted the number of tomato plants in the groups that were showing evidence of phototropism.
The results are summarized in Table 1.
Which of the following correctly identifies the dependent and independent variables in this experiment?
The percentage of plants showing phototropism is the dependent variable, and the color of the light is the independent variable.
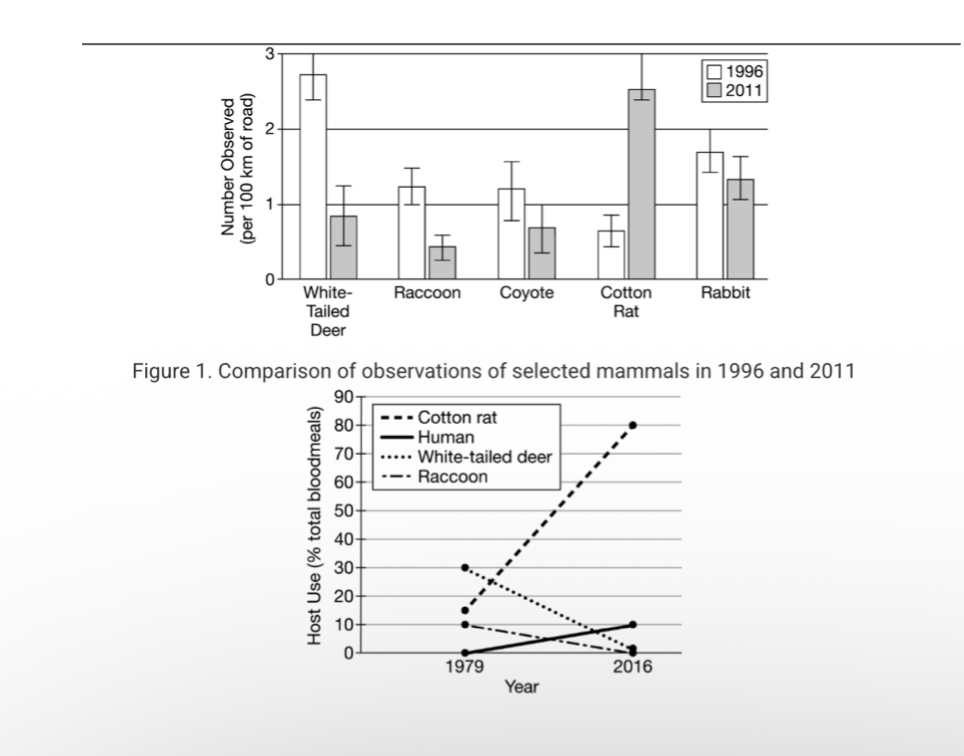
In the Florida Everglades, Burmese pythons are an invasive species. They were introduced into southern Florida in 1992. These pythons feed on many of the native Florida species, establishing the pythons as the top predator in the environment. By the year 2000, their population had increased dramatically.
Figures 1 and 2 display data collected by ecologists studying the results of the Burmese python invasion. Figure 1 shows counts of animals collected from nighttime road surveys in southern Florida, which are used to estimate population size. Figure 2 shows data collected from mosquitoes captured from the wild. DNA sequencing was used to identify the species of blood that the mosquitoes had in their stomachs, identifying various hosts used by the mosquitoes.
Year Figure 2. Change in host preference by Culex cedecei between 1979 and 2016. Numbers do not add up to one hundred percent because these represent a subset of all the host species. humans. In 1996, the native Culex cedecei mosquitoes in southern Florida preferentially took blood meals from white-tailed deer and raccoons. It was predicted that changes in host population size would alter these host preferences. Additionally, it is known that cotton rats are often infected by the Everglades virus, which normally exists in animals, but is capable of infecting humans. Ecologists predict that increased feeding on cotton rats by C. cedecei may significantly increase the tendency of this virus to infect
Which of the following most accurately explains an impact of Burmese pythons on the Everglades
Python predation has caused a trophic cascade that changed the mosquitoes' niche.
Which of the following populations have significantly decreased in size between 1996 and 2011 ?
Introduction of a new top predator species that preys solely on Burmese pythons would cause an increase in the raccoon population.
Based on the data, which of the following most accurately matches a potential change with its predicted effects on the southern Florida ecosystem?
Introduction of a new top predator species that preys solely on Burmese pythons would cause an increase in the raccoon population.
Scientists hypothesize that the invasive Burmese pythons are responsible for recent increases in human Everglades virus infections. Evaluate this alternate hypothesis using the data provided.
The alternate hypothesis is supported because the invasive Burmese pythons caused mosquitoes to switch to feeding on cotton rats. This means that mosquitoes are more likely to carry the Everglades virus when they bite humans.
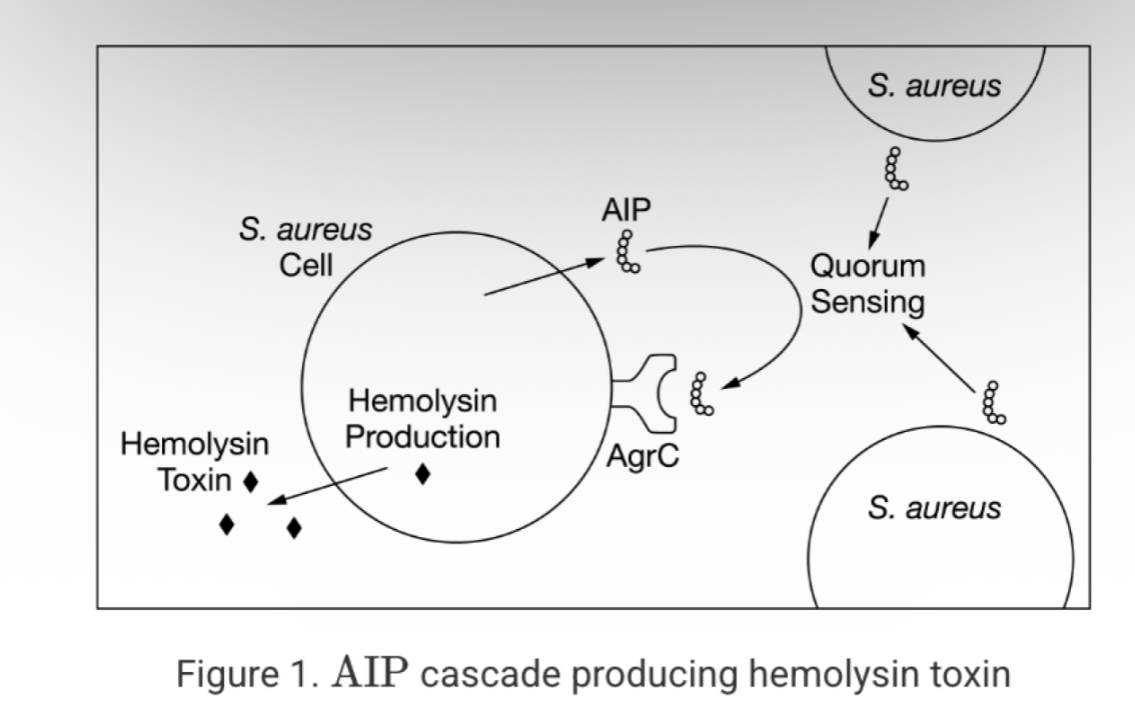
Quorum sensing is a form of cell-to-cell communication used by some bacterial species to regulate their behavior and population size. Staphylococcus aureus uses quorum sensing to activate its virulence genes once its population reaches a minimum size. Virulence refers to the ability of a pathogen to cause disease.
S. aureus secretes autoinducing peptide (AIP), which binds to the AgrC receptor on the bacterial cell membrane. When the S. aureus population is sufficiently large and produces enough AlP, this concentration activates AgrC and stimulates a signal cascade resulting in the production of hemolysin, a toxin used to attack the host organism. In order to lessen the impact of the toxin produced by an S. aureus infection on patients, scientists created AIP mimics intended to act as competitive inhibitors of AIP - AgrC binding at the cell surface.
Identify the experimental design that would determine which AIP mimic would most effectively inhibit the production of hemolysin toxin.
Grow S. aureus in separate culture media containing one AIP mimic each and measure the production of hemolysin toxin. The most effective AIP mimic will be in the culture producing the lowest amount of hemolysin.
The population of Japanese sika deer in central Japan was determined each year from 2005 to 2014. The sika deer population underwent logistic growth starting at 26,000 deer in
2005 and stabilized at 58,000 deer between 2012 and 2014. Based on these data, the Imax for this population was determined to be 0.57. Central Japan contains a variety of habitats, including forests and grasslands. Sika deer benefit from the resources in grasslands more than forests; if deforestation occurred, producing more grasslands in the region, the carrying capacity for sika deer population would increase.
What would the population size of sika deer be one year after the carrying capacity increased to 70,000 as a result of deforestation? Assume Imax does not change.
The population would grow to 63,667 deer in a year, and the growth rate would decrease the following year.
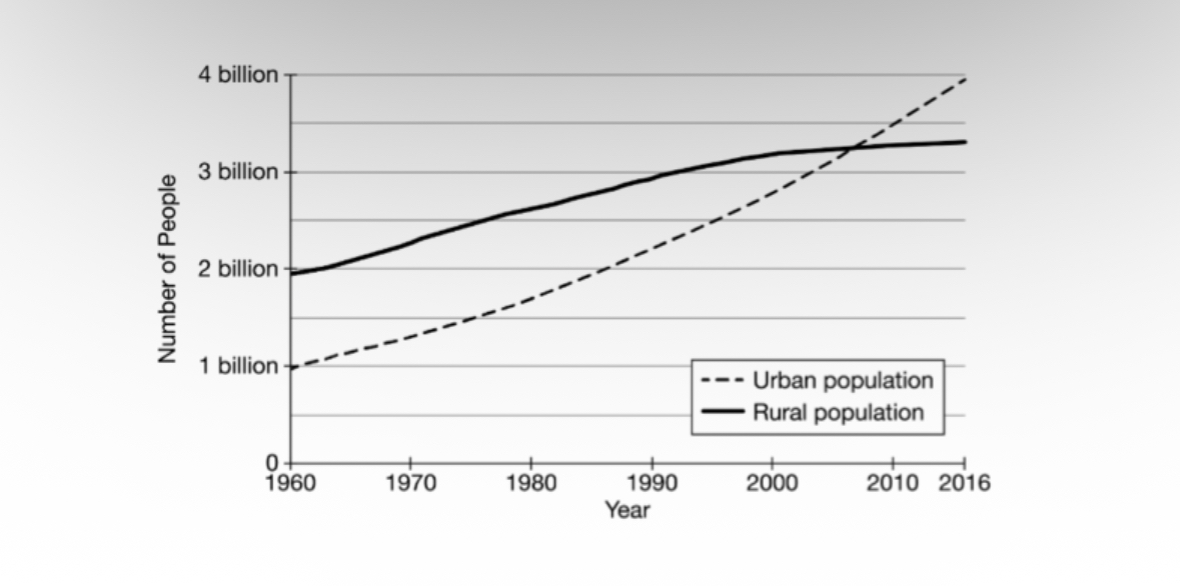
Figure 1 shows the changing pattern of human population sizes in rural and urban areas from 1960 to 2016 with regard to the global population.
A scientist interested in investigating how human population trends might affect local animal species' richness stipulates a null hypothesis that animal biodiversity in rural areas will be unaffected in the future by the human population trends shown in Figure 1. Which of the following would best refute this null hypothesis?
Urbanization causes habitat fragmentation
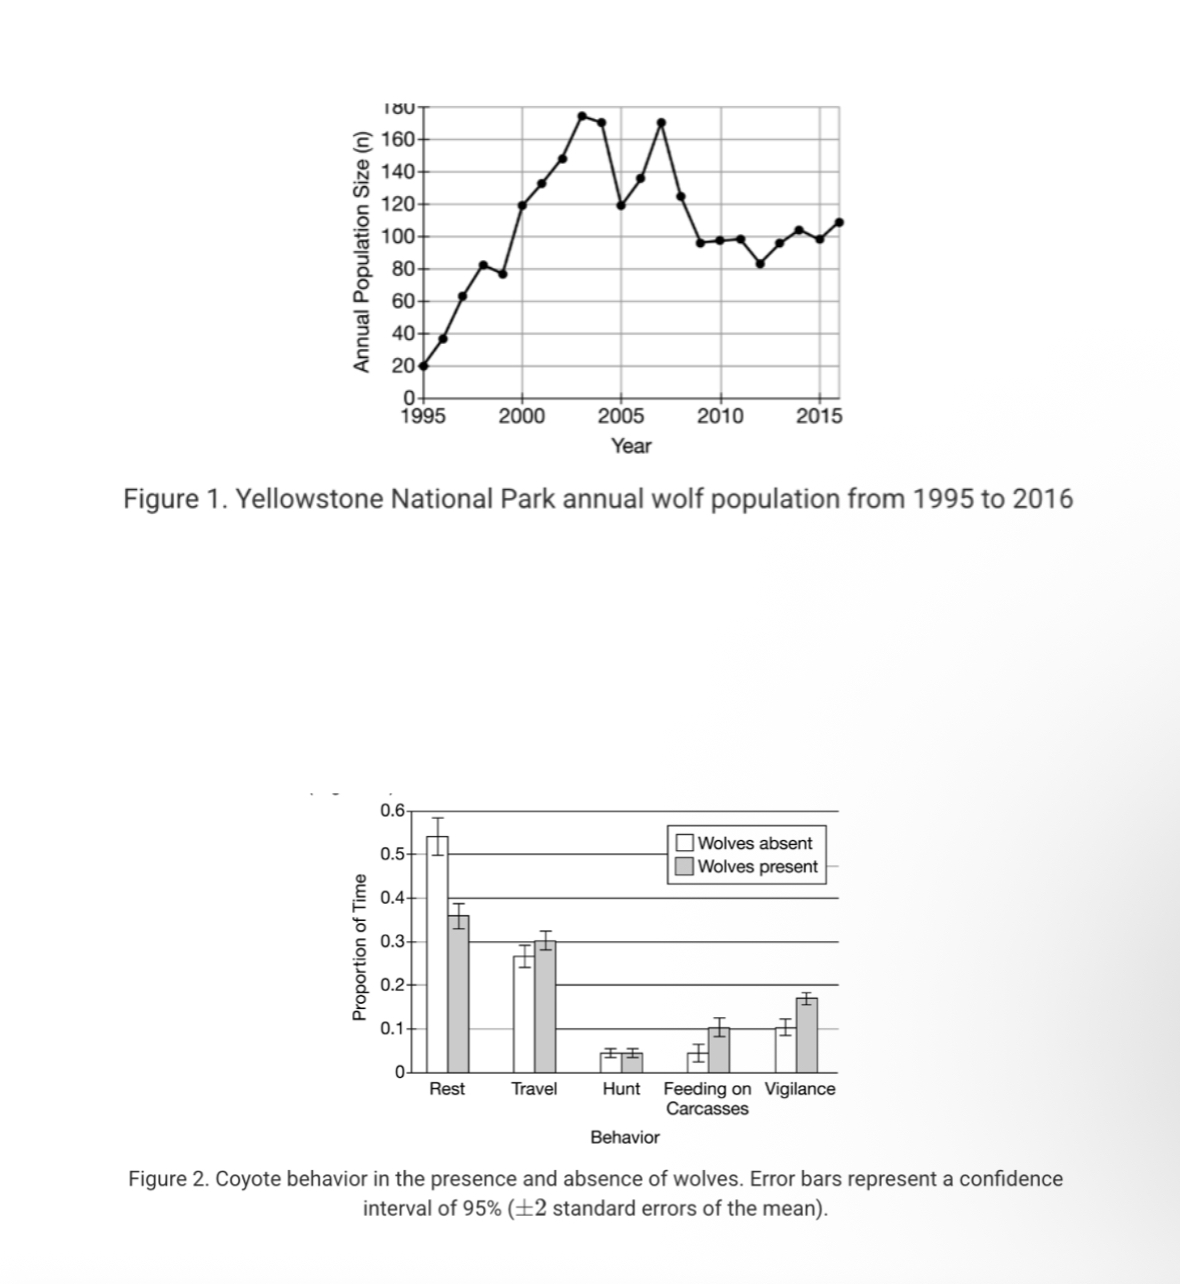
In the mid-1920s, gray wolves, Canis lupus, were eliminated from Yellowstone National Park in the northwestern United States. Over the course of 1995 and 1996, 31 wolves from Canada were relocated to the park. Researchers have tracked the growth of the wolf population from 21 in 1995 to 108 at the end of the study in 2016 (Figure 1)
Tyure t. renowolonle mauonatr aln almluat wull populatutthutloolocuro
The wolves prey on large herbivores, primarily elk. The carcasses of wolf kills are a valuable food source for coyotes, Canis latrans. When coyotes are feeding on carcasses, they may be chased off the carcass and/or killed by wolves. Coyotes also hunt small mammals for food.
Researchers were studying the effect of wolves' presence on the behavior of coyotes. Researchers observed coyotes in a specific area of Yellowstone National Park and recorded the proportion of the coyotes' time spent on five different activities when wolves were present in the study area and when wolves were absent (Figure 2).
Based on information in Figure 1, which of the following is closest to the annual growth rate of the wolf population in Yellowstone National Park from 1996 to 2004?
17 wolves per year
Based on the data in the figure, a student claimed that since 2007, the carrying capacity of wolves in Yellowstone National Park has been 100 wolves, and the maximum annual per capita growth rate of gray wolves is 0.6 wolves per wolf per year.
Which of the following is closest to the calculated wolf population size in 2017 based on the student's claim?
103
Identify the independent variable for the experimental results shown in Figure 2
The presence of wolves
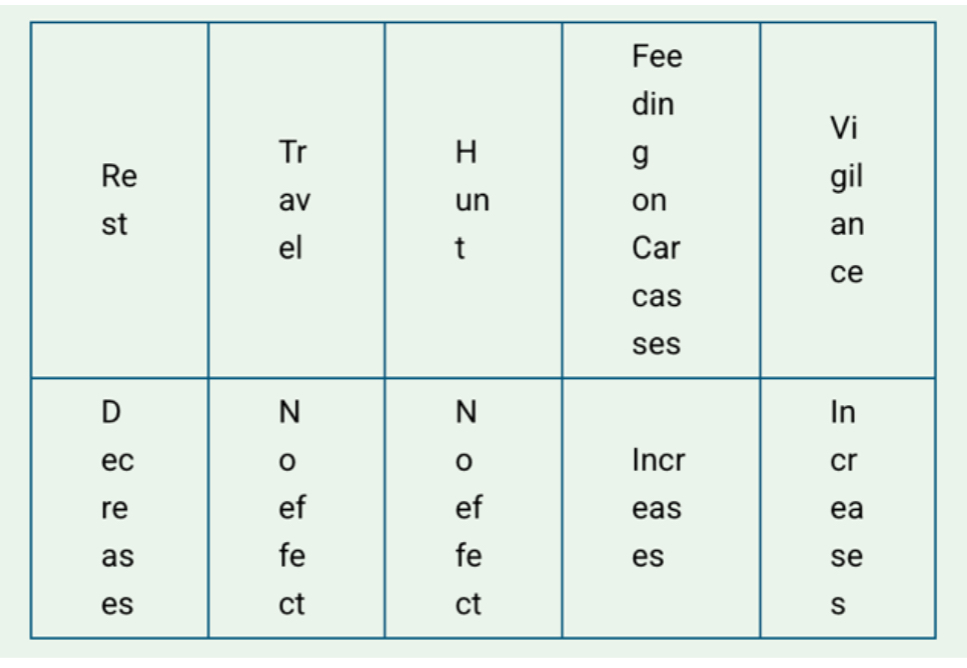
Which of the following best describes the change in coyote behavior in the presence of wolves?
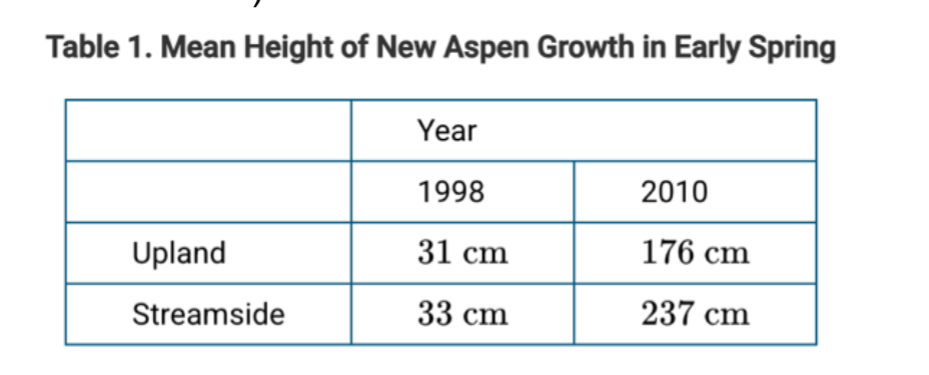
Following the reintroduction of wolves to Yellowstone National Park, researchers measured the mean height of young aspen trees in upland and streamside areas.(add question above)
Which of the following is the most likely cause of the change in mean aspen height from 1998 to 2010 ?
The reintroduction of wolves led to a decrease in the population of elk, allowing aspen trees to grow taller.
Meerkats live together in groups to help raise and protect their offspring. Meerkat pups are most vulnerable when they are away from their burrow foraging for food. Adult eerkats exhibit sentinel behavior, standing upright and making alarm calls to warn other embers in the group that predators are nearby.
In a study of meerkat behaviors, scientists observed meerkat foraging groups and recorded the presence or absence of pups along with the frequency of adult sentinel behavior. The scientists determined that sentinel behavior increased when pups were present in the foraging group.
Which of the following correctly identifies the dependent and independent variables in the described study?
The presence of pups is the independent variable, and the frequency of sentinel behavior is the dependent variable.
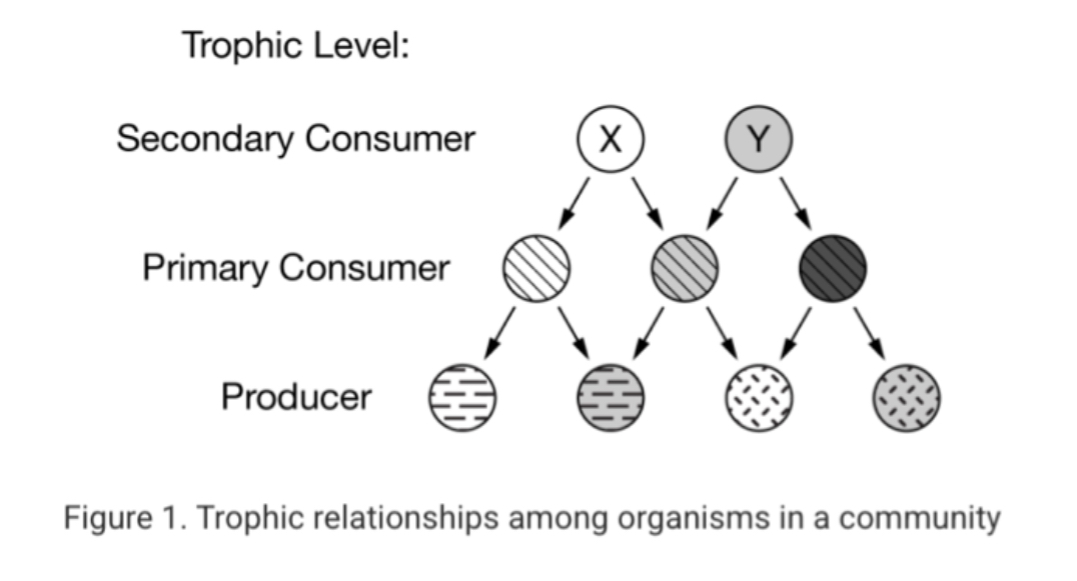
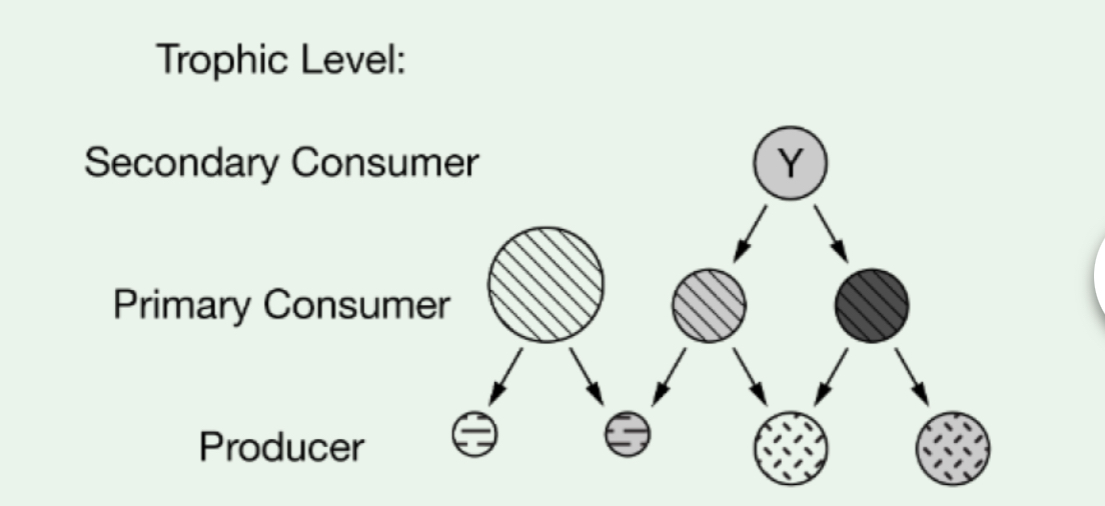
Figure 1 shows a food web that describes the relationships within a community containing nine species. Each circle represents a separate species. The size of the circle represents the population size of the species relative to other species in the same trophic level.
aBased on the information in Figure 1, which of the following best predicts a short-term effect of removing secondary consumer X from the community?
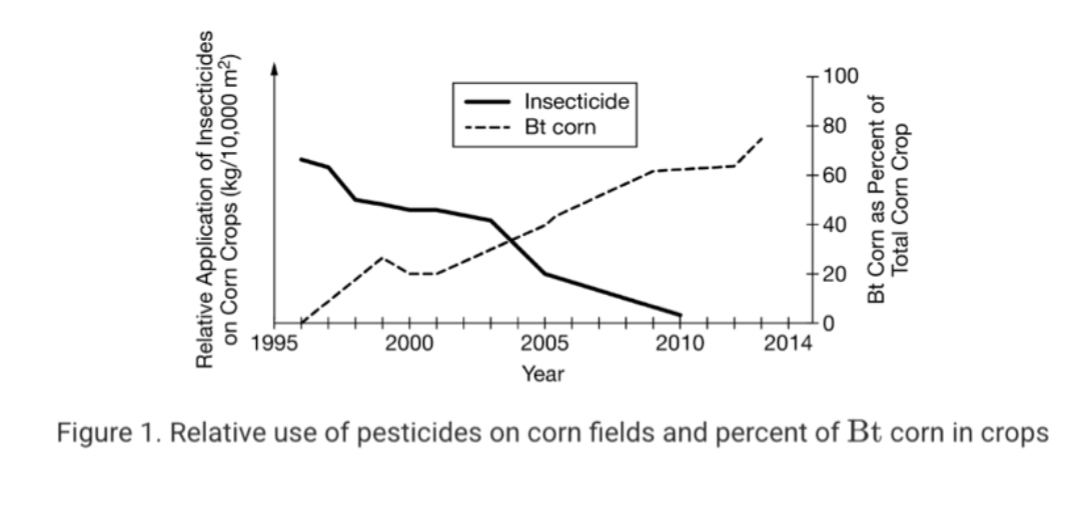
Bt corn varieties are genetically modified to produce a toxin that specifically kills corn borers, a type of insect that eats and damages corn crops. Insects that are not closely related to corn borers are not affected by the toxin. Figure 1 shows the increasing production of Bt corn varieties and the change in the use of broad-spectrum pesticides that were the primary means of killing corn borers before the invention of Bt corn.
How do the data in Figure 1 support the alternative hypothesis that increased use of Bt corn reduces the impact of corn farming on the natural environment?
The toxin in Bt corn kills only the corn pests, leaving other insects unharmed.
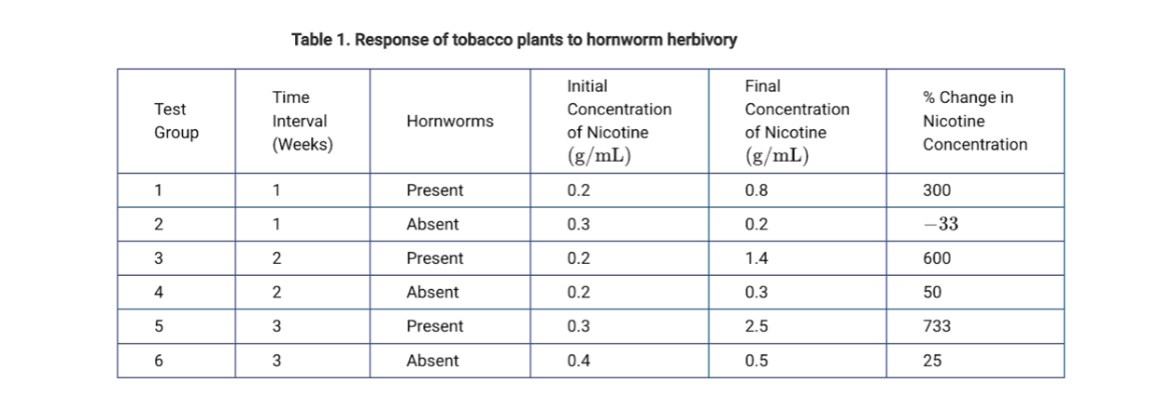
A biologist was investigating the effects of herbivory on the amount of nicotine produced by the leaves of tobacco plants (Nicotiana rustica). Six groups of plants were grown from seed in the same greenhouse with identical environmental conditions. Three groups were then each exposed for a different interval of time to tobacco hornworms (Maduca sexta), which feed on the foliage of tobacco plants. The amount of nicotine present in the leaves was measured at the beginning and end of each time interval. As a control, the other three groups were not exposed to hornworms. The results of the experiment are summarized in
Table 1.
Which of the following correctly identifies the dependent variable and the independent variable for the experiment?
The dependent variable is the percent change in the amount of nicotine, and the independent variable is the time interval the plants were exposed to the hornworms.
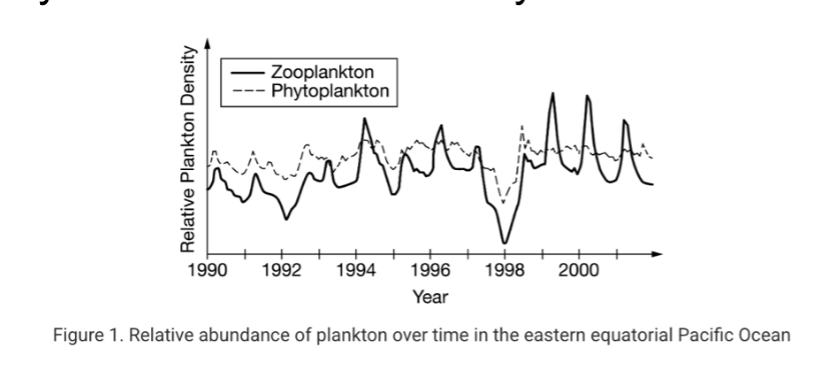
Figure 1 shows the population fluctuations of phytoplankton and zooplankton in the eastern Pacific Ocean over the course of six years. The major dip in phytoplankton was attributed to a lack of nutrients for phytoplankton.
Of the following, which explains why the zooplankton also dipped during the same year and then seemed to cycle over the next three years?
The reduction in the phytoplankton population meant that the zooplankton's energy source was drastically reduced, leading to the decrease in the zooplankton population size. After the dip, the phytoplankton provided a steady energy source, and the zooplankton population fluctuated around its carrying capacity.
Bison in Yellowstone National Park have a food-limited carrying capacity that determines how their population grows. If the population grows too large, some bison will either starve or migrate to search for more food. The park is able to support a maximum population of 4,500 bison. Park conservation officials must watch the population and prevent the bison from overpopulating, since they would migrate to nearby farms, causing agricultural damage and creating hazards to drivers. The bison begin to migrate when the population reaches 4,000 because of competition for food.
If the current population size of bison is 3,652 and the maximum growth rate of the population is 0.28, calculate the population size after one year and determine whether the park will need to take measures to control the population.
The population will be 3,845 after a year. The bison will not pose a problem until the following year, and no conservation action will need to take place.
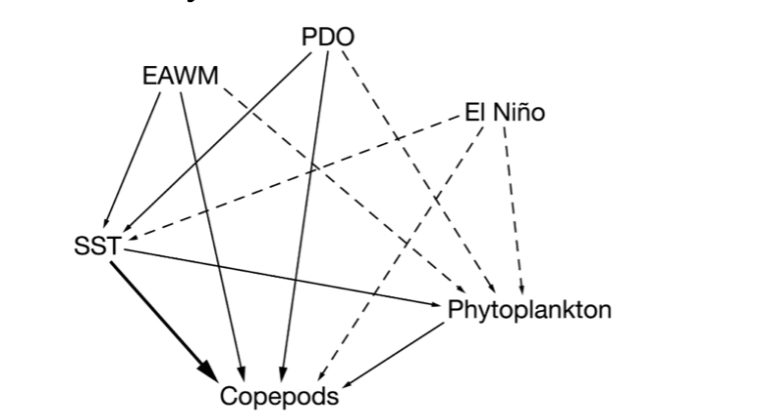
Climate change can affect oceanic ecosystems and their food webs. In the East China Sea (ECS), three major climactic events were considered:
the Pacific Decadal Oscillation (PDO),
the East Asia winter monsoon (EA WM), and
the El Niño Southern Oscillation.
Figure 1 shows the relationships among these climactic events, surface sea temperature (SST), amount of phytoplankton, and copepod abundance. Copepods are important primary consumers in this ecosystem, and many species of fish depend on copepods as a food source. Solid arrows on the diagram indicate a statistical effect. The thicker the arrow, the greater the effect. Dashed arrows indicate statistically insignificant relationships.
Figure 1. Structural equation model deciphering interactions among climate, phytoplankton, and copepods in the southern East China Sea. Solid arrows indicate statistical effects, with the thickness of the arrow reflecting the relative effect. Dashed arrows indicate inconsequential effects.
What do the data in Figure 1 suggest about a null hypothesis that the East China Sea ecosystem is unaffected by climactic events?
The null hypothesis is rejected since there are statistical effects of EAWM and PDO on surface sea temperature and copepod abundance.
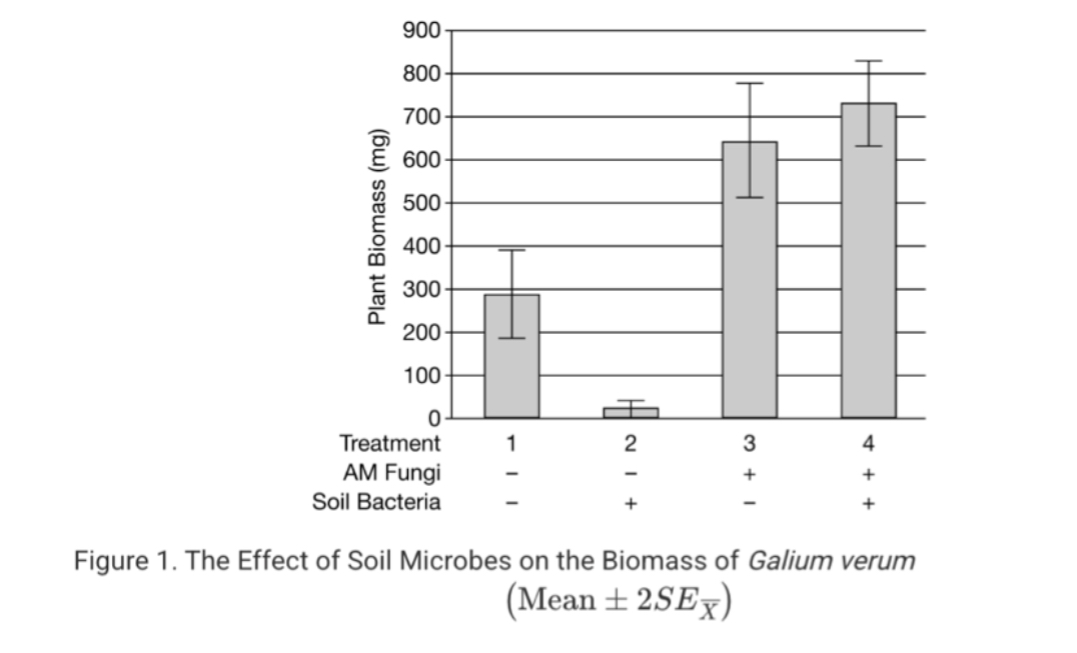
Researchers were studying the effects of microbes on the growth of the yellow bedstraw plant, Galium verum. They grew yellow bedstraw plants under four treatments: in the presence of soil bacteria only, arbuscular mycorrhizal (AM) fungi only, both bacteria and AM fungi, or neither. After 6 months, they measured the biomass of the plants (Figure 1).
Which of the following best describes a statistical relationship indicated in Figure 1?
Yellow bedstraw plants grow significantly more in the presence of both soil bacteria and AM fungi (treatment 4) than in the presence of soil bacteria alone (treatment 2).
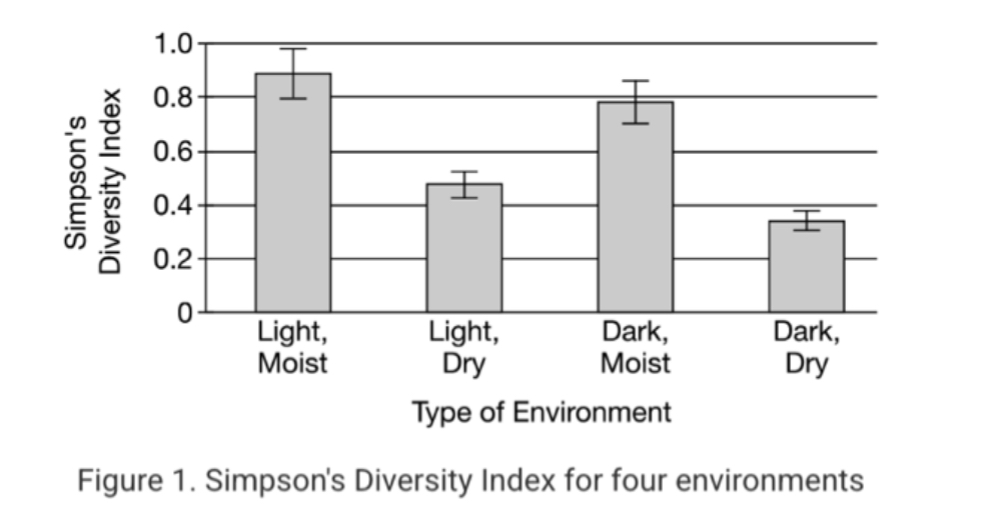
Students in a class were divided into five groups to analyze community structure. Each group of students assessed the species of plants in four environments and determined the Simpson's Diversity Index for each environment. The Simpson's Diversity Index takes into account the number of species present as well as the abundance of each species. The index values are shown in Figure 1.
Based on the data in Figure 1, which of the following statements is most accurate about the species diversity of the four different environments that the students analyzed?
Based on the data, there is no statistical difference between the species diversity of plants in the light, moist environment and in the dark, moist environment.
. In a study of energy flow, the following data were collected:
Each human requires 55 grams of protein per day.
An acre of soybeans produces 200,000 grams of protein per year.
A cow grazing on one acre of land produces 19,000 grams of protein per year.
Based on these data, an acre of land would support:
• 10 humans per year on a diet of soy, or
• 0.9 human per year on a diet of beef
Which of the following statements best explains these relationships in terms of energy transfer?
Only 10% of the energy on each level of the trophic pyramid is available for use by the next level. The rest is lost as heat or used for growth and repair.
The marine iguana, Amblyrhynchus cristatus, is endemic to the Galápagos Islands and is especially vulnerable to El Niño events. These iguanas feed on red and green algae. During an El Niño climate event, surface waters and their currents in the central and eastern Pacific Ocean become significantly warmer than usual. Also during El Niño years, land masses experience increased rainfall.
A researcher suggests that El Niño conditions cause a significant decrease in the size of the Galápagos marine iguana population. Which of the following would best support this alternative hypothesis?
Warm surface water contains fewer nutrients needed by red and green algae than cooler surface waters does.
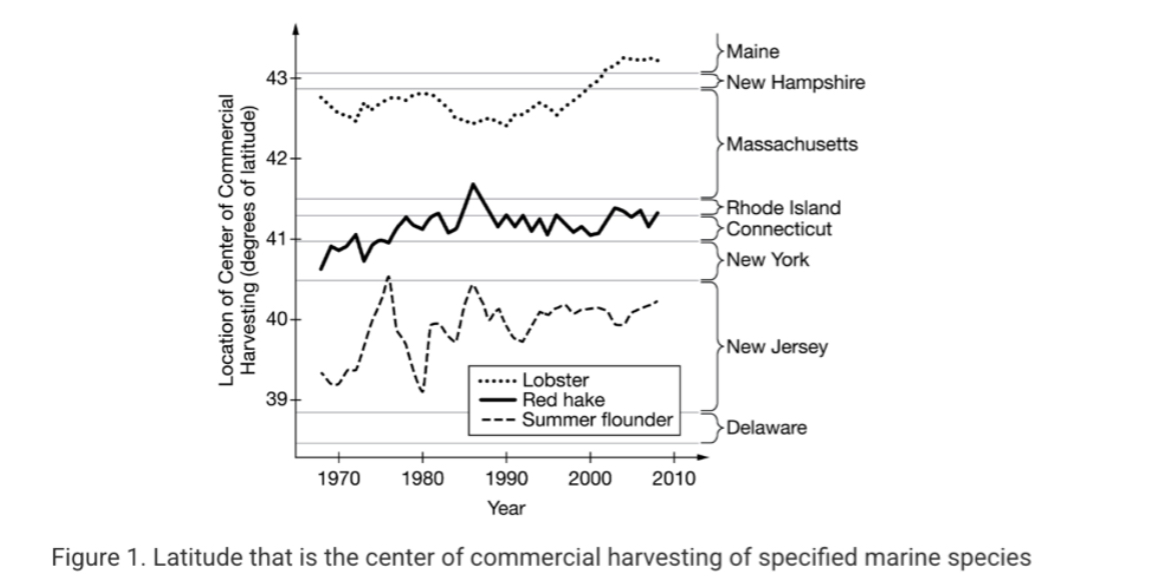
A study recorded changes in the distribution of some commercial marine species off the East Coast of the United States over a period of several decades. The results of the study are summarized in Figure 1.
Some researchers link changes in the distribution of these species to warming of the oceans due to climate change. Which of the following pieces of data best supports this alternative hypothesis?
The prey of these species require colder waters to survive, and owing to warming in the oceans, they are moving farther north, to higher latitudes, where the water is colder.
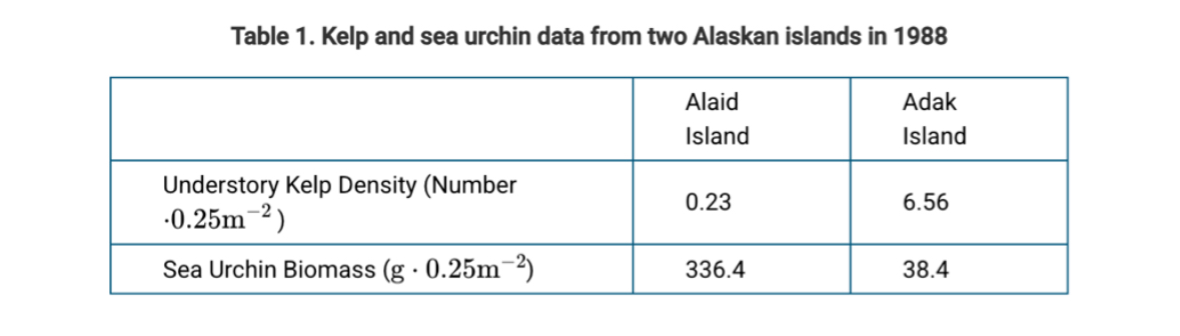
Sea otters living along the Pacific coast were hunted to near extinction in the nineteenth century. After being protected from hunting in the early 1900s, a remnant population of otters near Adak Island, Alaska, recovered rapidly. Otters did not return to the environmentally similar nearby island, Alaid Island. Sea otters eat sea urchins, which eat kelp, a brown alga. Researchers surveyed both islands in 1988, to measure sea urchin biomass and kelp density. The data are presented in Table 1.
In 1991, researchers at Adak Island observed the first attack by a killer whale on a sea otter in historical times. The researchers hypothesized that the population sizes of the larger marine mammals that the killer whales normally prey on declined, so the killer whales were starting to prey on different prey, including the smaller sea otters.
Which of the following best predicts the effects of an increase in killer whale predation on sea otters on the Adak Island ecosystem?
The sea urchin population will increase and the kelp population will decrease, leading to reduced total biomass and diversity in the Adak Island ecosystem.