data analysis l7/8
1/67
There's no tags or description
Looks like no tags are added yet.
Name | Mastery | Learn | Test | Matching | Spaced | Call with Kai |
|---|
No analytics yet
Send a link to your students to track their progress
68 Terms
What are the assumptions of a general linear model (in order of importance)?
Random sampling; independence of data; homogeneity of variances; normality.
Which assumptions relate to study design?
Random sampling and independence.
Which assumptions relate to the data?
Homogeneity of variances and normality.
What is pseudo-replication?
Non-independent data treated as independent.
Why is pseudo-replication a problem?
It makes statistical results invalid.
What should you do if assumptions are violated?
1) Assess if the violation is serious, 2) Try transforming the data, 3) Consider a different test.
What is homogeneity of variance?
Variances are equal across groups or along a covariate.
What happens if variances are unequal?
Increases risk of Type I errors (false positives).
How does heterogeneity of variance affect p-values?
It often decreases p-values, increasing false positives.
When is heterogeneity of variance most serious?
When one variance is much larger, when variance changes systematically with fitted values, and when sample sizes differ between groups.
When is heterogeneity of variance less serious?
When differences are random or when results are clearly non-significant.
What is normality in GLMs?
Residuals are normally distributed.
Are violations of normality usually serious?
No, unless the violation is very large.
When is lack of normality most serious?
When residuals are clearly non-normal (e.g. bimodal).
When is lack of normality least concerning?
When p-values are very small or very large.
What are residuals used for?
To assess model assumptions (variance and normality).
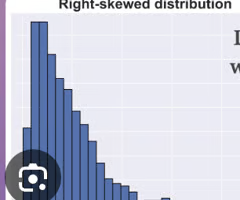
What is a log transformation used for?
Right-skewed data or when variance increases with the mean.
What type of data suits log transformation?
Large counts, ratios, skewed data.
What issue occurs with log transformation and zero values?
log(0) is undefined.
How is the log transformation adjusted for zeros?
Use log(x + 1).
Do log10 and natural log differ in effect?
No, they have identical effects (log10 is more interpretable).
What is the arcsin transformation used for?
Proportion or percentage data.
When is arcsin transformation especially important?
When values are near 0 or 1.
What is the arcsin transformation formula?
arcsin(√p).
What is the square root transformation used for?
Count data, especially small counts.
Give examples of square root transformations
√x, √(x + 0.5), √(x + 3/8).
How do you know if a transformation worked?
Check residual plots to see if assumptions improve.
When should you check assumptions?
Before interpreting results (p-values and effect sizes).
Data are right-skewed or variance increases with mean. What transformation?
Log transformation.
Data are proportions (0-1), especially near 0 or 1. What transformation?
Arcsin transformation.
Data are counts (especially small values). What transformation?
Square root transformation.
What must you always check after transforming data?
Check residuals to see if assumptions improved.
What is the goal of transformation?
To meet model assumptions (not to improve p-values).
What does a residuals vs fitted plot show?
Whether variance is constant (homogeneity of variance).
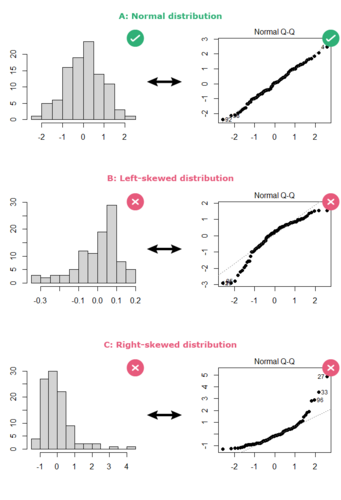
What does a Q-Q plot show?
Whether residuals are normally distributed.
What does a histogram of residuals show?
The distribution of residuals (normality).
What does a funnel shape in a residuals vs fitted plot indicate?
Heterogeneity of variance (unequal variance).
What is a factor in a GLM?
A categorical variable representing a type of manipulation (e.g. drug).
What are levels of a factor?
The different categories within a factor (e.g. Drug A, B, C).
What is a 2-factor GLM used for?
To analyse the effects of two factors and their interaction on a response variable.
What is a fully crossed design?
All combinations of levels from both factors are present.
What is a main effect?
The effect of one factor averaged across levels of the other factor.
What is an interaction?
When the effect of one factor depends on the level of another factor.
What does a significant interaction mean?
The effect of one factor changes depending on the other factor.
If there is a significant interaction, can main effects be interpreted separately?
No.
What visual pattern indicates no interaction?
Parallel lines.
What visual pattern indicates an interaction?
Non-parallel lines.
What visual pattern indicates a strong interaction?
Crossing lines (crossover).
What are the three questions a 2-factor ANOVA can answer?
Does factor 1 matter? Does factor 2 matter? Is there an interaction?
Why is a 2-factor GLM better than multiple 1-factor tests?
It reduces Type I error and allows testing interactions.
What assumption becomes more difficult in 2-factor GLMs?
Independence of measurements.
Why is pseudo-replication especially tricky in 2-factor designs?
Because non-independence can occur across factors.
What must be true to model an interaction?
There must be replication for each combination of factor levels.
What is replication in a 2-factor design?
More than one observation per combination of factor levels.
What happens if there is no replication?
You cannot estimate an interaction.
When should you include an interaction in a model?
When the research question involves interaction or data suggest it.
What should you do if an interaction is significant?
Interpret the interaction, not the main effects.
What do parallel lines in an interaction plot mean?
No interaction.
What do non-parallel lines mean?
Interaction present.
What do crossing lines mean?
Strong (crossover) interaction.
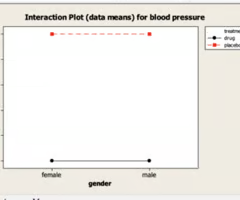
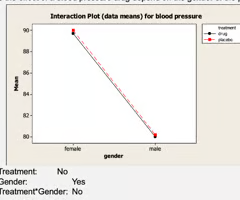
Scenario 1: Does the effect of a blood pressure drug depend on gender?
Placebo mean > Drug mean → treatment effect; Female = Male averages → no gender effect; Drug effect same for both genders → no interaction.
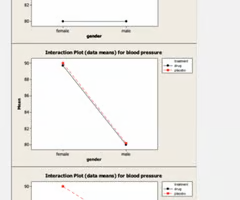
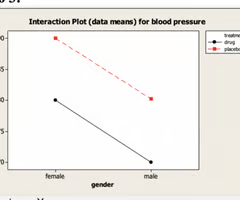
Scenario 2: Does the effect of a blood pressure drug depend on gender?
No difference between placebo and drug → no treatment effect; Females higher than males → gender effect; Treatment effect same across genders → no interaction.
Scenario 3
Placebo > Drug → treatment effect; Females > Males → gender effect; Size of treatment effect same in both → no interaction; both factors have independent effects.
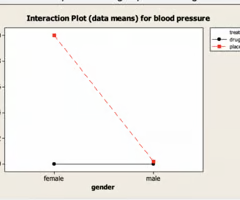
Scenario 4
Treatment lowers value overall → treatment effect; Females > Males → gender effect; Drug effect much larger in females → interaction.
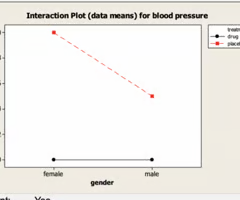
Scenario 5
Treatment affects both sexes but unequally → interaction; both main effects present.
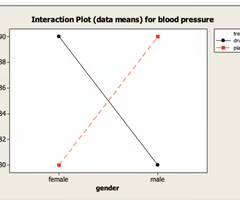
Scenario 6
Average values identical → no main effects; effect reverses between sexes → crossover interaction.
Why can visual inspection of interactions be misleading?
Because of uncertainty (error bars).
How should interactions be confirmed?
Using statistical tests (p-values and effect sizes).