Ecology Exam 3
1/72
There's no tags or description
Looks like no tags are added yet.
Name | Mastery | Learn | Test | Matching | Spaced | Call with Kai |
|---|
No analytics yet
Send a link to your students to track their progress
73 Terms
Introduced, exotic, nonnative species
Species that are introduced to a region of the world where they have not historically existed.
Naturalized
When introduced species become a part of the native community
Invasive species
Introduced species that spread rapidly and negatively affect other species
Mesopredators
Relatively small carnivores that consume herbivores (coyotes, weasels, feral cats)
Top predators
Predators that typically consume both herbivores and predators (mountain lions, wolves, sharks)
How have humans impacted the range expansion of mesopredators?
We have reduced top predators, which has allowed for more mesopredators to expand their ranges
Two species will coexist if
Intra-specific competition is stronger than inter-specific competition
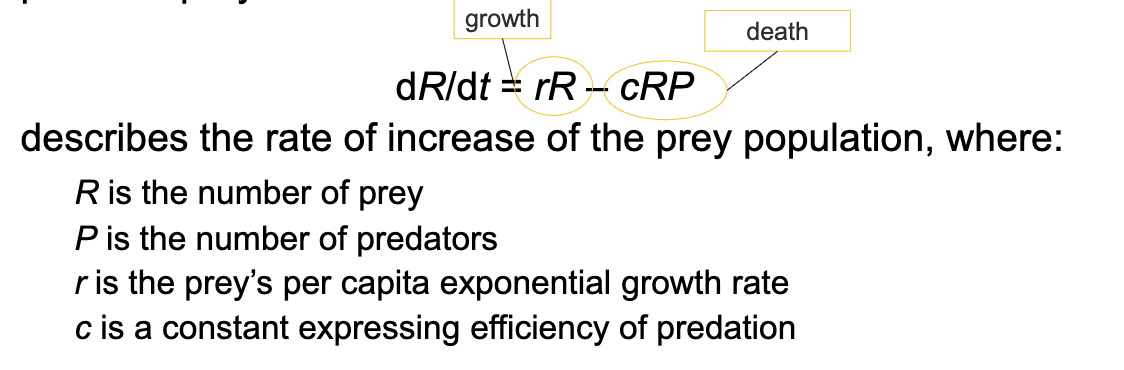
Lotka-Volterra equation
Functional response
The relationship between the density of prey and an individual predator’s rate of food consumption
Type I functional response
As prey density increases, predators consume a constant proportion of prey until satiated
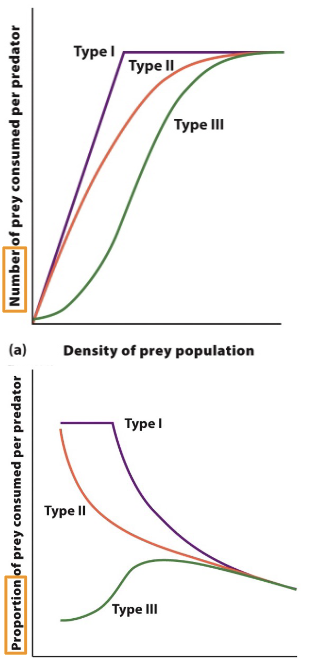
Type II functional response
Any increase in prey density is associated with a slowing rate of prey consumption. Often due to prey handling times

Type III functional response
Predator exhibits varying prey consumption depending on prey densities, often associated with prey refuges, search image, and prey switching
Active hunting strategy
Predators spend most of their time moving looking around for prey
Ambush (sit-and-wait) strategy
Predators lie in wait for a prey to pass by
Behavioral defenses of predation:
Alarm calling
Spatial avoidance
Reduction of activity
Crypsis
Camouflage that either allows an individual to match its environment or breaks up the outline of an individual (katydids)
Structural defenses
Reduce a predator’s ability to capture, attack, or handle prey (porcupine)
Chemical defenses
Using chemicals to produce a corrosive liquid or bad smell (bombardier beetle or skunk)
Warning coloration
Aposematism (away from danger)
Batesian mimicry
When palatable species evolve warning coloration that resembles unpalatable species
Müllerian mimicry
When several unpalatable species evolve a similar pattern of warning coloration
Behavioral defenses are often costly because the result in
Reduced feeding activity
Mechanical defenses are often
Energetically expensive to produce
Defense costs can reduce
Growth, development, and reproduction
Coevolution
When two or more species affect each other’s evolution; selection for prey defenses should favor the selection for counter-adaptation in predators
What is a model?
An abstraction of reality
What is the competitive exclusion principle?
Two species with identical niches cannot coexist indefinitely
Natural selection
A change in the frequency of genes in a population through differential survival and reproduction of individuals that possess certain phenotypes
Niche differentiation
When different species use different parts of the environment
Environmental diseases
Toxins, cancers, environmental shortages
Infectious diseases
Directly transmissible, two population systems
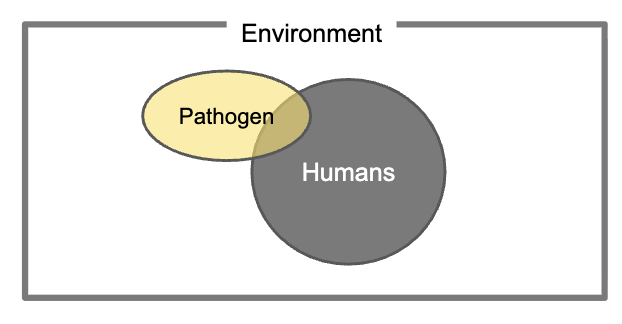
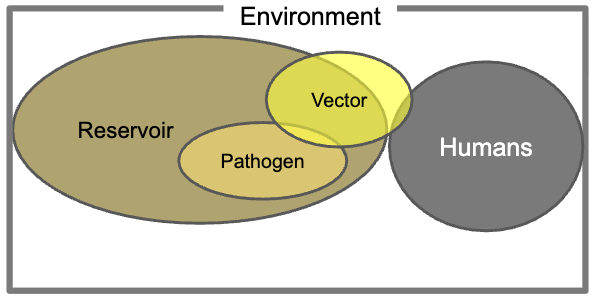
Zoonoses
The pathogen primarily resides in a second species (reservoir) and is transmitted to humans without an intermediary species (rabies, schistosomiasis)
Vector-borne/zoonoses
Infectious agents transmitted to organisms of one species through action of another species
Prion
An abnormal, transmissible agent that can induce folding of normal cellular prion proteins in the brain (rapidly progressive and always lethal)
Deemography
The study of populations
Growth rate
In a population, the number of new individuals that are produced per unit of time minus the number of individuals that die
Intrinsic growth rate r
The highest possible per capita growth rate for a population
Exponential growth model
A model of growth in which the population increases continuously at an exponential rate
J-shaped curve
The shape of exponential growth when graphed
Geometric growth model
A model of population that compares population sizes at regular time intervals
Doubling time
The time required for the population to double in size
Density independent limitations
Factors that limit population size regardless of the population’s density
Density dependent
Factors that affect population size in relation to the population’s density
Negative density dependence
When the rate of population growth decreases as population density increases
Self-thinning curve
A graphical relationship that shows how decreases in population density over time lead to increases in the size of each individual in the population, often has a slope of -3/2
Positive density dependence
When the rate of population growth increases as population density increases
Carrying capacity (K)
The maximum population size that can be supported by the environment
Logistic growth model
A growth model that describes slowing growth of populations at high densities
S-shaped curve
The shape of the curve when a population is graphed over time using the logistic growth model
Inflection point
The point on a sigmoidal growth curve at which the population has its highest growth rate, the largest derivative, or steepest slope
Life tables
Tables that contain class specific survival and fecundity data
Cohort life table
A life table that follows a group of individuals born at the same time from birth to the death of the last individual
Static life table
A life table that quantifies the survival and fecundity of all individuals in a population during a single time interval
Stable age distribution
When the age structure of a population does not change over time; occurs when survival and fecundity of each age class stays constant over time
Survivorship
The probability of surviving from birth to any later age class (lx)
Net reproductive rate (R0)
The total number of female offspring that we expect an average female to produce over the course of her life
Generation time T
The average time between the birth of an individual and the birth of its offspring
Overshoot
When a population grows beyond its carrying capacity; often occurs when the carrying capacity of a habitat decreases from one year to next
Die-off
A substantial decline in density that typically goes well below the carrying capacity
Deterministic model
A model that is designed to predict a result without accounting for random variation in population growth rate
Stochastic model
A model that incorporates random variation in birth and death rates due to random chance
Demographic stochasticity
Variation in birth rates and death rates due to random differences among individuals
Environmental stochasticity
Variation in birth rates and death rates due to random changes in the environmental conditions
Liebig’s law of the minimum
Law stating that a population increases until the supply of the most limiting resource prevents it from increaseing further
Competitive exclusion principle
Two species cannot coexist indefinitely when they are both limited by the same resource
Competition coefficients
Variables that convert between the number of individuals of one species and the number of individuals of the other species
Zero population growth isocline
Population sizes at which a population experiences zero
Ecotone
A boundary created by sharp changes in environmental conditions over a relatively short distance, accompanied by a sharp change in species
Rank abundance curves
A curve that plots the relative abundance of each species in a community in rank order from the most abundant species to the least abundant species
Species evenness
A comparison of the relative abundance of each species in a community
Trophic pyramid
A chart composed of stacked rectangles representing the amount of energy or biomass in each trophic group
Ecological stoichiometry
The study of the balance of nutrients in ecological interactions, such as between an herbivore and a plant