bsci160 - population ecology 1
1/29
There's no tags or description
Looks like no tags are added yet.
Name | Mastery | Learn | Test | Matching | Spaced | Call with Kai |
|---|
No analytics yet
Send a link to your students to track their progress
30 Terms
population
a group of individuals of the same species living in the same general area
at 1 point in time
can change over time
ecology
the study of the interactions of organisms with their environment and with each other
population ecology
the study of populations in relation to their environment
including influences on population size, growth, age structure & more
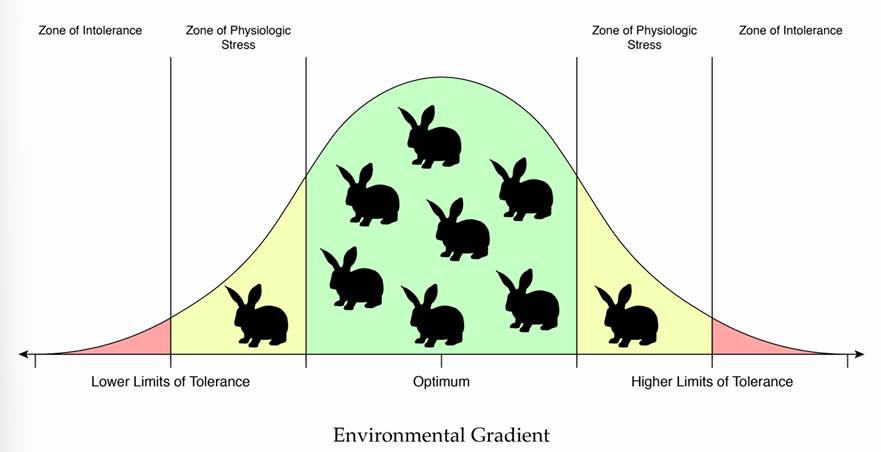
range of tolerance
measure
abundance (#)
density
dispersion
population size
abundance (N)
number
important for assessing potential for increase in absolute #
crucial in conservation
density
N / area or volume
ecological factors influenced by density of pop
not absolute #
competitive interactions
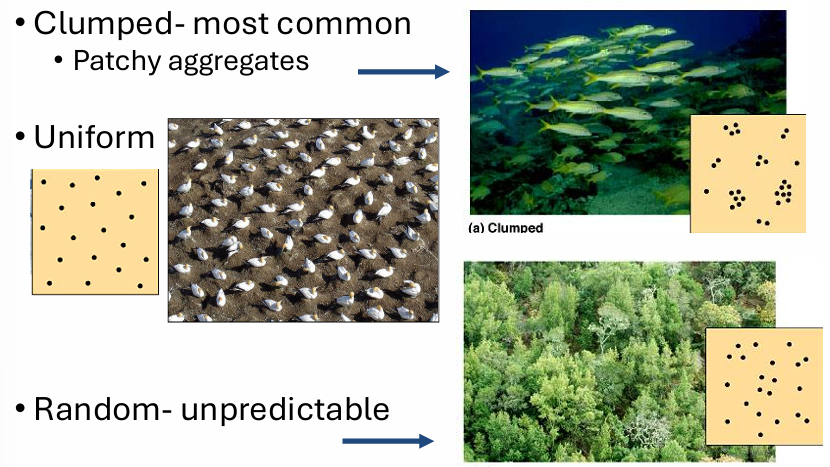
dispersion
patterns of dispersion
clumped → most common
patchy aggregates
uniform → even
random → unpredictable
population size
# of individuals in population at one point in time
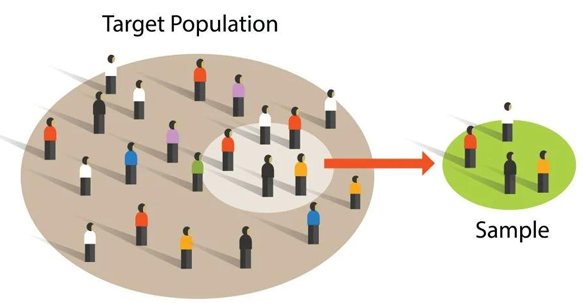
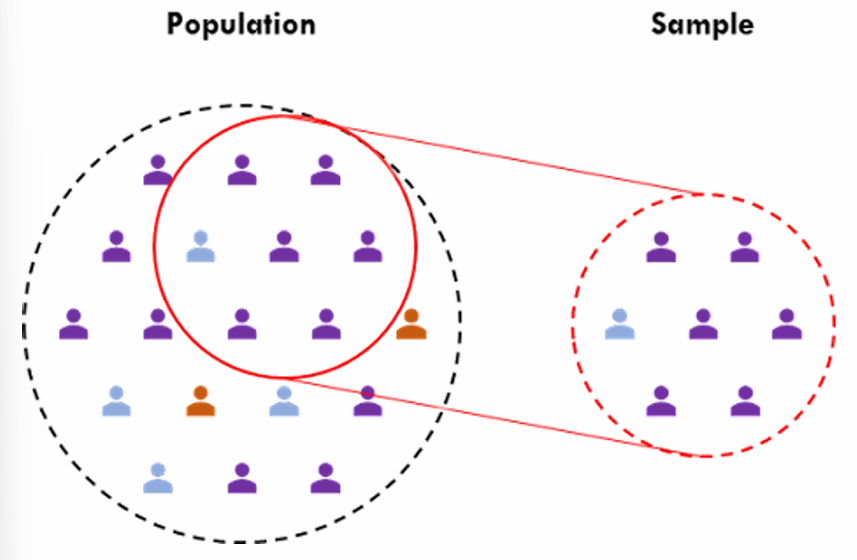
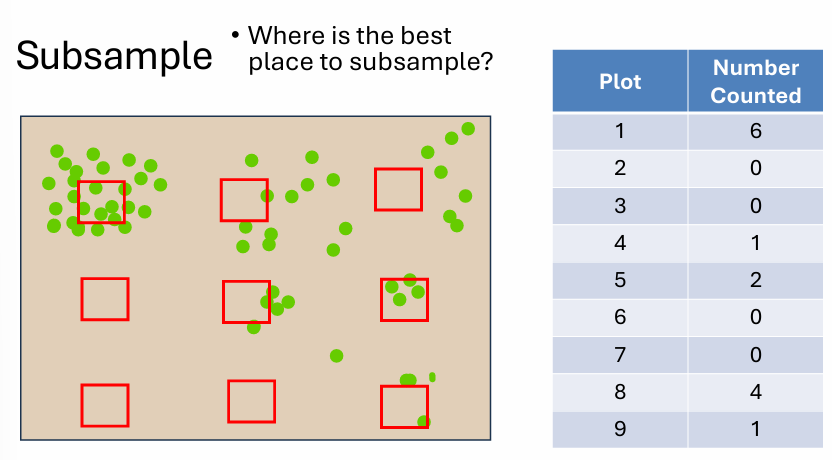
take a sample
ecological sample
a portion, piece, or segment that is representative of a while
b/c impossible to measure whole
be careful of bias
sample based on needs, prior info, & specifics of site
sample assumptions
sample is representative of whole
needed to take enough samples so accurate representation is obtained
sampling bias
tend to favor or look for a specific outcome
opposite is true too
sampling types
random
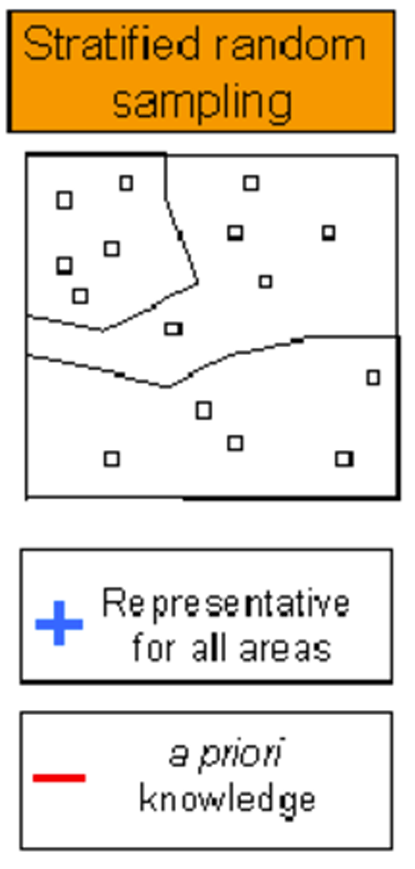
stratified
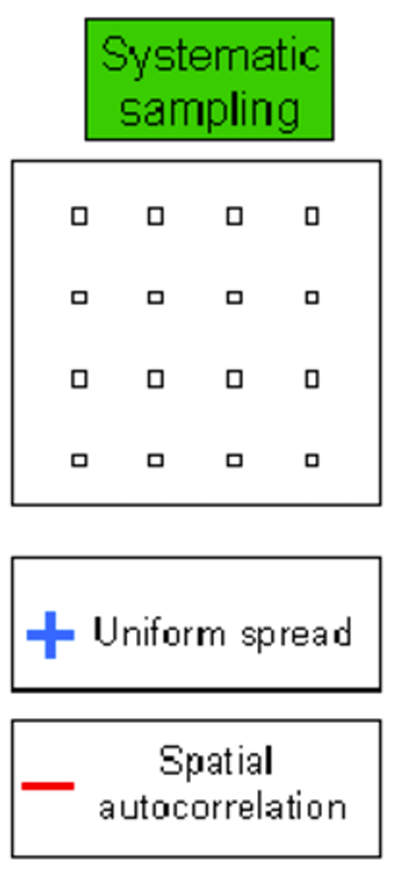
systematic
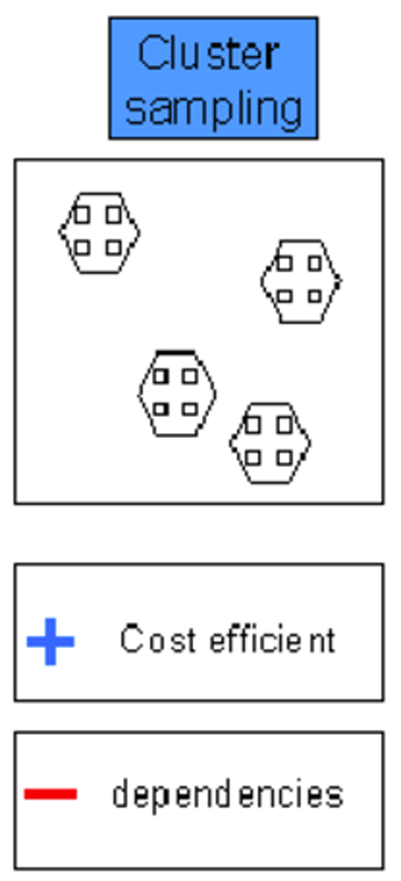
cluster
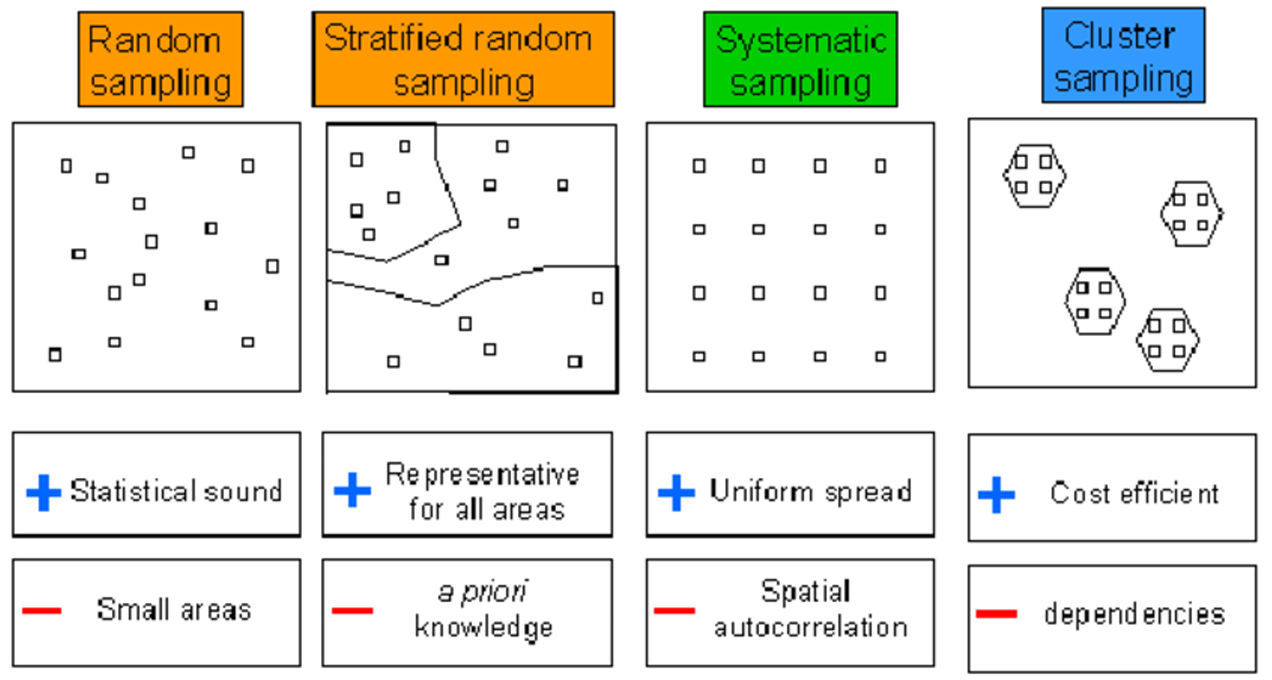
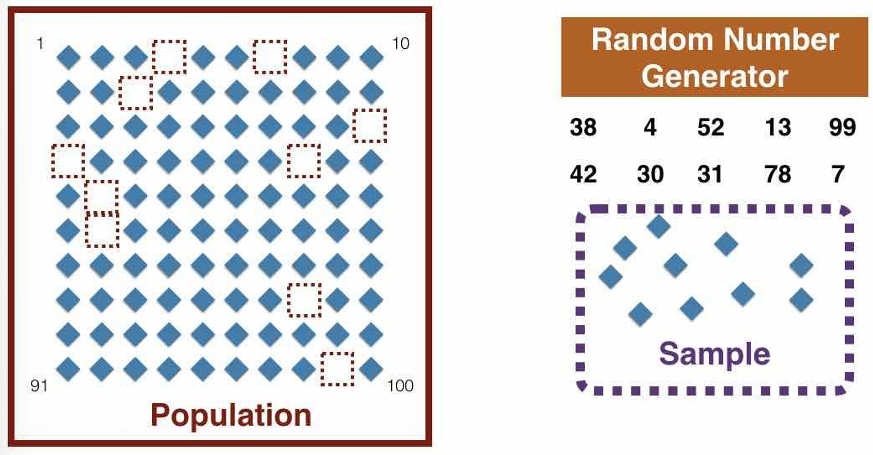
random sampling
every element has equal probability to be selected
stratified sampling
have previous knowledge of environment & need equal samples in each condition
3 diff environments → 5 samples in each
systematic sampling
sampling by creating a grid and collected in even increments
spatial autocorrelation - samples closer together will be more similar
don’t want
cluster sampling
randomly choosing 4 areas of a site & randomly sample within those areas
cost prohibitive effect - limiting factor (cost, resource, etc)
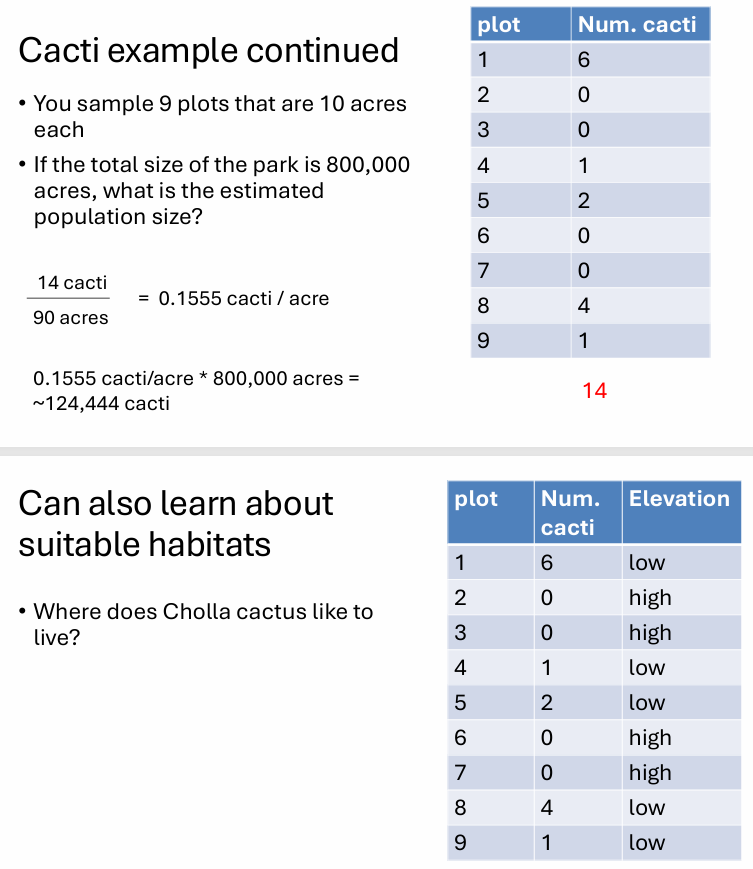
example: cholla cacti population in Joshua tree National Park

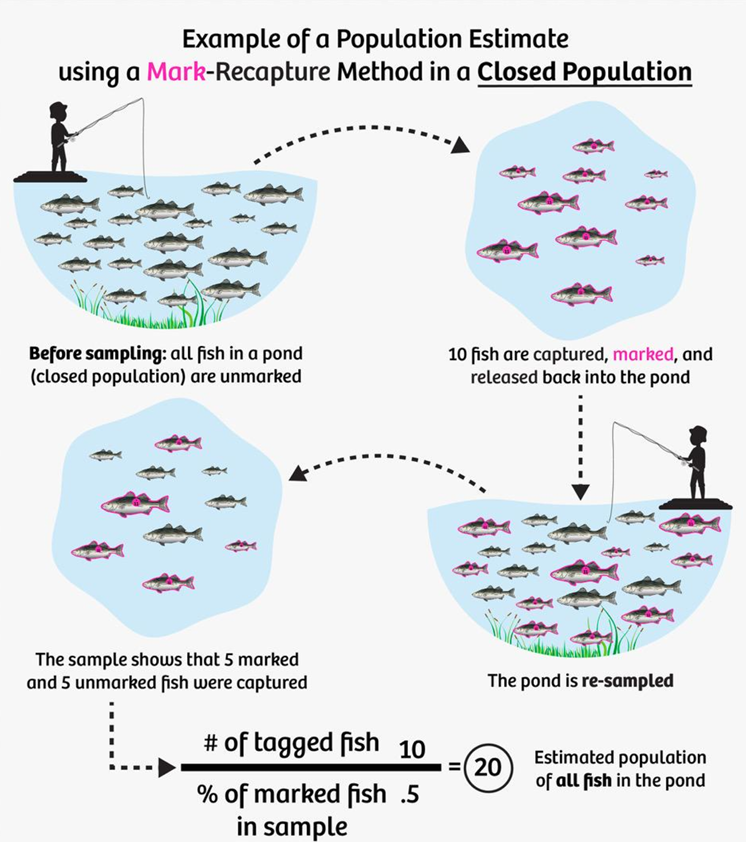
Lincoln Index
capture-mark-recapture
animals captured, counted, tagged & released
capture again after time pass
previously tagged animals counted & unmarked organisms are marked
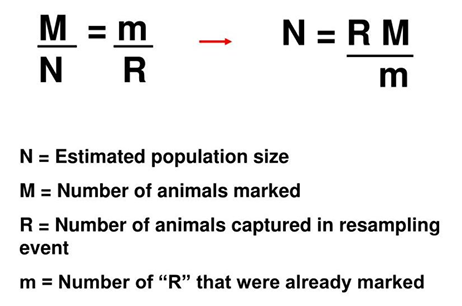
abundance calculated using formula
small pop. → recapture most marked ind.
large pop. → recapture few marked ind.
multiply 2 big # & divide by small #
(A x B) / c
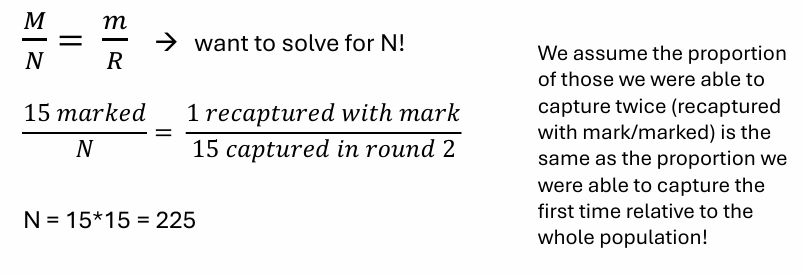
Imagine that you tag and release 15 birds, and when you collect 15 birds later that year, only one of them is tagged. What is your estimate of the total population size?
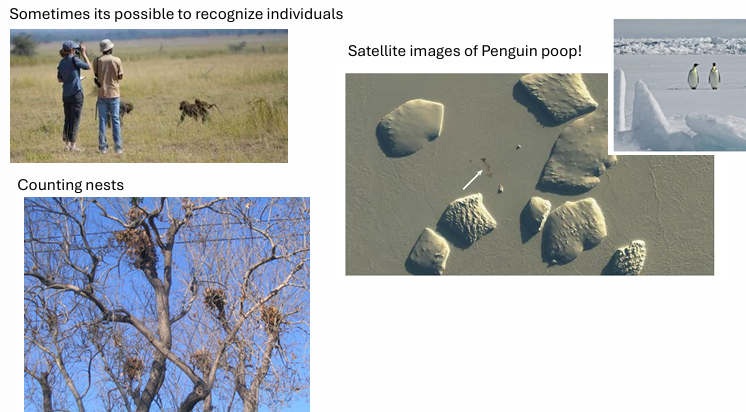
population size other methods
sometimes able to recognize ind.
counting nests
satellite images
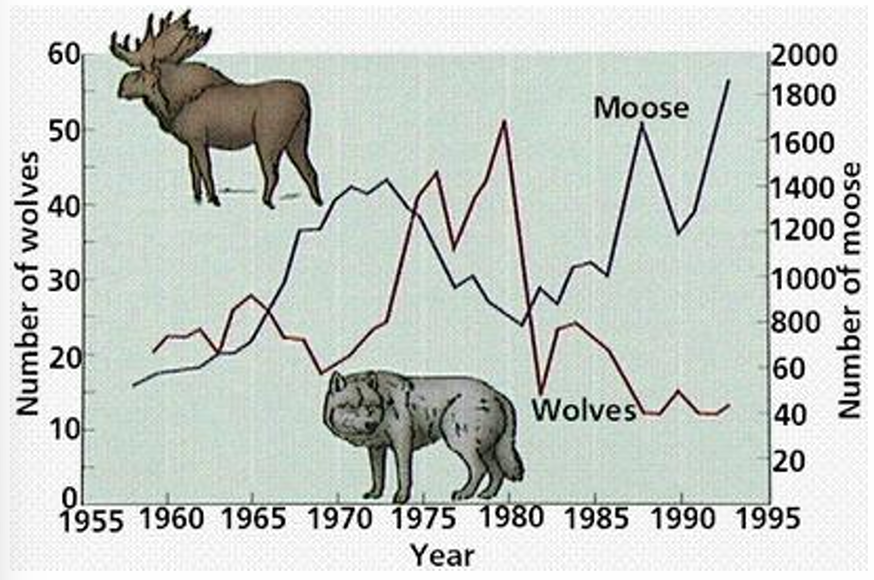
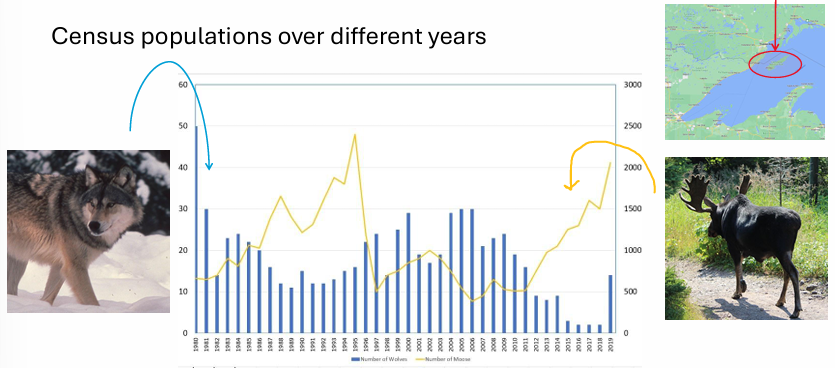
population dynamics
△ in pop size → ↑ interest > total pop size
declining pop → extinction risk
population growth
measured by census populations over diff years
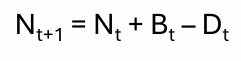
population size equation
(births - deaths) + (immigrants - emigrants)
immigration
influx of new individuals from other areas
“in”
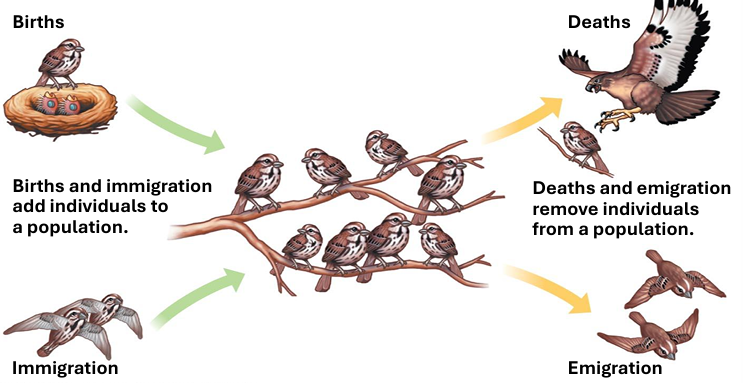
emmigration
movement of individuals out of a population
“exit”

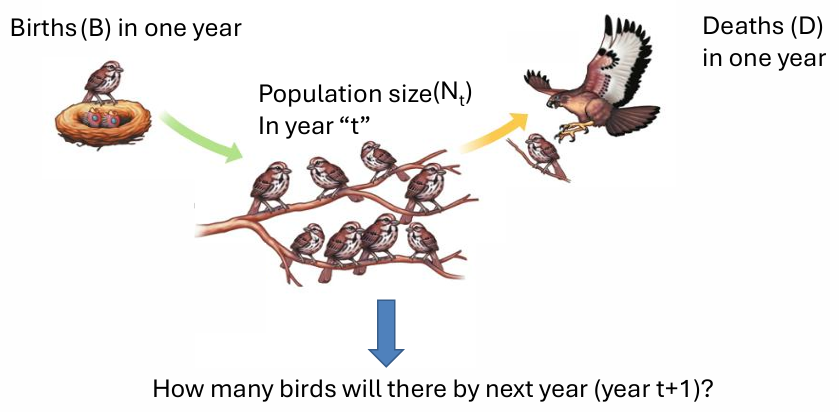
birth death model
Bt - total # births in pop @ 1 time point (time=t)
Dt - total # deaths in pop @ time t
Nt - pop size @ time t
Nt+1 = Population size at time t+1
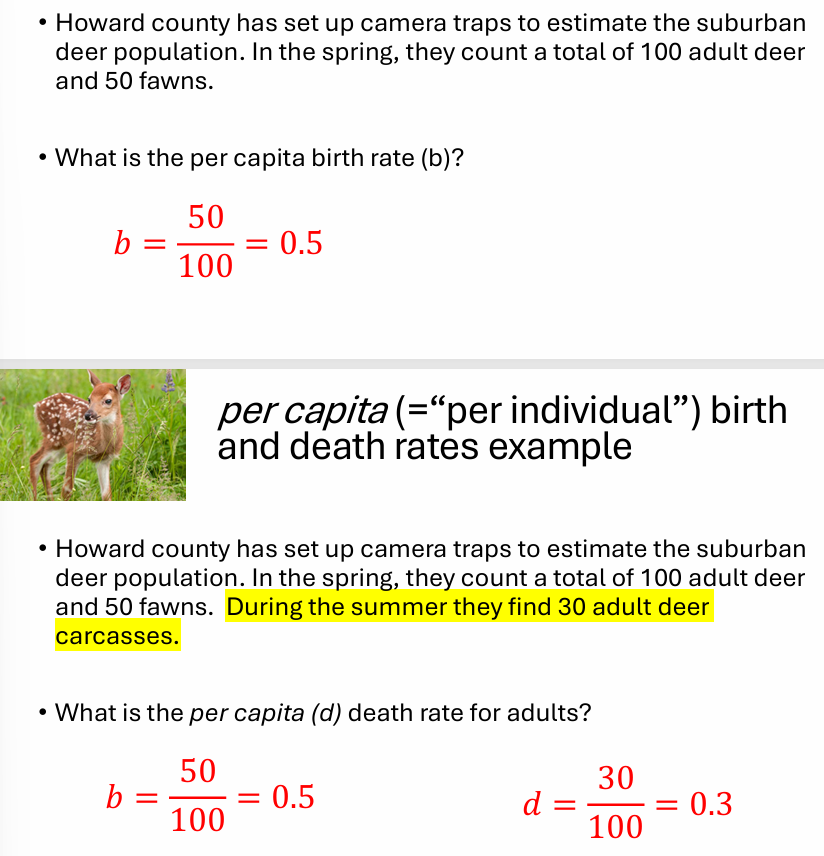
per capita model
per capita - “per individual” birth & death rates
(b) → avg. # of offspring produced by single individual
b = # births / ind. in past year
(d) → probability of dying
d = # deaths / ind. in past year
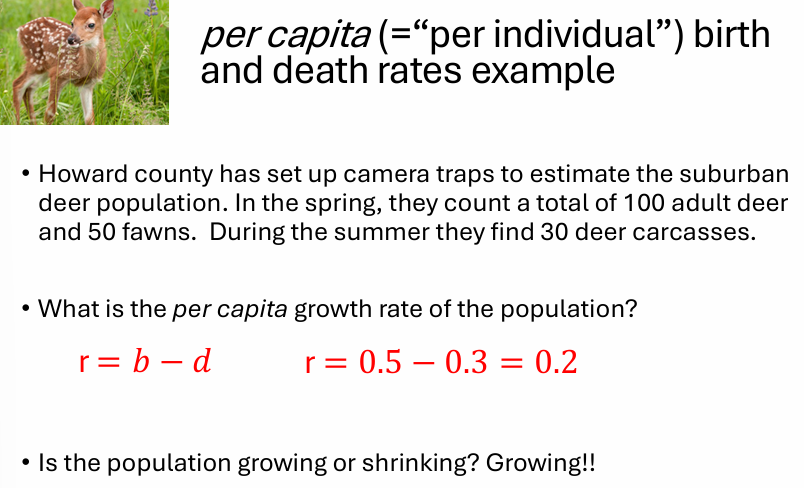
per capita growth rate (r)
r = b - d
intrinsic growth rate & rate of increase
r > 0 → pop growing
r < 0 → pop shrinking
r = 0 → pop stable
True/False: A population cannot persist in an environment where per capita growth rate is negative
TRUE
population will decline to 0 unless somethings changes r
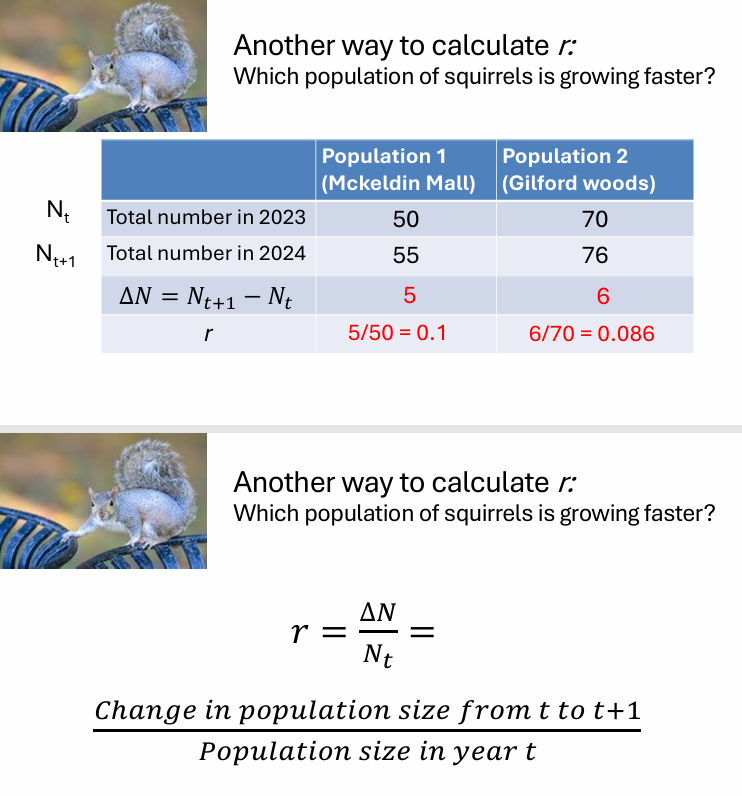
growth rate comparison (r)
r = △N / Nt =
△N → pop size from t to t+1
Nt → pop size at t
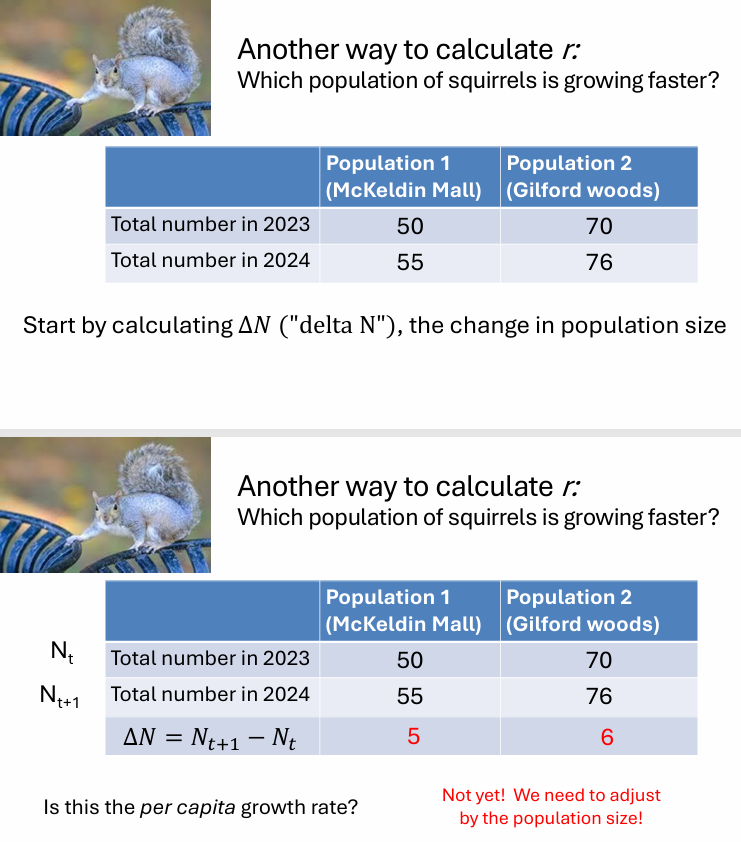
r example