PM EXAM SEM 5
1/68
There's no tags or description
Looks like no tags are added yet.
Name | Mastery | Learn | Test | Matching | Spaced | Call with Kai |
|---|
No analytics yet
Send a link to your students to track their progress
69 Terms
Define particular components in MRP record
Gross requirements
The total quantity needed in a given period before checking inventory./Scheduled receipts
Orders that were already placed earlier and are expected to arrive within a specific period. They have a known quantity and a known arrival date./Projectedon-hand inventory
Expected inventory at the end of a period./Net requirements
The real amount that must be ordered or produced after checking what is already available./Plannedorder receipt
The quantity that should arrive in a specific period./Planned order release
The moment when the order must be started or placed, considering the lead time.Lead time
Time needed to buy, produce, or assemble an item.Lot size rule
A rule that tells how much to order or produce at one time, for example, Lot-for-Lot, FOQ, EOQ. It affects planned order receipts.
What is MRP?
MRP = Material Requirements Planning
MRP is a production planning system that helps a company decide what materials/components are needed, how many are needed, and when they should be ordered or produced.
Main objective of MRP:
To make sure materials are available at the right time, in the right quantity, without too much inventory. It supports production scheduling, purchasing, and inventory control. In the lecture, MRP is described as focused on efficient material procurement and production scheduling: what, when, and how much to replenish.
What are inputs of MRP
MPS(orders and forcasts)/BOM-Bill Of Materials/Inventory records/Lead time/Lot-sizing rule
What are outputs of MRP?
Planned order releases/Planned order receipts/Projected available balance/Inventory status reports
ERP – stages in evolution with short characteristics of each stage
1.Inventory Management Control - 1960s
Focused mainly on tracking inventory. Data was often entered manually, systems worked separately, and there was almost no integration between departments.
MRP - Material Requirements Planning - 1970s
Focused on materials planning: what materials are needed, how much, and when. It used BOM and production schedules, but mainly supported production only.MRP II - Manufacturing Resource Planning - 1980s
Expanded MRP by adding more manufacturing resources, like capacity planning, shop-floor control, quality, costs, and some financial data. Still, it was not fully integrated across the whole company.ERP - Enterprise Resource Planning - 1990s
Integrated many company departments into one system, for example production, finance, purchasing, sales, inventory, and HR. Its main idea was better information flow across the company.ERP II / Internet-enabled ERP - 2000s
ERP started connecting not only internal departments, but also external partners, customers, suppliers, e-commerce, CRM, and SCM.Cloud-based ERP - 2010s
ERP moved to web-based platforms and cloud computing. It became easier to access, but data security became a bigger concern.Intelligent ERP - 2020s+
Modern ERP uses technologies like AI, machine learning, IoT, and blockchain. It supports predictive and adaptive decision-making, but still has challenges like data security and the role of AI.
What is aggregate planning, and what is its goal?
Aggregate planning is a medium-term production plan* used to decide the general level of:
production,
inventory,
workforce,
needed to meet expected demand, usually for 3–18 months. It works with product groups/families, not single products, so it is more “big picture” planning.
Goal of aggregate planning:
The main goal is to balance demand and capacity in the cheapest and most stable way. So the company decides whether to produce more/less, hire workers, use overtime, subcontract, or build inventory.
Why aggregate planning is used by companies, how to create an aggregate plan?
Companies use aggregate planning because demand is not always stable. It can change by month or season, so the company must decide how to balance demand and capacity without chaos, panic, and expensive last-minute decisions. Lovely, as always.
How to create an aggregate plan:
Collect information
Compare demand with capacity
capacity = demand, but with minimum cost.
Choose demand or supply options
Choose a planning strategy
Level strategy - stable production and workforce; inventory absorbs demand changes.
Chase strategy - production changes to match demand; low inventory but unstable workforce.
Hybrid strategy - mix of both; usually more realistic, because companies enjoy making life complicated.
Disaggregate the plan into MPS
The aggregate plan is later broken down into specific product requirements. The result is the Master Production Schedule, showing what, when, and how much to produce.
What strategies for aggregation may be used by company – characterize them (chase/level)
1. Level strategy - production levelling
In a level strategy, the company keeps a stable production rate and usually also a stable workforce.
Demand may go up and down, but production stays almost the same. Differences are handled by:
building inventory when demand is lower,
using inventory when demand is higher,
sometimes using backorders.
It is good when demand is stable and predictable.
Main advantage: stable work and easier planning.
Main disadvantage: inventory can become high.
2. Chase strategy - demand matching
In the chase strategy, the company changes production in each period to match demand exactly.
So when demand increases, production increases. When demand decreases, production decreases. This often means:
hiring or laying off workers,
using overtime,
changing capacity,
keeping inventory very low.
It is good for custom products, services, or perishable goods, where keeping inventory is expensive or impossible.
Main advantage: low inventory.
Main disadvantage: unstable workforce and more stress.
3. Mixed/hybrid strategy
This is a combination of both. The company tries to keep some stability, but also reacts to demand changes. It balances production rate, workforce, and inventory. Usually, this is the most realistic strategy, because real companies love making things messy but manageable.
What is MPS and how is it made?
MPS - Master Production Schedule
MPS is a detailed production plan that specifies which finished products should be produced, how many units, and when. It is more detailed than aggregate planning because it focuses on specific products/SKUs rather than product families.
How it is made:
First, the company takes the aggregate plan / SOP and breaks it down into specific products.
What are inputs of MPS?
aggregate plan/sales and operations plan,
demand forecast,
customer orders,
inventory situation,
production capacity,
product types / SKUs.
What are outputs of MPS?
production quantities for each finished product,
timing: when products should be completed,
information for MRP,
basis for checking capacity, for example, with RCCP.
MPS key components characteristics: projected on hand, ATP
1. Projected on-hand inventory / Projected available balance
It shows the expected inventory at the end of each period after demand and production are considered.
ATP - Available to Promise
ATP shows how many units are still available to promise to new customers without disturbing already accepted orders. It is not the total inventory. It is only the quantity that is still “free” after existing customer orders are covered.
Master scheduling process – key activities, time frames
Key activities:
Disaggregate aggregate plan - Break product families into specific products.
Set quantities and timing - Decide how many units of each product should be completed in each week.
Check demand and orders - Use forecasts and customer orders to make the schedule realistic.
Check capacity with RCCP - Rough-Cut Capacity Planning checks if there is enough manpower, machines, storage space, and supplier capability.
Adjust the schedule if needed - If capacity is too low, the company can use overtime, subcontracting, rescheduling, etc.
Time frame: |
Why do we have inventory in a company (reasons)?
To meet customer demand- Customers often expect products to be available immediately.
To handle uncertainty- Demand can change, and suppliers can be late. Inventory works like a buffer.
To use economies of scale - Buying or producing in larger quantities can reduce unit cost.
To support continuous production - Raw materials and WIP inventory help avoid stopping production when something is delayed.
To manage seasonal demand - Companies can build stock before busy seasons.
To protect against price changes - A company may buy more when prices are low to avoid higher costs later.
To reduce lead time - If items are already in stock, customers or production do not need to wait so long.
To avoid disruptions - Inventory protects against strikes, transport problems, disasters, or supply chain issues.
What are types of inventory costs + short characteristic
Holding/carrying costs - Costs of keeping inventory in stock.
Example: warehouse space, insurance, security, damage, obsolescence, frozen capital.Ordering costs - Costs connected with placing and receiving an order.
Example: preparing purchase order, transport, administration, delivery checking.Shortage costs - Costs when the company does not have enough inventory.
Example: lost sales, production stoppage, delays, unhappy customers, emergency orders.
How do work models of inventory management: Reorder point, Fixed time period order system (characteristic)?
1. Reorder Point system — ROP
In this system, inventory is controlled continuously. The company places a new order when stock falls to a specific level called the reorder point.
How it works:
When inventory reaches ROP → order is placed.
Order quantity is usually fixed, for example EOQ.
2. Fixed Time Period Order System
In this system, orders are placed at regular time intervals, for example every week or every month. Inventory is checked only at the end of the fixed period. Then the company orders enough to bring inventory back to a target level.
How it works:
Check inventory every fixed period → calculate missing quantity → order up to target level.
Good for: cheaper items, many items ordered together, less strict control.
Main risk: between two checks, stock can run out, so safety stock is often needed.
List and characterize types of inventory (WIP, MRO, safety stock, cycle stock)
WIP - Work in Process
Products that are partly finished, but still not ready for sale.MRO - Maintenance, Repair and Operating inventory
Items used to keep machines and processes working, but they are not part of the final product.Safety stock
Extra inventory kept just in case demand is higher than expected or supplier is late.Cycle stock
Inventory created because the company buys or produces more than immediately needed, usually because of batch sizes or lower unit costs.
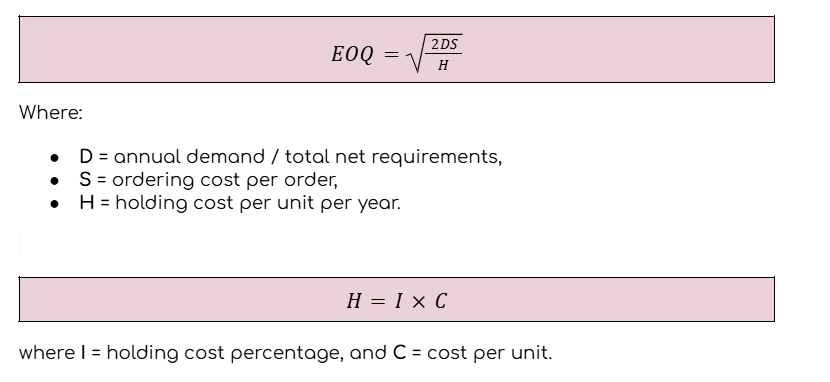
EOQ- how to calculate it, why do we use this method?
EOQ - Economic Order Quantity
EOQ is the optimal order quantity that minimises total inventory costs. It is used when demand and lead time are quite stable.
We use EOQ to find a balance between:
ordering cost - too many small orders = expensive,
holding cost - very large orders = expensive storage.
ABC analysis- objective, results, why do we use this method, characteristic of particular categories : A,B,C
ABC analysis is an inventory classification method. It divides items into A, B, and C groups based on their annual value / annual dollar volume.
Objective:
To identify which items are the most important and should be controlled more carefully.
Why do we use it?
Because not all inventory items are equally important. Usually, according to the Pareto rule, about 20% of items consume around 80% of inventory investment, so the company should focus more attention on these items.
Result of ABC analysis:
Inventory is divided into three categories:
A items
High annual value. Usually small number of items, but they represent the biggest part of inventory value. They need strict control, frequent monitoring, accurate records, and careful forecasting.
B items
Medium annual value. They need normal/moderate control — not as strict as A, but not ignored either.
C items
Low annual value. Usually many items, but they represent a small part of total inventory value. They need simple control, because spending too much time on them would be a waste. Classic “important? yes, but calm down” category.
How to manage dead stock in a company, why do we have dead stock?
Dead stock is inventory that is unsold or obsolete, usually at the end of its product life cycle. So it just sits in the warehouse and quietly eats money.
Why do we have dead stock?
overstocking,
wrong demand forecasting,
seasonal or trend changes,
products too similar to each other,
ineffective inventory management,
defective items,
expiration or obsolescence.
How to manage dead stock?
Discounts/clearance sales - sell it cheaper to move stock faster.
Bundling - add dead stock to popular products as a set.
Alternative sales channels - sell through outlets, online marketplaces, B2B, etc.
Better inventory management - improve forecasting, ordering quantities, and stock control.
Real-time tracking systems - monitor inventory and detect slow-moving items earlier.
Lot sizing techniques key characteristic: L4L, EOQ, FOQ, POQ
1. L4L - Lot for Lot
Order exactly the net requirement for each period.
It gives almost zero ending inventory, but may create many small orders. Good when holding cost is high and ordering cost is low.
2. FOQ — Fixed Order Quantity
Order is always the same fixed quantity, for example always 200 units.
Simple and good when ordering/setup cost is high, but it can create too much inventory if demand is low.
3. EOQ - Economic Order Quantity
Order quantity is calculated to minimize total inventory cost.
It balances ordering/setup cost and holding cost. Best when demand and lead time are stable.
4. POQ - Periodic Order Quantity
Order quantity covers demand for a fixed number of future periods, for example 3 weeks.
So the quantity can change, but the coverage period is fixed. It is more dynamic and reacts better to demand than FOQ.
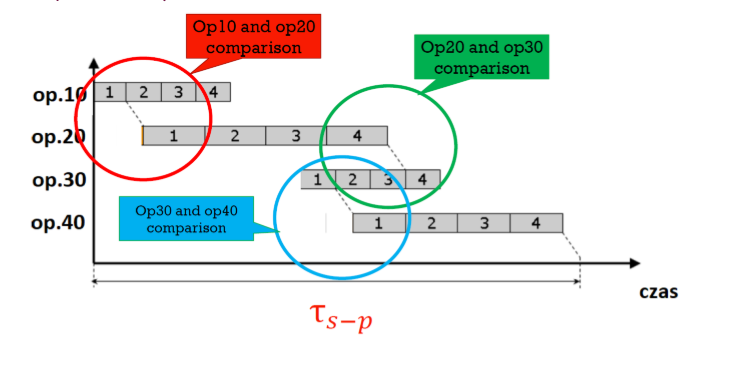
Specific features of particular manufacturing cycle types: serial, paralel, serial-parallel (time, transport operations and breaks, organization of the manufacturing process)
Serial cycle:
Longest and simplest. The whole batch moves only after all items are finished, so it is slow and has many breaks.
Parallel cycle:
Shortest and fastest. Items or transport batches move earlier, but it needs good planning and synchronisation.
Serial-parallel cycle:
Middle option. Faster than serial, but not as fast as parallel. It combines both methods and reduces some waiting time.
What is it?
Serial cycle
What is it?
Parallel cycle
What is it?
serial-parallel cycle
What is it?
Cyclogram
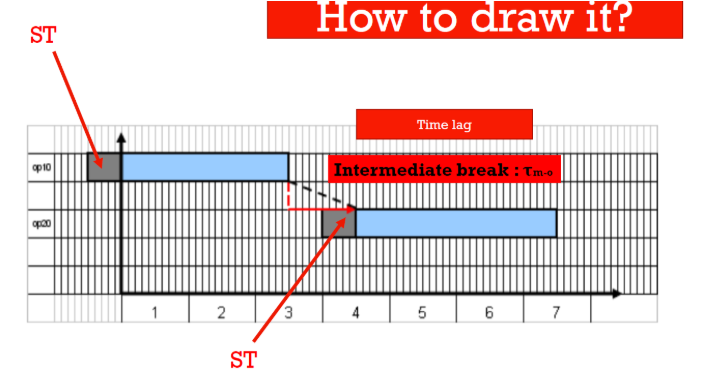
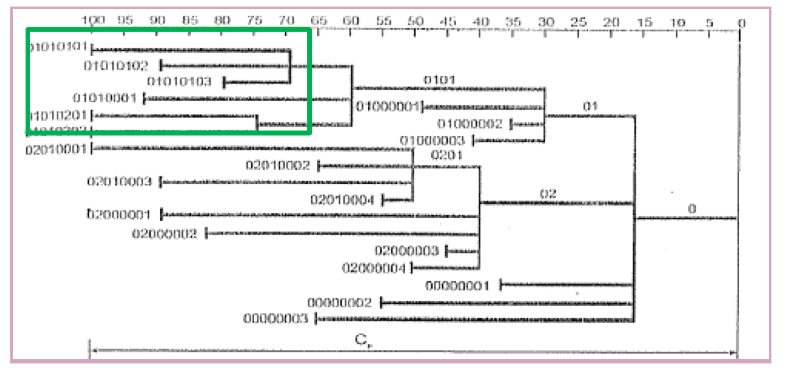
What is cyclogram? How does it look like?(figure) How to analyse it?
A cyclogram is a graphical method used for planning production of a complex product. It shows when each component or operation should start and finish. It adds a time axis to the product structure/BOM, because BOM only shows what is needed, but not when it should be made.
Cyclogram shows:
sequence of operations,
duration of each activity,
which parts are made before assembly,
which operations can happen in parallel,
total production cycle time,
when components must be ready for assembly.
What data are required for preparing the cyclogram?
BOM / product structure - We need to know the levels of the product: final product, subassemblies, parts, and quantities.
Complexity level of the product- Is it a simple product or a complex product with many components?
Structure of the manufacturing process - Which operations are needed and in what order.
Operation times - Processing time, setup time, and sometimes batch time.
Batch size — n - How many pieces are produced in one batch.
Intermediate breaks - Waiting/transport breaks between operations.
Relationships between operations - Which operations are serial, parallel, or serial-parallel.
What are specialization types in a manufacturing company? Describe them and give some examples of particular types of specialization
Specialization in manufacturing means how strongly resources like machines, workers and workstations are dedicated to a specific task, process or product.
1. Product specialization
Resources are organized around one product or product family.
The layout follows the steps needed to make that product.
Features:
good for similar/repetitive products,
material flow is simpler,
setup time can be lower,
less flexible for very different products.
Example:
A cell producing different models of similar household appliances, or an assembly line for bicycles/cars.
2. Process / technological specialization
Resources are grouped by similar process or technology, not by product.
Features:
good for high variety and low volume,
flexible for different products,
products may follow different routes,
planning can be more complex.
Example:
A welding department where different metal parts are welded, or a machining department with milling/drilling machines.
3. Labor specialization
Workers focus on a specific type of task or skill.
Example:
One worker specializes in welding, another in painting, another in quality control.
How can manufacturing processes be classified?
Manufacturing processes can be classified by different criteria, such as nature of process, technology applied, automation level, and type of production.
Classification by nature of process
Natural process — happens with minimal human intervention, e.g. drying, fermentation, evaporation.
Artificial / man-made process — created and controlled by people using machines or technology, e.g. machining, casting, welding.
Classification by technology applied
Shaping — changes the shape or form of material, e.g. casting, forging, rolling, milling, drilling.
Finishing — improves surface, dimensions, or properties, e.g. painting, coating, grinding, polishing, heat treatment.
Joining — connects parts together, e.g. welding, bolting, riveting, bonding.
Classification by automation level
Manual process — human does everything with hand tools.
Machine-manual process — machine helps, but human controls it.
Machine process — machine does the main work, human sets and supervises.
Automated process — process runs automatically, human only monitors.
Fully automated process — system controls itself using sensors, AI, IoT, etc.
Classification by type of production
Job production — small quantity, custom product, high variety, e.g. aerospace parts.
Batch production — products made in batches, e.g. bakery products, clothes, medicines.
Mass production — large volume of standardized products, e.g. cars, phones.
Continuous production — 24/7 flow, highly automated, e.g. oil refining, chemicals, cement.
What are the elements of the workstation?
Elements of a workstation:
Defined physical space - A clearly marked area where work is performed. It should be arranged so movement is easy and logical.
Machinery and equipment - Machines, tools, fixtures and materials needed for the operation. They perform or support the transformation.
Human or automated operator - A worker or robot that performs or supervises the operation.
Defined input and output - Materials enter the workstation, are processed, and leave as output.
Production tasks, information and data - Instructions/procedures that define the method of work and quality requirements.
How can workstation types be classified?
Workstations can be classified by level of automation, function/nature of transformation, process flexibility, and worker involvement.
Classification by level of automation
Manual workstation — operated by people using hand tools; good for custom or low-volume tasks.
Semi-automated workstation — human works together with machines and still operates, monitors, or adjusts the process.
Fully automated workstation — works mostly independently, often with robots or computer control; good for repetitive, high-volume production.
Classification by function / nature of transformation
Assembly workstation — joins parts into a final product.
Inspection workstation — checks if the product meets quality standards.
Testing workstation — tests product performance, often in industries with strict quality requirements.
Packaging workstation — used for packaging and labelling products.
Classification by process flexibility
Fixed workstation — performs tasks that rarely change; good for high-volume and low-variety production. Changing tasks is difficult and costly.
Flexible workstation — can handle different tasks or products; equipment can be reprogrammed or retooled. Good for low/medium volume and varied products.
Classification by worker involvement
Single-operator workstation — one worker is responsible for all tasks at the station.
Multiple-operator workstation — more workers cooperate at one station, usually when tasks are complex.
What are types of manufacturing cell according to the complexity (workstation, line, etc).(8)
Types of manufacturing units according to complexity:
Workstation - The smallest unit. One machine/workplace where one operator performs one task.
Example: CNC milling machine operated by one worker.
Manufacturing cell - A group of workstations/resources organized to make a specific product or product family.
Example: machining cell producing metal brackets.
Production line - A sequence of workstations/cells arranged for continuous flow of standardized products.
Example: bicycle assembly line.
Job shop - A group of similar workstations used for different, custom products.
Example: tool-making shop processing custom orders.
Department - Larger area made of several cells, lines, or job shops.
Example: machining department.
Division - Group of departments focused on a product/market area.
Example: automotive components division.
Plant - Whole factory with many departments/divisions.
Company - The whole enterprise, sometimes with many plants.
What are the elements of the production system model?
Inputs - Resources entering the system: materials, labor, energy, capital, information.
Transformation process - Activities that change inputs into outputs, for example machining, assembly, inspection, storage, or data processing.
Outputs - Finished goods or services that satisfy customer needs.
Control and feedback - Monitoring results, checking performance, and correcting problems when something goes wrong.
Environment - Outside factors that influence the system, for example market demand, law, technology, suppliers, competition.
What kind of information are included in BOM?
BOM - Bill of Materials includes information about what is needed to build one product.
Main information in BOM:
Components/parts
Quantities
Product levels
Parent-child relationships
Part number/item code and description
Sometimes additional data
Types of BOM with short characteristic, how to present BOM
Types of BOM:
1. Single-level BOM
Shows only the components directly needed to make the final product. It is simple and flat, good for simple products.
2. Multi-level BOM
Shows the full product structure: final product → assemblies → subassemblies → parts → raw materials. It is more detailed and tree-like, good for complex products.
3. eBOM — Engineering BOM
Prepared by engineering/R&D during product design. It shows what the product is made of from a technical/design perspective, often based on CAD drawings.
4. mBOM — Manufacturing BOM
Prepared for production. It shows how the product is built, including assembly order, production routes, packaging and support materials.
5. sBOM / Service BOM
Used for maintenance and after-sales service. It includes mainly replaceable parts, spare parts and maintenance assemblies.
6. Sales BOM
Used in sales/order processing. It shows product kits, bundles, promotional packages or optional add-ons visible to the customer.
7. Modular BOM
Used for products with many variants. The product is divided into modules, so different versions can be configured faster without redesigning the whole BOM.
How to present BOM?
BOM can be presented as:
Indented/hierarchical BOM — text/table with levels, quantities and parent-child relations.
Product tree structure — graphical tree with boxes and lines, easier to understand visually.
Tabular format — table with part number, description, quantity, unit, cost, etc.
ERP system view — digital BOM in company software.
What are components of product + characteristic (raw material, part, assembly)
Components of a product are the elements used to build the final product.
Raw material
Basic material used at the beginning of production. It can be natural or synthetic.Part
A single component made from raw material. It has a specific function and usually cannot be disassembled further without destroying it.Subassembly
A group of parts joined together to perform a function. It is not the final product yet, but it simplifies final assembly.Final assembly / assembly
Complete product made from all parts and subassemblies. It is ready for inspection, packaging and delivery.
List and explain shortly production management functions(9)
Production management functions are the main decisions and activities needed to organize production. In lectures, they are listed as 9 critical functions: location, layout, product design, process design, production planning/control, quality, materials, maintenance, and inventory control.
Location of facilities - Choosing the best place for the factory/plant. We consider raw materials, market, labour, transport, infrastructure, government policy, environment, etc.
Plant layout - Deciding how to arrange machines, workers, storage and equipment inside the facility. Good layout improves flow and reduces unnecessary movement.
Product design - Designing what the product should look like, what functions it should have, and what materials/components are needed.
Process design - Deciding how the product will be made: operations, machines, technology, sequence of work, and workstations.
Production planning and control - Planning what to produce, how much, when, and with what resources. It includes forecasting, capacity planning, MRP, scheduling and sequencing.
Quality control - Checking materials, production process and final products to detect/prevent defects and make sure standards are met.
Materials management - Planning, purchasing, storing and controlling materials so the right materials are available at the right time, quantity, quality and cost.
Maintenance management - Keeping machines and equipment in good condition to prevent breakdowns and production stops.
Inventory control - Deciding how much inventory to keep and when to reorder, so the company avoids both shortages and too much stock.
What are the main production system types?
Job shop/job production, batch production, project production, mass production, and continuous production.
Job shop / job production
Low volume and high variety. Products are usually custom-made for a specific order. Flexible machines and skilled workers are needed, but scheduling is more complex.
Example: aerospace parts, medical devices, custom furniture.
Batch production
Products are made in groups or batches. After one batch, machines can be changed for another product. It has medium volume and medium flexibility.
Example: bakery products, clothes, medicines.
Project production
One unique, large, and complex product is made. The product usually stays in one place, and workers/materials come to it. It needs careful planning.
Example: shipbuilding, bridge, skyscraper.
Mass production
High volume and low variety. Standardized products are made in large quantities, often on assembly lines.
Example: cars, smartphones, detergents.
Continuous production
Very high volume and very low flexibility. Production runs almost all the time and is usually highly automated. Stopping it is expensive.
Example: oil refining, chemicals, cement.
What is the order decoupling point?
It is the point where production changes from forecast-based to customer-order-based. Main options are MTS, ATO, MTO, and ETO.
MTS — Make to Stock
Products are made before the customer order and stored as finished goods. It allows fast delivery, but has low customization and risk of overstock or stockout.
Example: standard food products, basic clothes.
ATO — Assemble to Order
Components are prepared earlier, but the final product is assembled after the order. It has medium lead time and some customization from predefined options.
Example: computer set with selected components.
MTO — Make to Order
Production starts after the customer order. Usually raw materials or parts are in stock, but finished goods are not. It has longer lead time, high customization, and low overstock risk.
ETO — Engineer to Order
Design and engineering start after the customer order. It has the longest lead time, highest customization, and high risk, but also high customer fit.
Example: special machine, custom construction project.
What is the customer role in manufacturing?
The customer is usually less involved in the production process.
What is the customer role in services?
The customer often participates in the service process.
How is quality checked in manufacturing?
The product can usually be inspected before buying or before delivery.
How is quality checked in services?
Quality is often judged during or after the service.
What is the main difference between manufacturing and services in customer involvement?
In manufacturing, the customer is usually not very involved. In services, the customer often takes part in the process.
What is the main difference between manufacturing and services in quality control?
Manufacturing: Centers on defect prevention and physical product consistency (e.g., dimensions, weight, durability).
Services: Centers on customer satisfaction, responsiveness, and the smooth execution of a process (e.g., wait times, accuracy, employee courtesy).
What are the stages of the Product Life Cycle?
Introduction, growth, maturity, and decline.
Introduction stage
The product is new on the market. Sales are low and grow slowly. Costs are high because of development and promotion. Profit is low or negative. The main goal is to create awareness and convince customers.
Growth stage
Sales increase quickly and profit grows. More competitors appear. The company improves the product, adds features, expands distribution, and tries to increase market share.
Maturity stage
Sales are at the highest level and become stable. Competition is very strong. Profit is high but not growing much. The company focuses on defending market position, customer loyalty, price, and differentiation.
Decline stage
Sales and profit decrease. The product becomes less popular or outdated. The company reduces costs, limits marketing, and decides whether to withdraw, redesign, or replace the product.
What are supporting process in manufacturing process and what is their role ?
Supporting processes are activities that help the main transformation process, but they usually do not directly change the product. Their role is to keep production stable, reliable and efficient — basically they stop the factory from falling into elegant chaos.
Examples and role:
Maintenance - Keeps machines working and reduces downtime.
Quality control/coordination and control - Checks if products and processes meet standards.
Material handling - Moves, stores and protects materials during production. It ensures materials are in the right place at the right time.
Tool management - Makes sure tools are available, correct and calibrated.
Energy supply - Provides power, compressed air, water or other utilities needed for production.
Information systems - Collect data, monitor performance and support production control.