Module 4: Discrete Probability Distribution
1/21
There's no tags or description
Looks like no tags are added yet.
Name | Mastery | Learn | Test | Matching | Spaced | Call with Kai |
|---|
No analytics yet
Send a link to your students to track their progress
22 Terms
Random Variable
A numerical outcome of a random experiment
Discrete Random Variable
A random variable that can take up a finite number of outcomes
Probability Distribution
A table, graph or formula used to describe the probability of each value of a discrete random variable
Properties of a Probability Distribution
All of the probabilities add up to 1
Each P(x) is a value between 0 and 1
Probability Mass Function
asks “what is the probability of getting exactly that outcome/number?”
found within each individual rows of a table that stores all the probabilities of above said question
Cumulative Probability Function
asks “what is the probability of getting something less than or equal to a certain number:
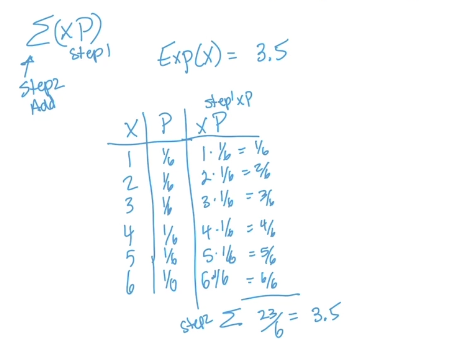
Expected Value
The long-term average/mean (µ): the value you will slowly expect to get as you keep doing an experiment over and over again
Formula (Sum of all the products of X times each of its own Probability)
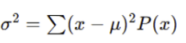
Variance
measure of spread of values around the mean
Step 1, x - mean/expect value for every row
Step 2, square each of the rows after doing x - mean/expected value to remove any negatives
Step 3, multiply whatever you get after square by the P" (on each of its found rows)
Step 4, add em all up together (Sum)
Standard Deviation
Square root of variance
When finding it, just do the variance formula then just square root the whole thing
Binomial Distribution
Probability distribution that describes number of successes in a fixed number of independent trials
Number of trials symbol (Binomial Distribution)
n
Probability of success symbol (Binomial Distribution)
p
Probability of failure symbol and formula (Binomial Distribution)
q
q = 1-p
Bernoulli Trial
Single experiement/trial with only two outcomes: Success / Failure (p/q)
Expected value/mean formula (Binomial Distribution)
Average number of successes in n trials: n x p
Variance (Binomial Distribution)
n x p x q
Standard Deviation
(square root of npq - the variance formula)
Geometric Trials
Number of trials needed in order to achieve the first success in a sequence of independent Bernoulli trials
Poisson Distribution
The number of occurrences of an event in a fixed time/space, given that they are independent and occur at a constant rate
Lambda (λ)
expected/average number of occurrences in a given time
Euler’s number
2.718
What happens if the time period for the question in lambda is different
Multiply lambda by the new time period relative to the old one. ex. if 1 hour lambda 6, then 30 minutes is ½ hours x lambda 6 which is 3 (the new lambda)