Unit 2 Lec 4: Nonrandom Mating, Conservation, Quan Gen
1/33
There's no tags or description
Looks like no tags are added yet.
Name | Mastery | Learn | Test | Matching | Spaced | Call with Kai |
|---|
No analytics yet
Send a link to your students to track their progress
34 Terms
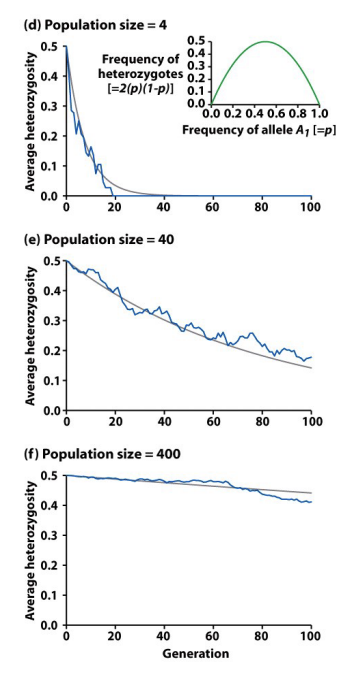
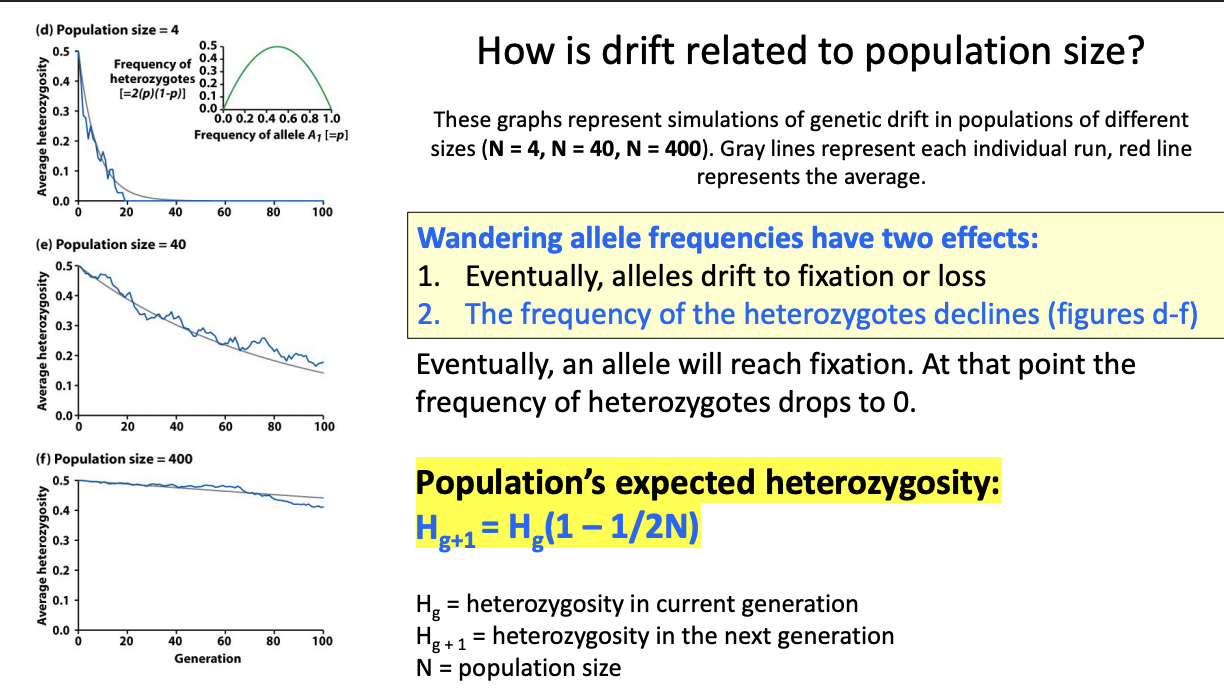
How is drift related to population size?
These graphs represent simulations of genetic drift in populations of different sizes (N = 4, N = 40, N = 400). Gray lines represent each individual run, red line represents the average.
what are the 2 effects wandering allele frequencies have?
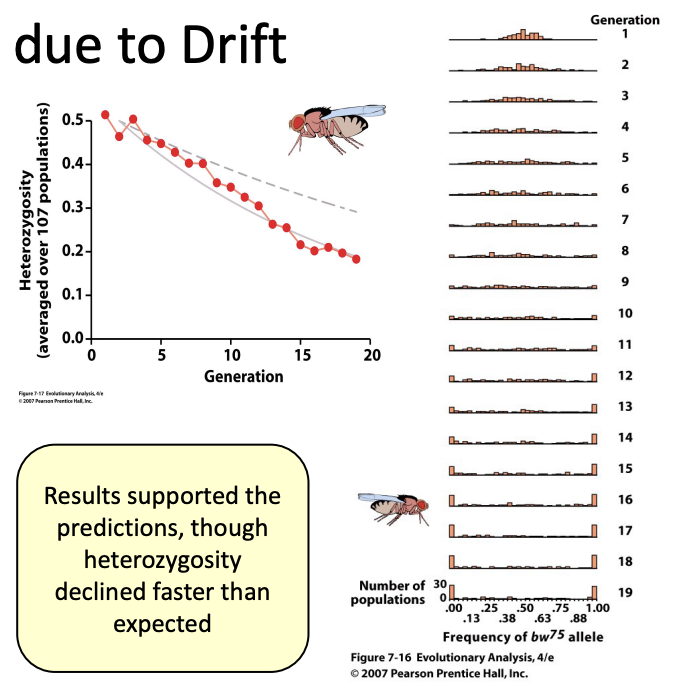
Loss of Heterozygosity due to Drift- Buri (1956)
Buri (1956) studied random fixation and loss of heterozygosity in 107 fruit fly populations
All the founding flies of the populations were heterozygous for an eye color gene: bw75/bw, so p = q = 0.5
They ran the study for 19 generations, randomly selecting new members for the next generation.
Predictions:
A. There are no fitness differences between alleles so the frequencies should just “wander”
B. Some populations should become fixed for the bw75 allele, others will lose it.
C. There should be a decline in heterozygosity
Results: it supported the predictions, though heterozygosity declined faster than expected
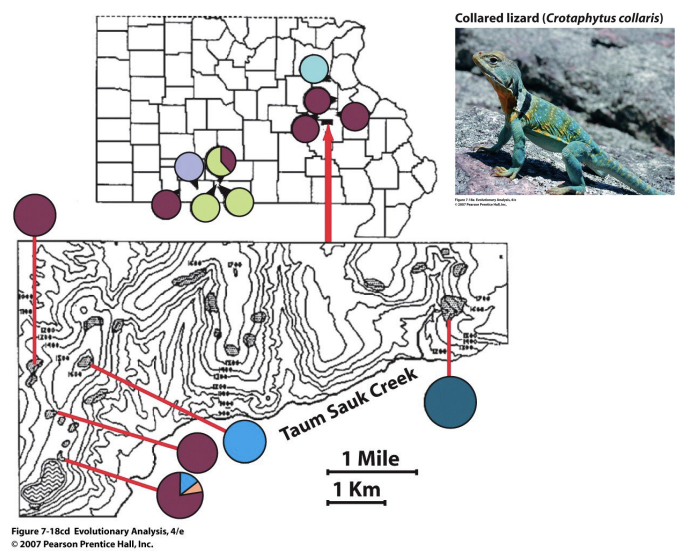
Examples of Drift in Natural Populations- Templeton and Colleagues (1990)
Templeton and colleagues (1990) tested predictions about random fixation of allele in natural populations of the collared lizard
Predicted strong imprint of drift:
A. Most loci will be fixed. Different pops may have fixation for different alleles, meaning pops should be genetically different from each other.
B. There will be low genetic variation at loci.
Results:
Shading represents the frequency in a single population of a particular (multilocus) genotype
Populations are fixed for different alleles
Templeton cont
Templeton collared lizard study: Fire suppression fragmented Ozark glade habitats, isolating collared lizard populations. Isolation reduced gene flow and increased genetic drift and extinction risk. Restoring habitat with prescribed burns reconnected populations and restored gene flow.
Examples of Drift in Natural Populations- Young and colleagues (1996)
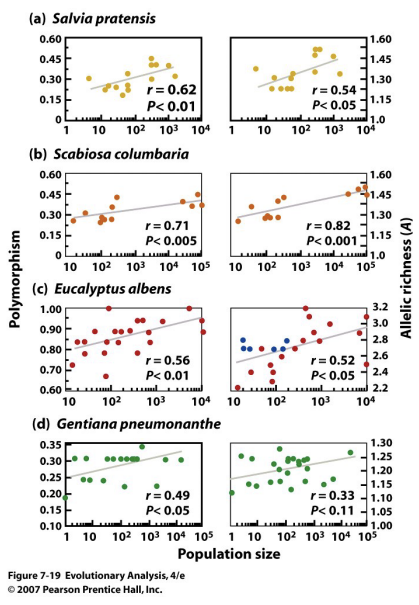
Young and colleagues (1996) compared measures of genetic variation for populations of different sizes (in plants)
Predictions:
As the number of alleles at a locus increases, the fraction of alleles with substantial frequencies increases, resulting in more heterozygotes in the population
However, if a locus is fixed for an allele, there are no heterozygotes in the population
Results:
Genetic polymorphism, allelic richness, and heterozygosity rise and fall together
Small populations had lower levels of polymorphism and allelic richness since drift is more pronounced at small pop sizes.
Young and Colleagues (1996) cont
Young et al. (1996): Habitat fragmentation causes populations to become smaller and more isolated, leading to reduced gene flow, increased inbreeding and genetic drift, and potential loss of genetic diversity. These effects can reduce a population's ability to adapt and survive.
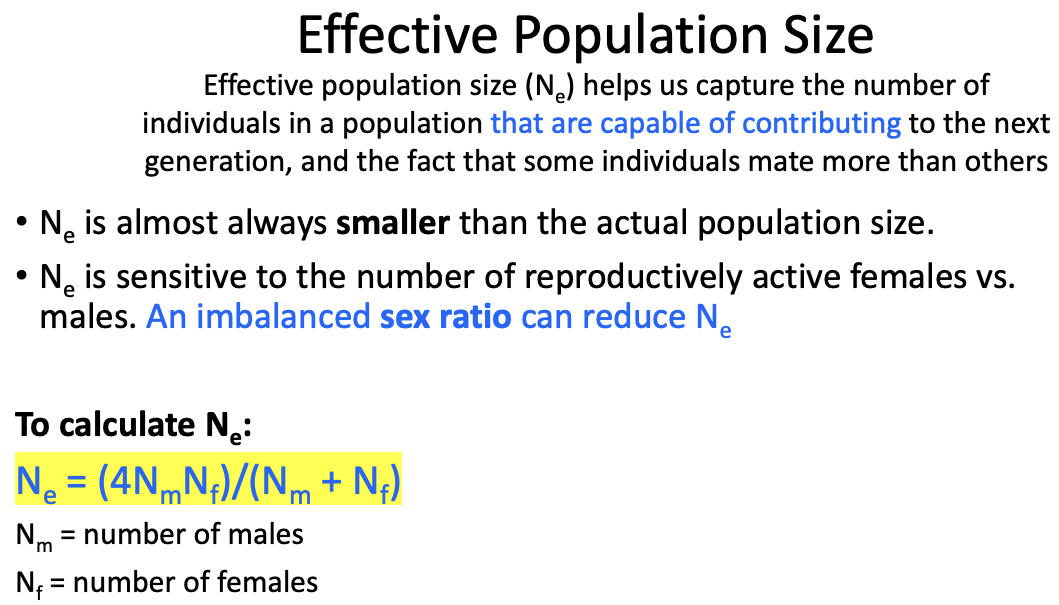
Effective Population Size
Ne?
what does this variable help us determine?
how big is Ne?
what is it sensitive to? what can reduce it?
Nonrandom Mating
what is the most common type of nonrandom mating?
what is the most extreme example of this?
In HWE, we assume that all individuals mate randomly (with respect to genotype). Here, we will relax that assumption.
Important: Nonrandom mating by itself does not cause evolution, but it has interesting indirect effects on evolution.
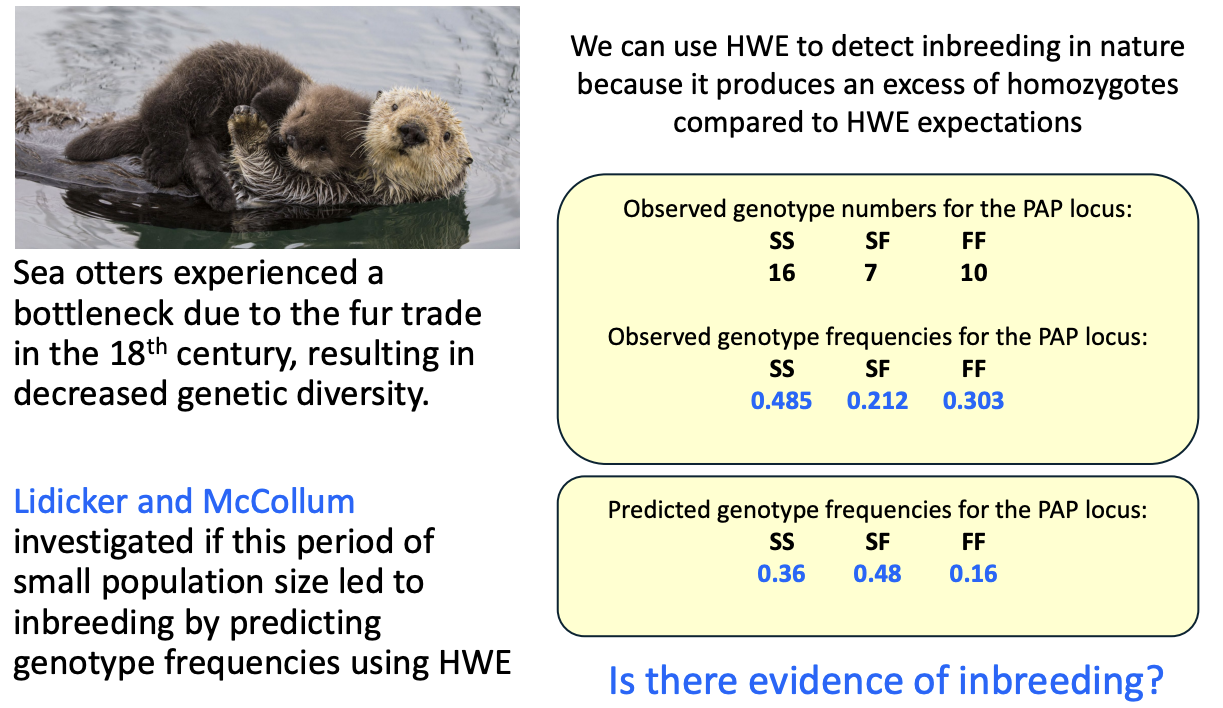
The most common type of nonrandom mating is inbreeding (mating among genetic relatives)
The most extreme example of inbreeding is selfing (self-fertilization)
Selfing Snails ex
what do you see and why?
Why does selfing increase homozygotes and decrease heterozygotes?
Because heterozygous individuals (Aa) produce only 50% heterozygous offspring when selfing, while homozygous individuals produce only homozygous offspring. Over generations, heterozygosity declines and homozygosity increases.
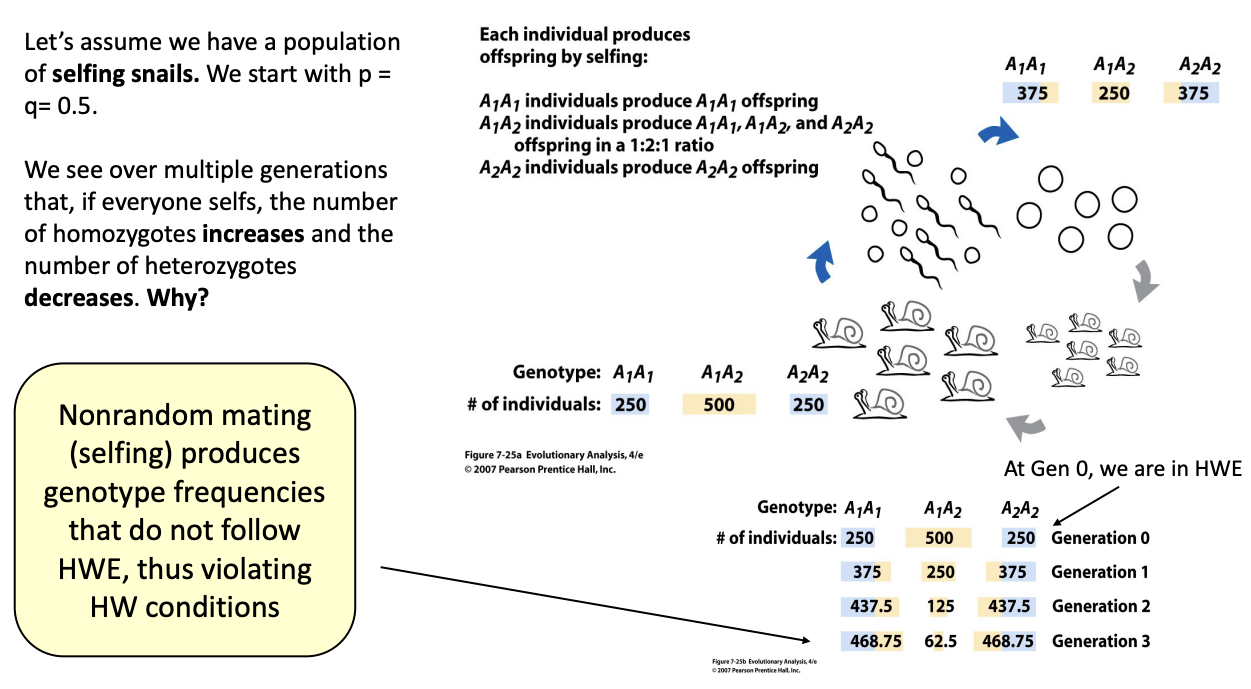
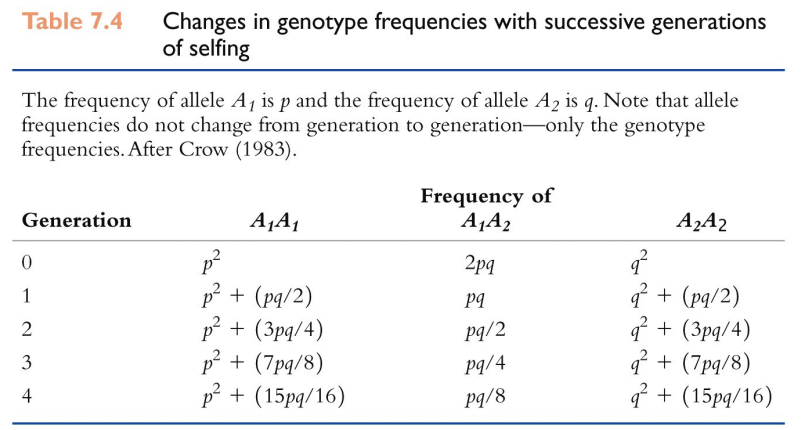
Successive generations of selfing result in what?
Successive generations of selfing result in a deficit of heterozygotes compared to an excess of homozygotes
Note: allele frequencies (p and q) are not changing—everyone is mating—but the genotype frequencies are changing
Lidicker and McCollum
HW Treatment of Inbreeding- F
ex?
what can it be computed directly from?
Inbreeding can lead to increased homozygotes at a slow rate
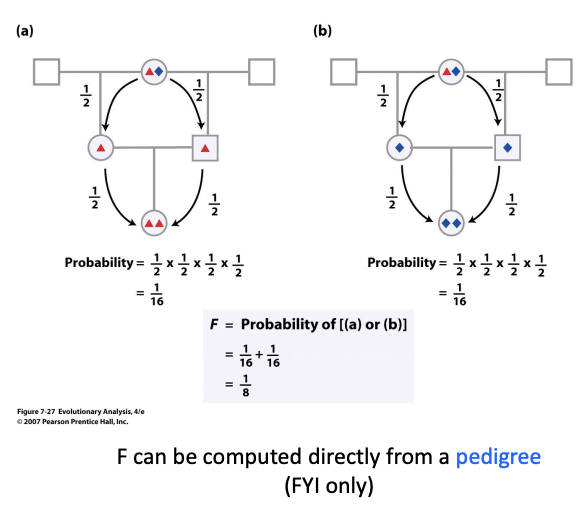
The coefficient of inbreeding (F) = probability that two alleles in any individual are identical by descent (i.e. both alleles came from the same ancestor allele in a previous generation)
F can be computed directly from a pedigree (FYI only)
Example: we have a group of gametes and select an egg with A1. The fraction of sperm also containing the identical allele would be F. The fraction not carrying the identical allele is 1-F.
Inbreeding coefficient (F):
Inbreeding coefficient (F):
F = probability that the two alleles in an individual are identical by descent.
If you choose an egg with allele A₁, the probability the sperm carries the same ancestral copy is F.
The probability it carries a different copy is 1 − F.
Higher FFF means more homozygotes and fewer heterozygotes.
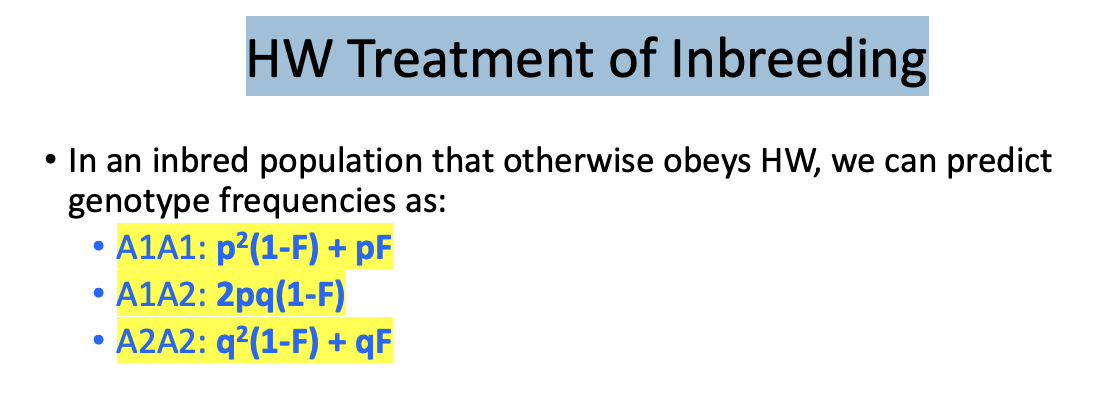
HW Treatment of Inbreeding- Equations
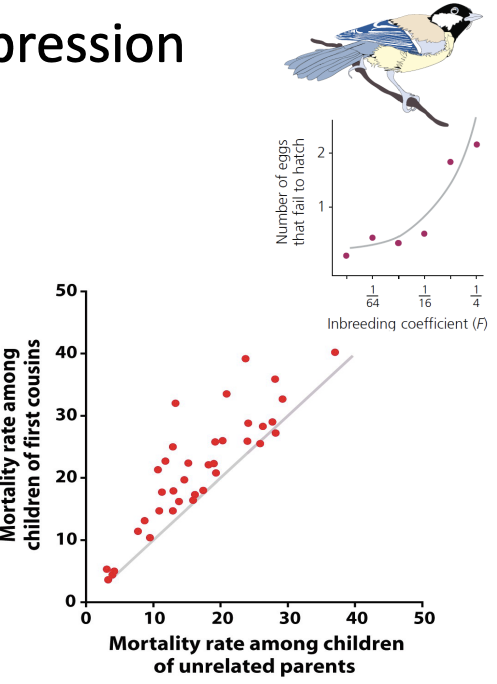
Inbreeding Depression
what is it?
does inbreeding directly change allele frequencies?
Inbreeding depression = inbreeding may lead to decreased fitness if offspring are homozygous for deleterious alleles
Recall that deleterious recessive alleles can be “hidden” from selection in heterozygotes
Inbreeding exposes deleterious alleles to selection because there are more homozygotes in the population than expected!
Inbreeding does not directly change allele frequencies, but it does have evolutionary implications
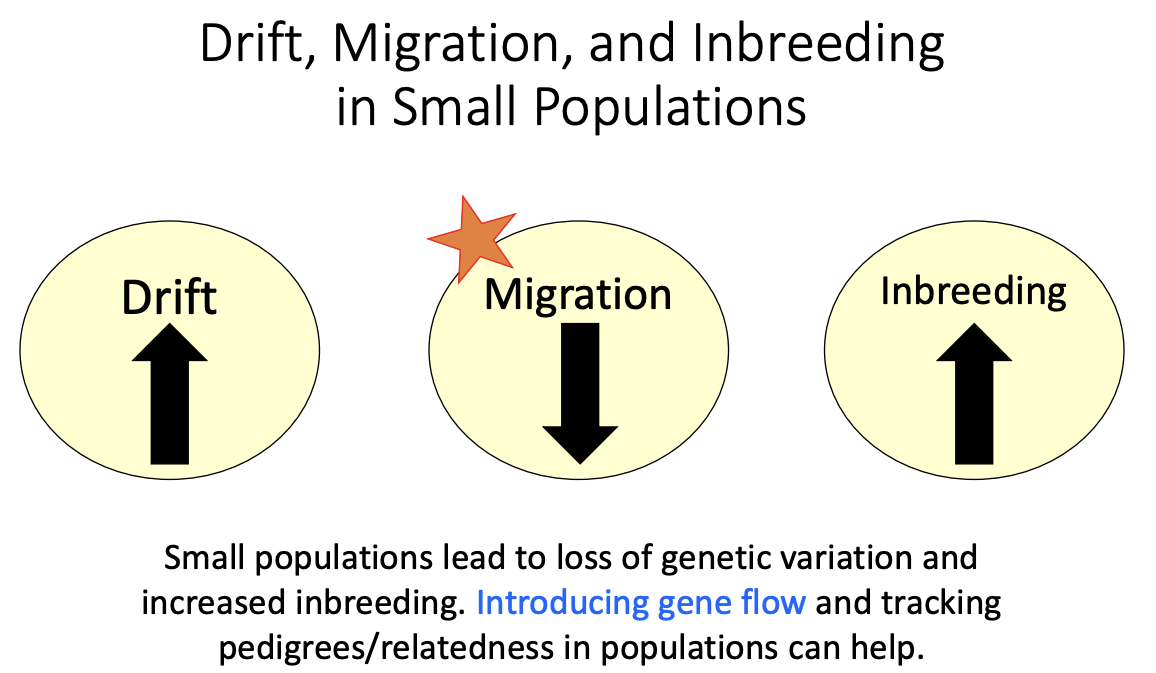
Drift, Migration, and Inbreeding in Small Populations
what increases/decreases
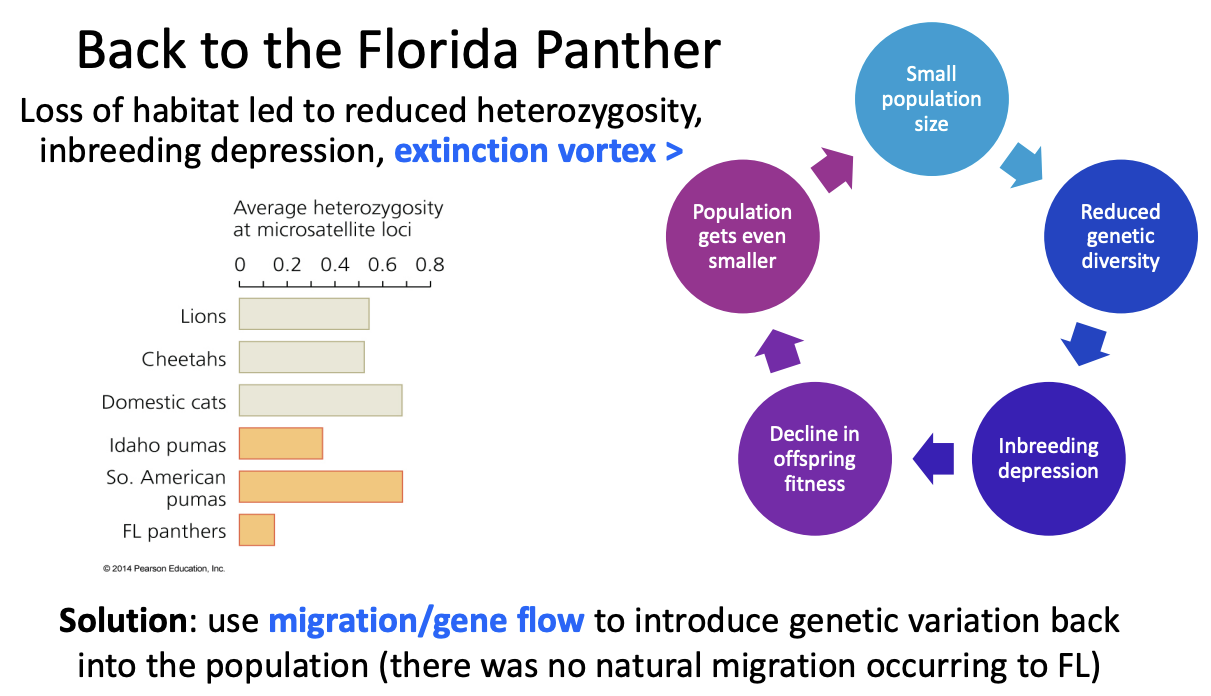
Back to the Florida Panther
what was the problem and solution
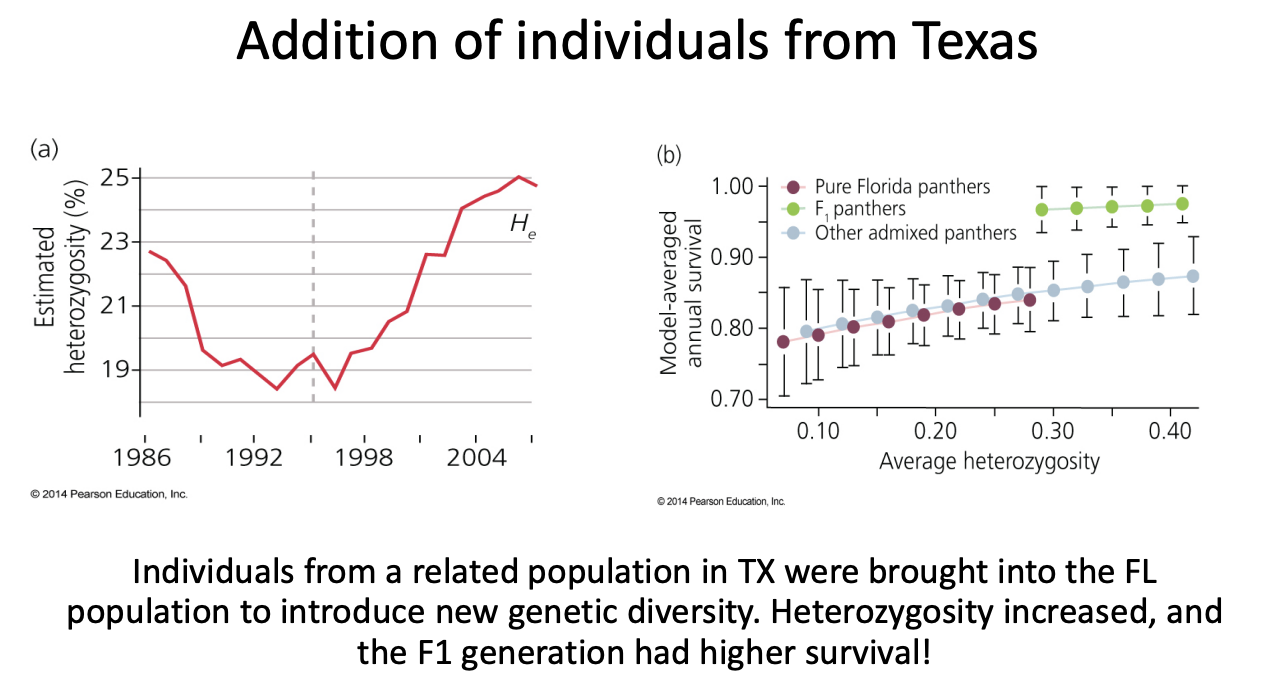
Addition of individuals from Texas
what happened when they brought the Texas panthers to Florida?
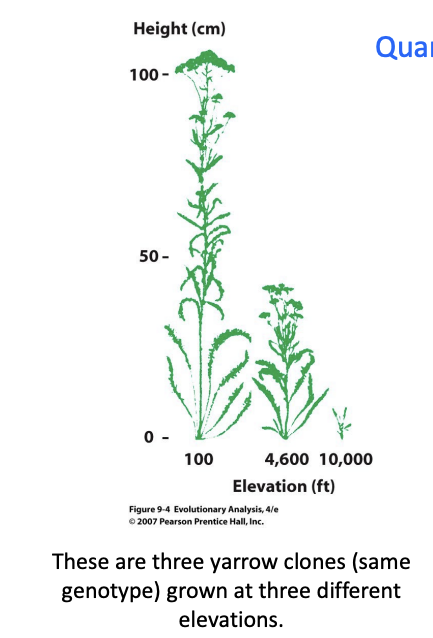
What is a Quantitative Trait?
what does quantitative genetics study?
qualitative traits?
quantitative traits, what are they determined by?
Quantitative genetics studies the evolution of multilocus traits
Qualitative traits = traits that can be assigned to discrete categories (purple or white flowers)
Quantitative traits = traits that show continuous variation that we can measure (ex: height in humans, beak depth in finches)
Quantitative traits are determined by:
Influence of the genotype at many different loci
Environment
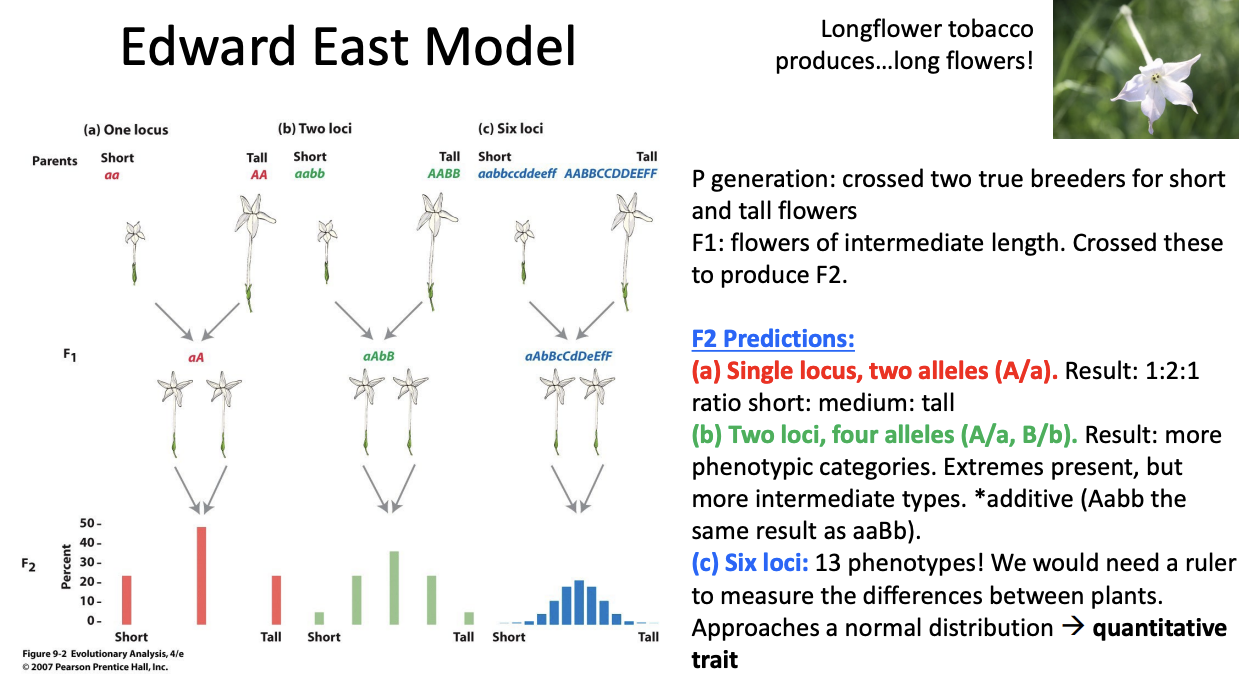
Edward East Model
what did he cross
what were his F1 results
what were his F2 predictions
Edward East's model: As the number of loci controlling a trait increases, the number of possible phenotypes increases. Extreme phenotypes become rare, intermediate phenotypes become common, and the trait approaches a normal distribution, producing a quantitative trait.
Why Don’t We See Many Discrete Classes?
what are quantitative traits determined by?
what can we ask?
Quantitative traits are determined by a combined influence of the genotype at many loci, and the environment!
For any given individual – no way to estimate how much of the phenotype is due to a specific factor (G or E)
Instead, we ask – what proportion of the phenotypic variation in a population is due to a specific factor?
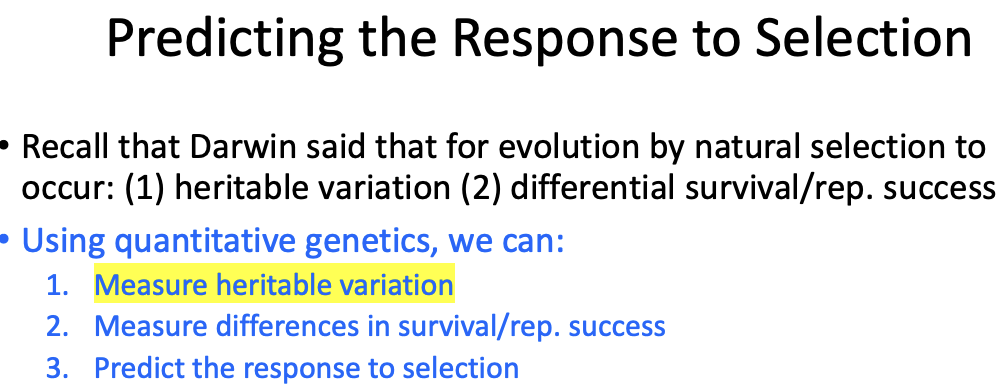
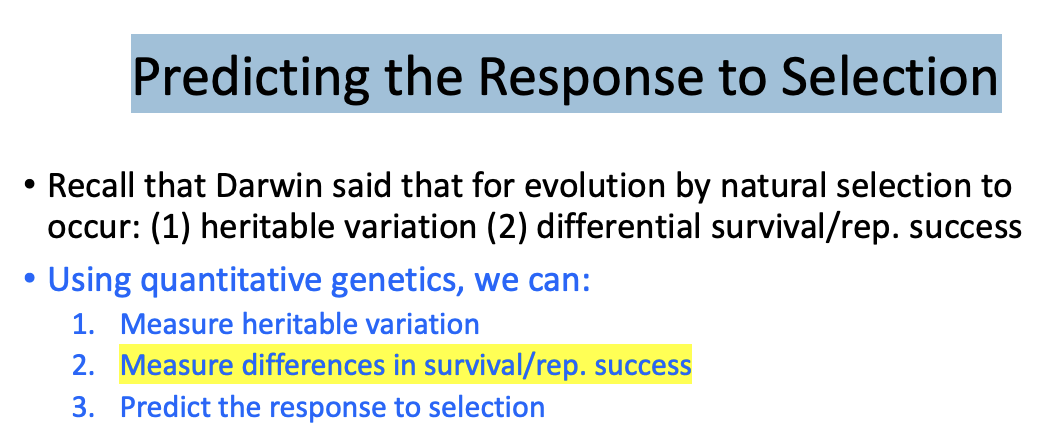
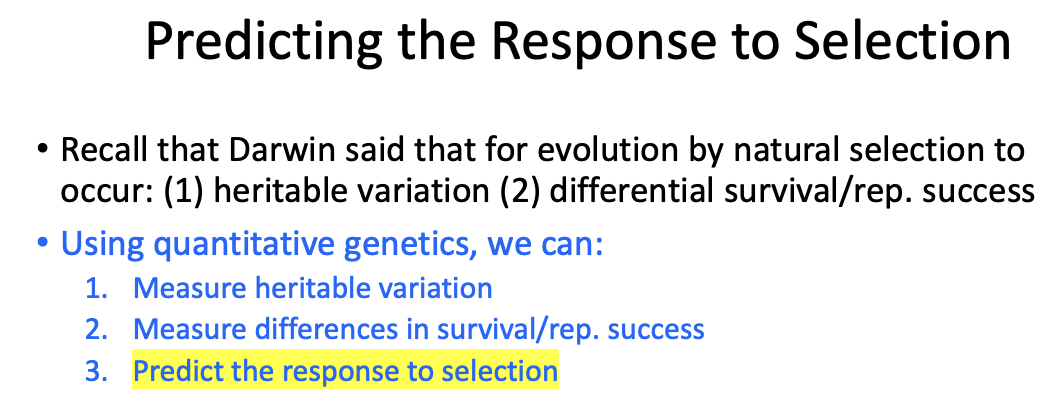
Predicting the Response to Selection
using quantitative genetics what can we do?
what are the two requirements for evolution by natural selection to occur?
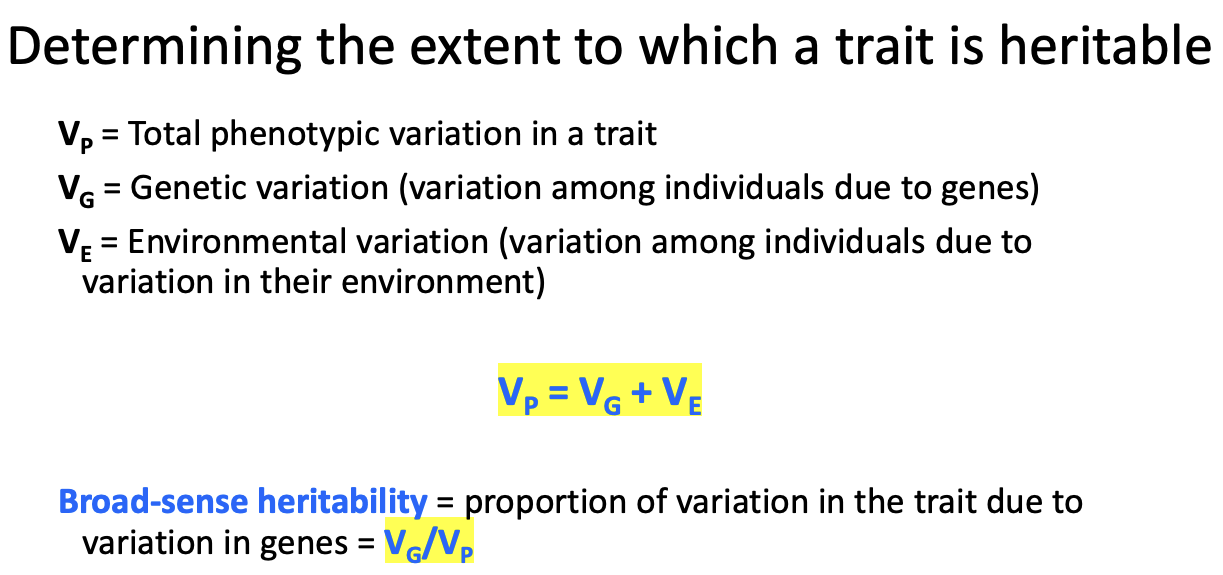
Determining the extent to which a trait is heritable
Vp
VG
VE
broad sense heritability=
Narrow Sense Heritability
Recall: If variation among individuals is due to variation in genes, then offspring should resemble parents
These graphs show us narrow-sense heritability (h2) as the slope of the best fit line
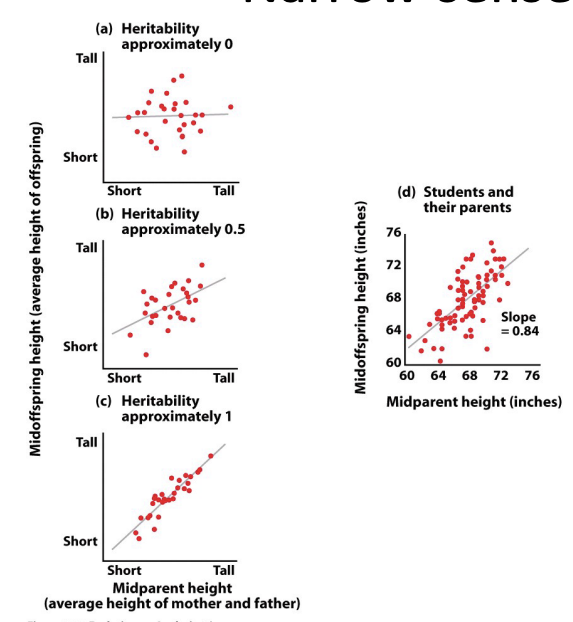
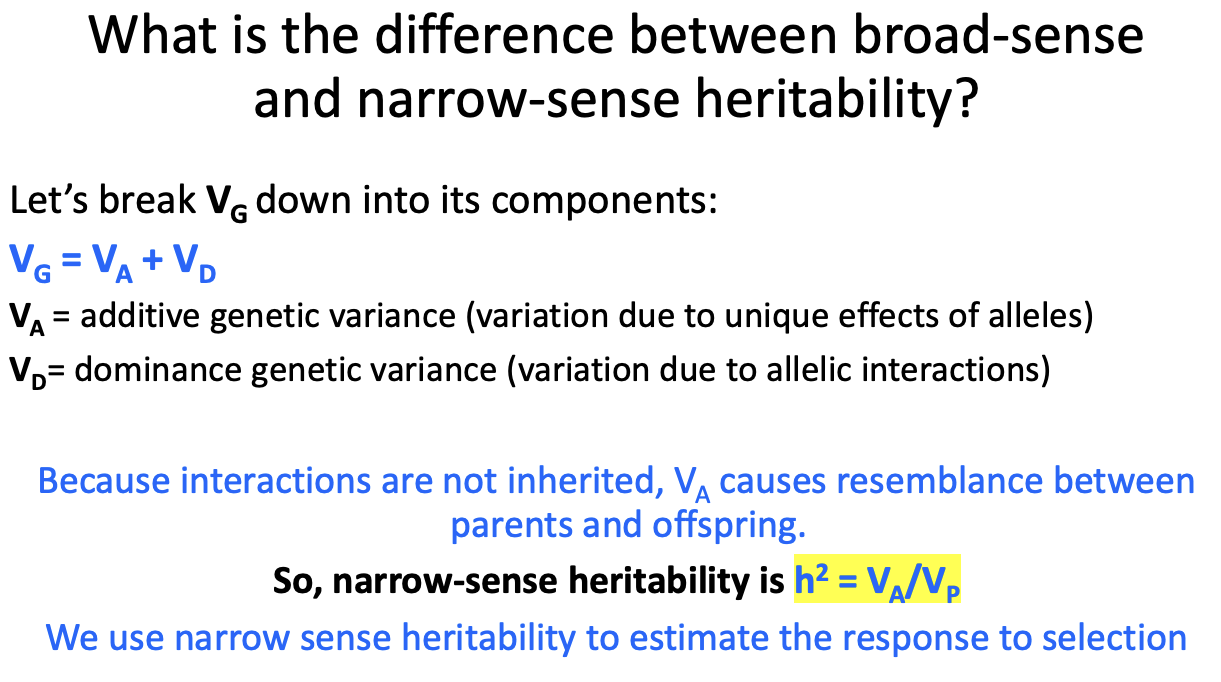
What is the difference between broad-sense and narrow-sense heritability?
VG
VA
VD
narrow sense heritability = (equation)
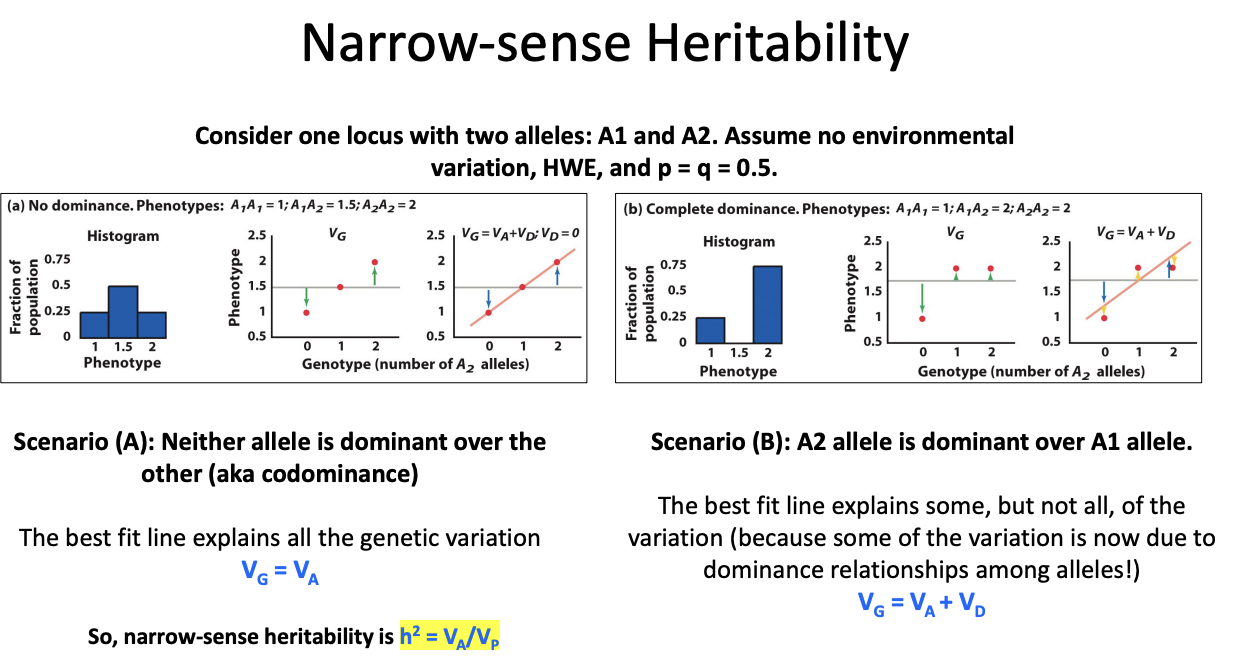
Narrow-sense Heritability
Scenario (A): Neither allele is dominant over the other (aka codominance)- equation used
Scenario (B): A2 allele is dominant over A1 allele.- equation used
Predicting the Response to Selection
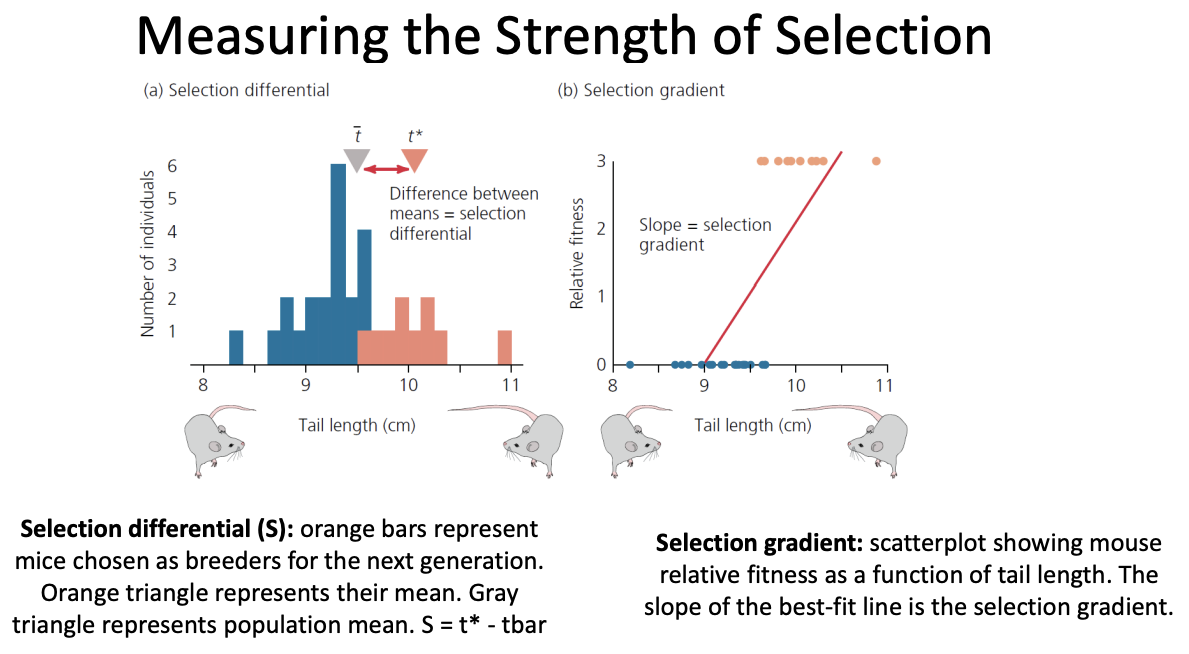
Measuring the Strength of Selection
what two ways can we measure the strength of selection?
(S)
(B)
equation
Selection differential (S)
Selection gradient (B)
B= S/ (var t)
var t= variance in the trait
Selection differential (S)
Selection differential (S) = the difference between the trait mean of the selected individuals and the trait mean of the entire population
Selection gradient (β)
Selection gradient (β) = more broadly applicable measure of selection
Take absolute fitness (ex: total # of offspring an individual has) and divide it by the total population’s mean fitness to calculate relative fitness
Then plot the value of the phenotypic trait (x-axis) vs. relative fitness (y-axis)
The slope of the best-fit line through this plot is the selection gradient
B= S/(var t) where var t = variance in the trait
Measuring the Strength of Selection
mouse example
Predicting the Response to Selection- type 3
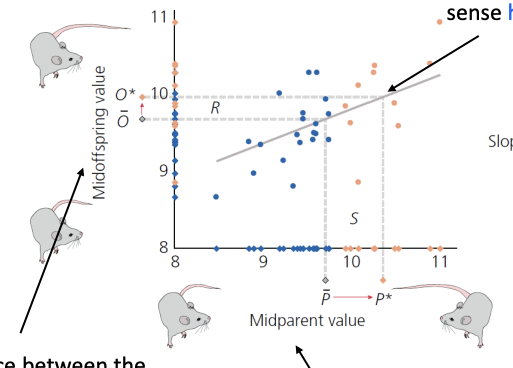
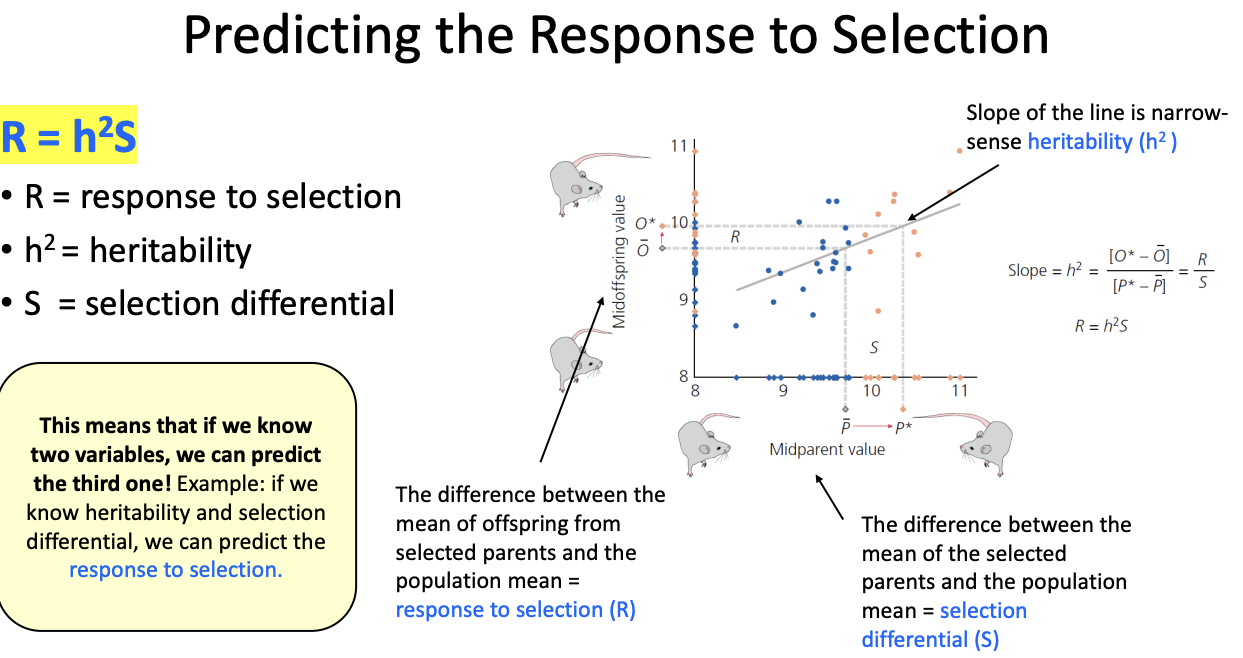
Predicting the Response to Selection
R
h²
S
explain the arrows
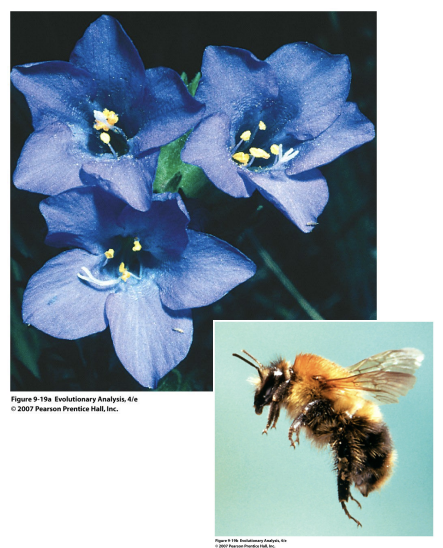
Galen’s (1996) work on Alpine skypilot
timberline populations
tundra populations
Timberline populations – smaller flowers, pollinated by many insects
Tundra populations – larger flowers, pollinated only by bumble bees.
Previous work showed bumblebees were more attracted to larger flowers
Question: Is the difference in flower size a result of natural selection by bumble bees?
R = h2S