Marketing Research Final Exam Study Guide
1/65
There's no tags or description
Looks like no tags are added yet.
Name | Mastery | Learn | Test | Matching | Spaced | Call with Kai |
|---|
No analytics yet
Send a link to your students to track their progress
66 Terms
What is Validation?
Making sure all of the interviews were conducted as specified
ex - Are the respondents who you think they are? Are they legitimate?
What is editing?
Making sure all the questionnaires have been filled out
properly and completely
ex -
Were responses recorded correctly?
Were skip logic patterns correct?
Decide what to do about incompletes, wrong answers,
disengaged
How does your own judgement and bias play a role during this part of the research project?
Decide what to do about incompletes, wrong answers,
disengaged
What is coding?
Process of grouping and assigning numeric codes to responses that can be used for analysis
What is the difference in coding open-ended data vs closed-ended data?
Open-ended questions used because the
researcher either had no idea what answers to expect or wanted a richer response than is possible with a closed-ended question
Coding open-ended questions is tedious and time-consuming and to some degree subjective
What is a Codebook?
The data file is needed to do analysis. The __________________ gives direction on how to properly turn the data collected into a data file.
How do you code a multiple-response question in a database?
Less structured, allows multiple responses
More difficult/expensive to code - classification and free-form with
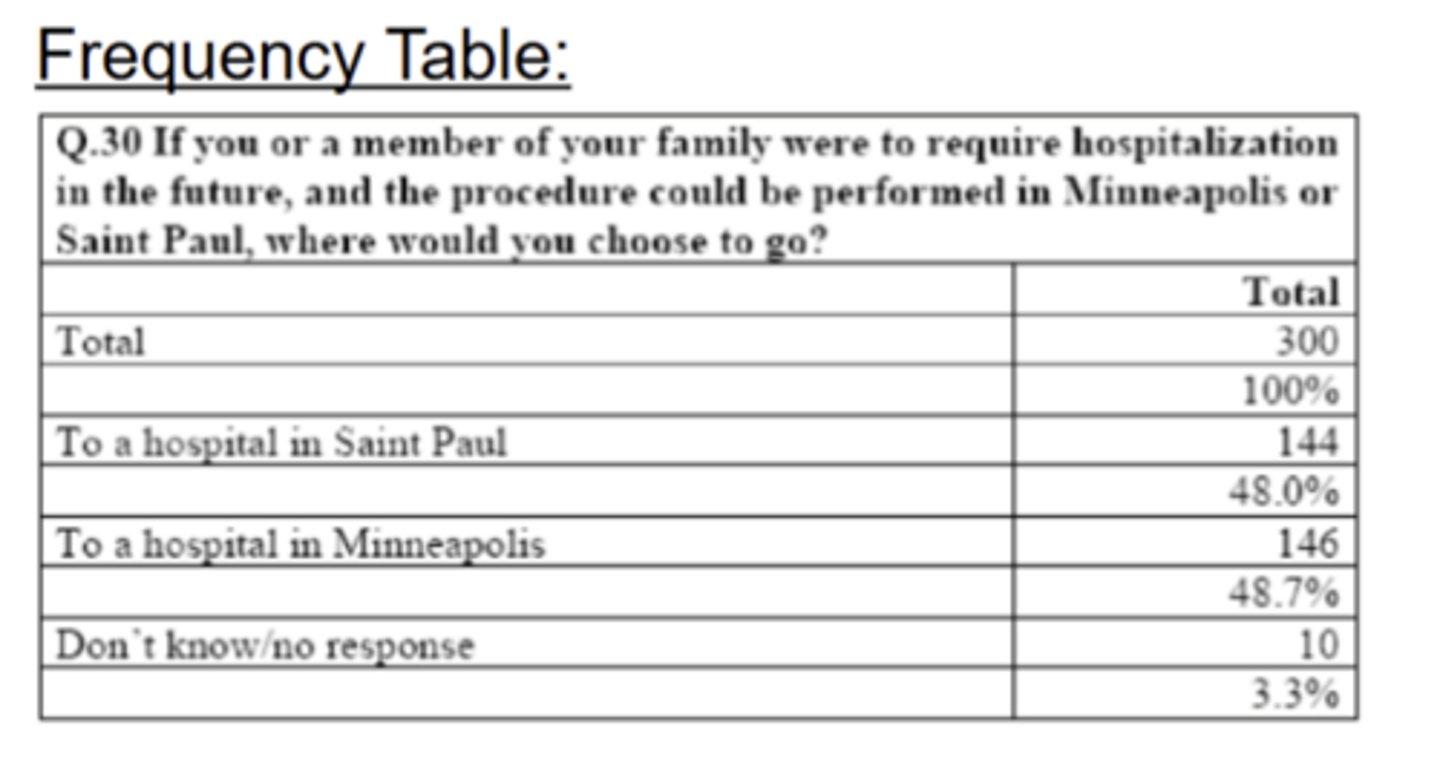
Frequencies: What is it used for/what types of data does it return?
To look at descriptive analytics
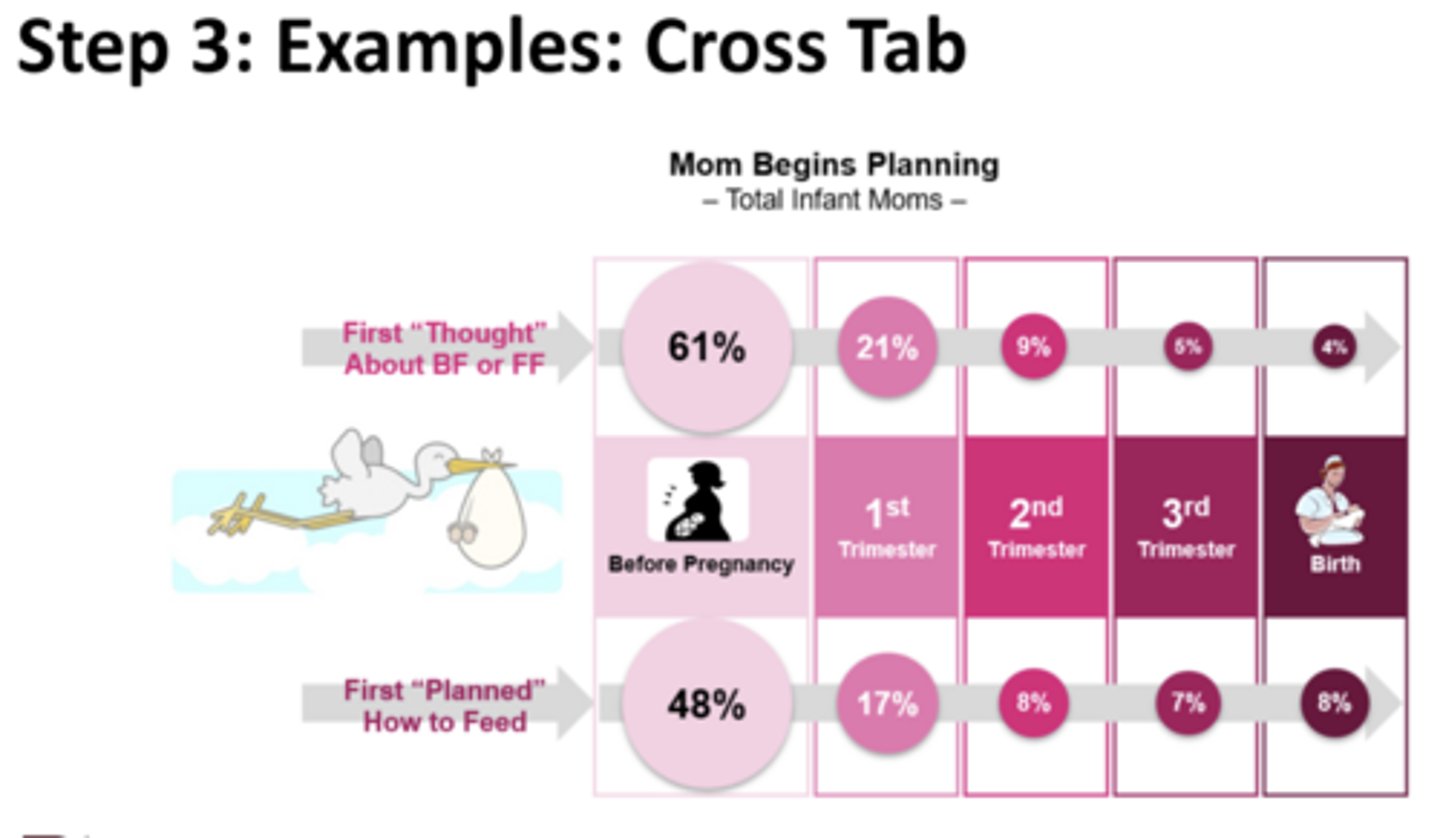
Cross-tabs: What is it used for/what types of data does it return?
Where there are differences
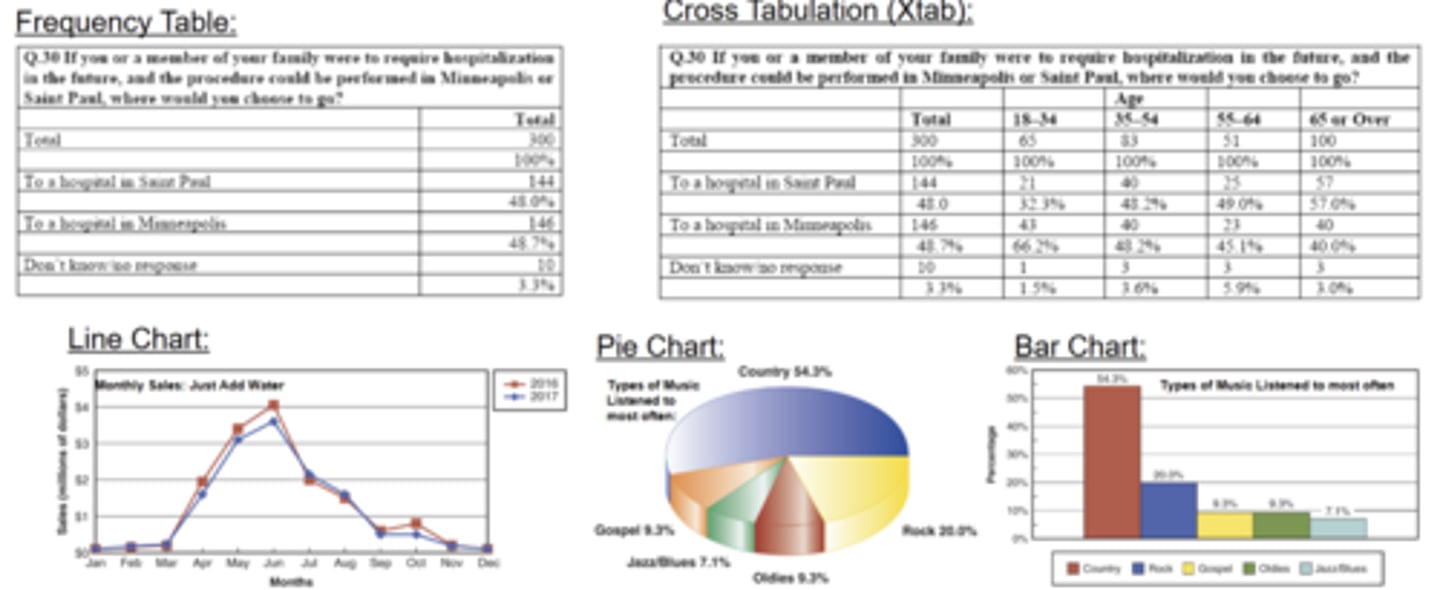
What are the different types of charts/tables?
Frequency Table
Cross Tabulation (Xtab)
Line Chart
Pie Chart
Bar Chart
What are Mathematical Differences?
If numbers are different, it doesn't mean the difference is important or meaningful
What are Managerial Differences?
A difference is important only if results are considered sufficiently different by the manager
What are Statistical Differences?
A difference that is large enough that it is not
likely to have occurred because of chance or sampling error
What is a hypothesis & why should you care?
A supposition or proposed explanation made on the basis of limited evidence as a starting point for further investigation
It allows us to do the statistical testing to prove or disprove our assumptions, identify meaningful insights that can help drive business strategy
How do you state the Hypothesis?
2 forms:
i. Null: H0 [Status Quo]
ii. Alternative: Ha or H1 [Hypothesis of Interest]
iii. These must be stated such that they both cannot be true
What are the different type of stat tests?
Chi square
T-test(independent sample)
Paired Sample T-Test
One-way ANOVA
Z-Test
What is a Chi square?
One categorical independent variable and one categorical dependent variable
Used for Categorical/Nominal Data
Determines whether the observed pattern of frequencies "fit" an expected pattern.
What is a T-test(independent sample)?
One categorical independent variable with only 2 groups and one continuous dependent variable with - Mean
Used for testing Means/Continuous data (Interval or Ratio data)
Determines whether 2 groups differ on some characteristic assessed on a continuous measure
What is a Paired Sample T-Test
(used for pre/post- and same measure to different objects) - Mean
Used for testing Means/Continuous data (Interval or Ratio data)
Compares 2 means when scores for both variables are provided by the same sample, such as before/after
What is a One-way ANOVA
Has one continuous dependent variable & one categorical independent variable with 2 or more groups - Mean
If you have >2 groups, use One-Way ANOVA
What is a Z-Test?
One categorical independent variable with 2 groups and one dependent variable with proportion
Used for testing proportions (Nominal, Interval, or Ratio data)
Compares two independent groups & determines if one is greater than or less than another based on confidence
intervals
Significance levels that determine whether to reject or fail to reject the null hypothesis: How do you decide on your alpha level?
balancing the risk of a Type I error (false positive) against the consequences of a Type II error (false negative), usually set at 0.05, 0.01, or 0.10 based on research context
What is a decision rule?
Unlikely to get sample result that is exactly equal to the value of the
population parameter...is that deviation because of chance?
b. Significance levels (α: alpha) that determine whether to reject or fail to
reject the null hypothesis
i. .10, .05, .01 => the probability that is considered too low to justify acceptance of H0
c. Rejection of the null hypothesis is equivalent to supporting the alternative
Why is it important to reduce the risk of errors in your conclusions of your research data? (False Positives and False Negatives)
Increase α value and sample size (n)
Note: Increasing alpha value increases your risk of type I error (False Positive)
How do sample size, alpha values, and confidence intervals play a role in reducing risk and sampling error. (Larger sample sizes, larger alpha values, lower confidence intervals = less risk of a false positive or negative)
type I error (α error): Rejection of H0 when, in fact, it is true [Confidence Level]
type II error (β error): Failure to reject the null when, in fact, it is false [Power (n)]
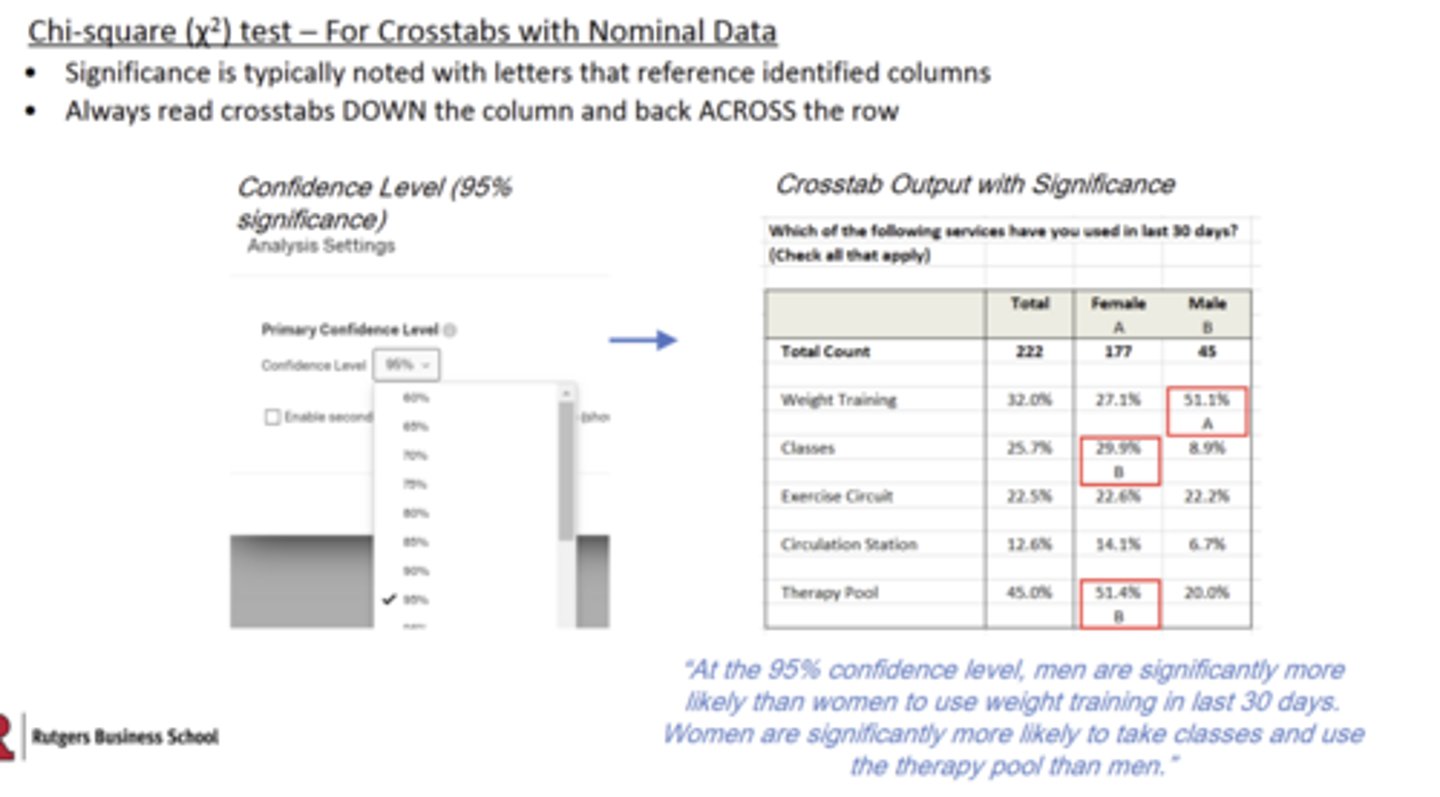
How do you read significance testing on a chart
What is univariate?
Analyzing each variable separately
What is bivariate?
Analyzing relationship between 2 variables
What is multivariate?
Analyzing multiple measurements on each individual/object under study simultaneously
What is an independent variable?
Variables believed to affect the value of the dependent variable (Y)
What is an dependent variable?
Variable to be explained or caused by the independent variable (X)
What is Regression used for?
A statistical technique used to derive an equation
representing the influence of a single
(simple regression) or multiple (multiple
regression) independent variables on a
continuous dependent, or outcome,
variable
Be able to read the statistical output & determine the strength of the model, if it's significant, which independent variables are significant and how do they impact the dependent variable (direction of relationship)
Step 1: Does the set of predictors explain a statistically significant portion of variation in the dependent variable?
• Look at the ANOVA table results.
Step 2: How much of the variation in the dependent variable does our set of predictors explain?
• Look at the coefficient of multiple determination.
Step 3: Which of the individual predictors explain variation in the dependent variable, and what is the direction of the relationship
(positive or negative)?
• Look at the t-values and p-values of the individual predictors.
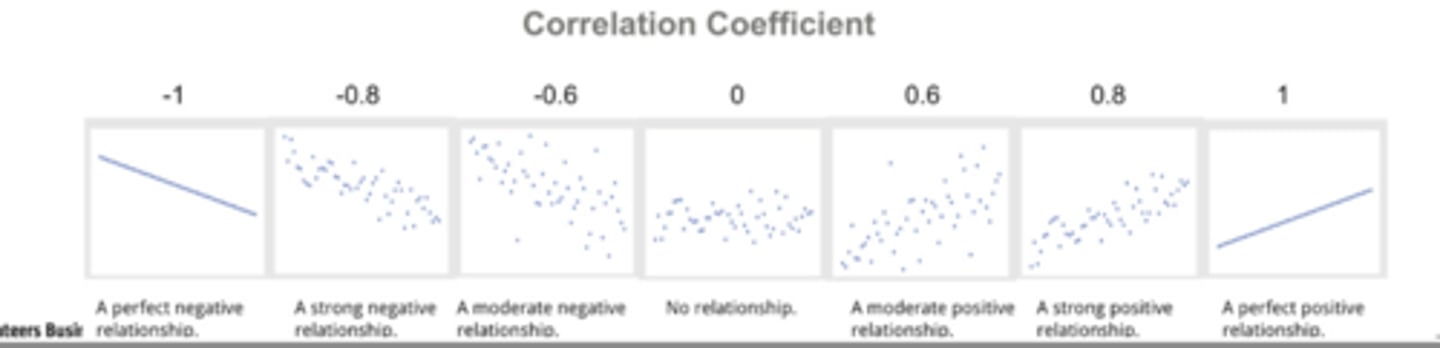
Be able to identify the output and understand how/why these types of analysis would be used - Correlation Analysis:
Measures the degree to which changes in one
variable (the dependent variable) are associated
with changes in another
2 variables: Bivariate (Simple) Correlation
Coefficient of Correlation R: Describes the
degree of association between X and Y
Value of R can range from -1 (perfect negative
correlation) to +1 (perfect positive correlation); the
closer R is 1, the stronger the degree of association.
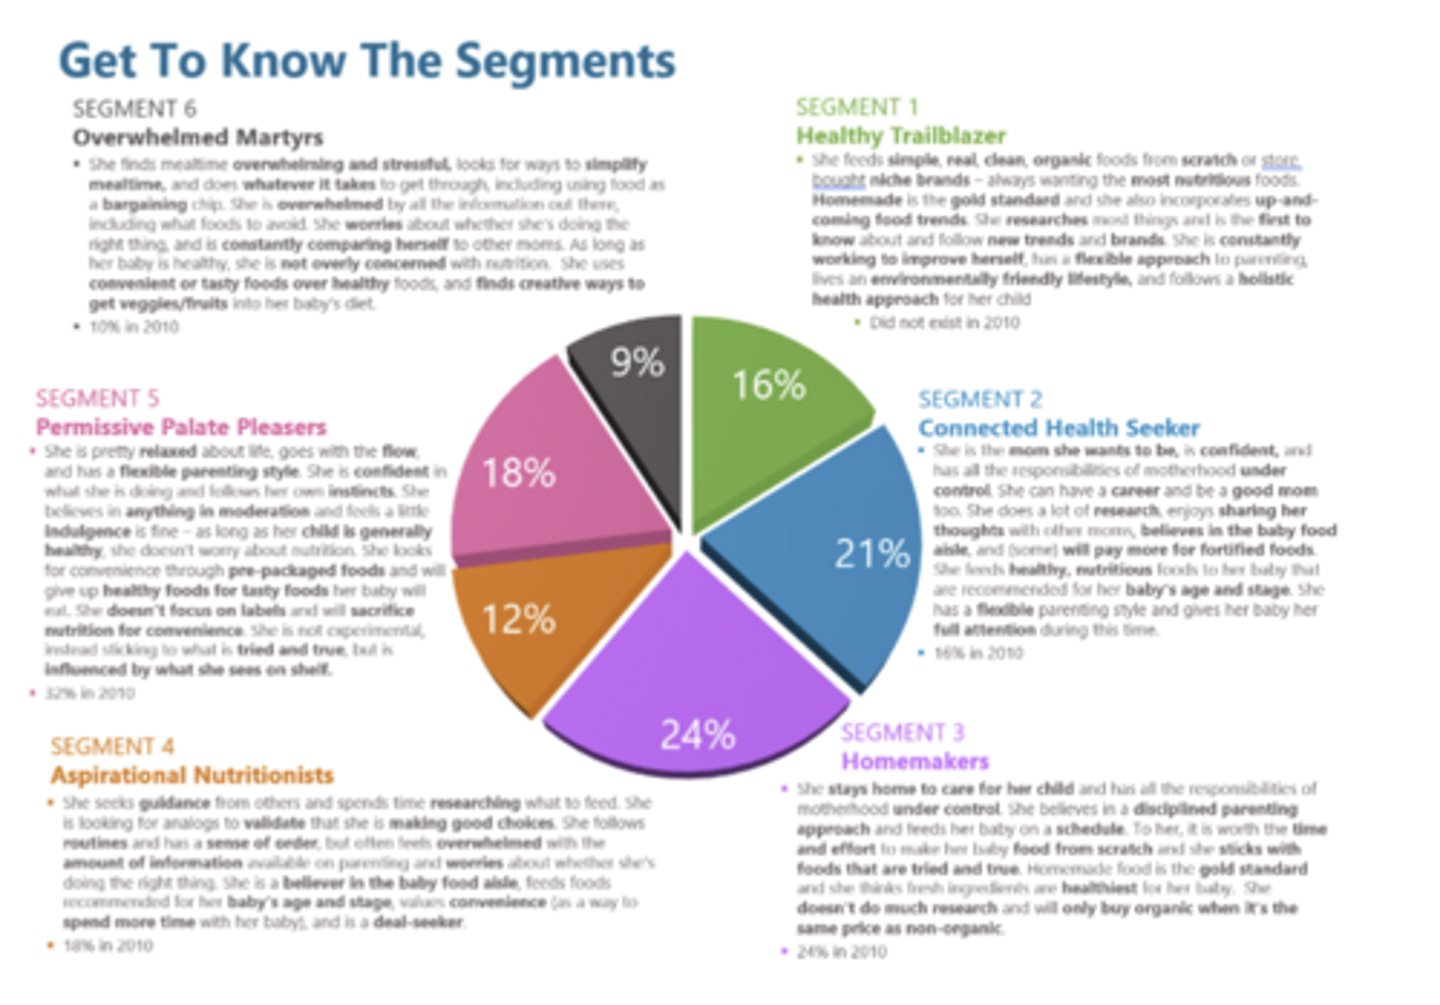
Be able to identify the output and understand how/why these types of analysis would be used - Cluster Analysis:
Identifies subgroups of objects or people that are similar in regard to certain variables or measurements
○ Subgroups are mutually exclusive and exhaustive groups so that those within a group are as similar as
possible
○ Homogeneous internally (within clusters) and heterogeneous externally (between clusters)
○ Not an optimization technique - applies judgement & knowledge of market to decide on a solution
○ No dependent variable
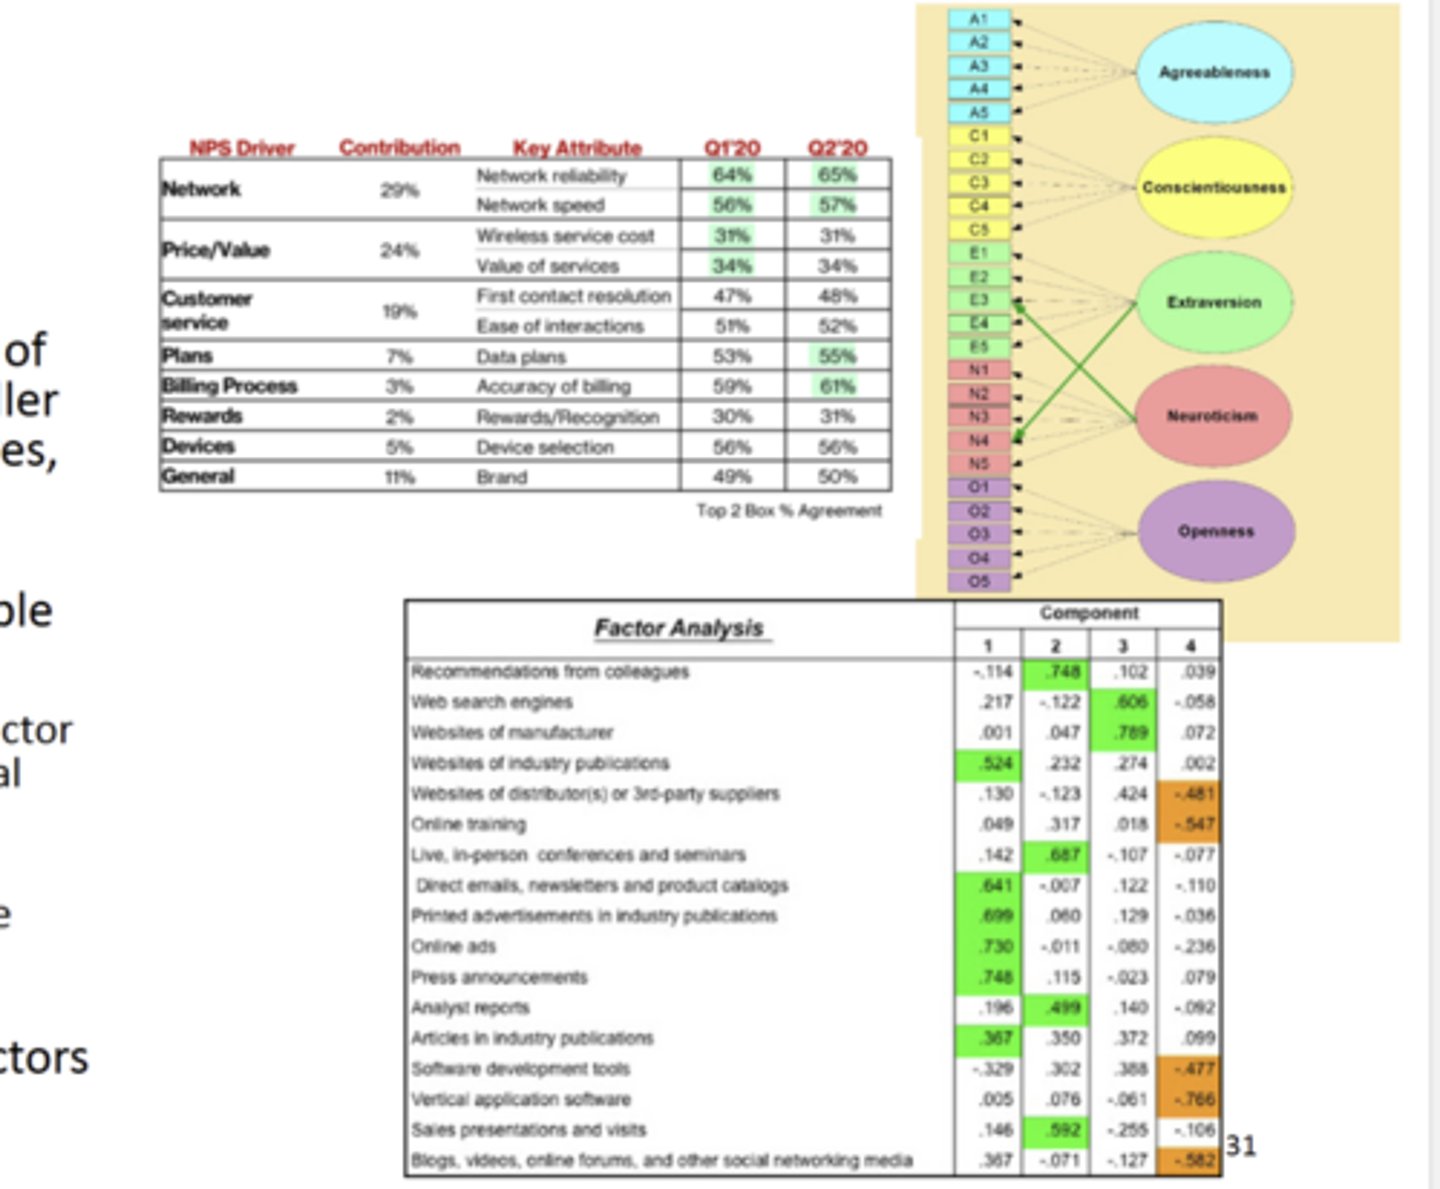
Be able to identify the output and understand how/why these types of analysis would be used - Factor Analysis:
Data simplification
• Summarizes the information contained in a large number of metric measures with a smaller number of summary measures, called factors or composite variables
• There is no dependent variable
• Factor Loadings:
• Correlation between each factor score and each of the original ratings variables.
• Each correlation coefficient represents the loading of the associated variable on the particular factor
• Judgement in naming the factors
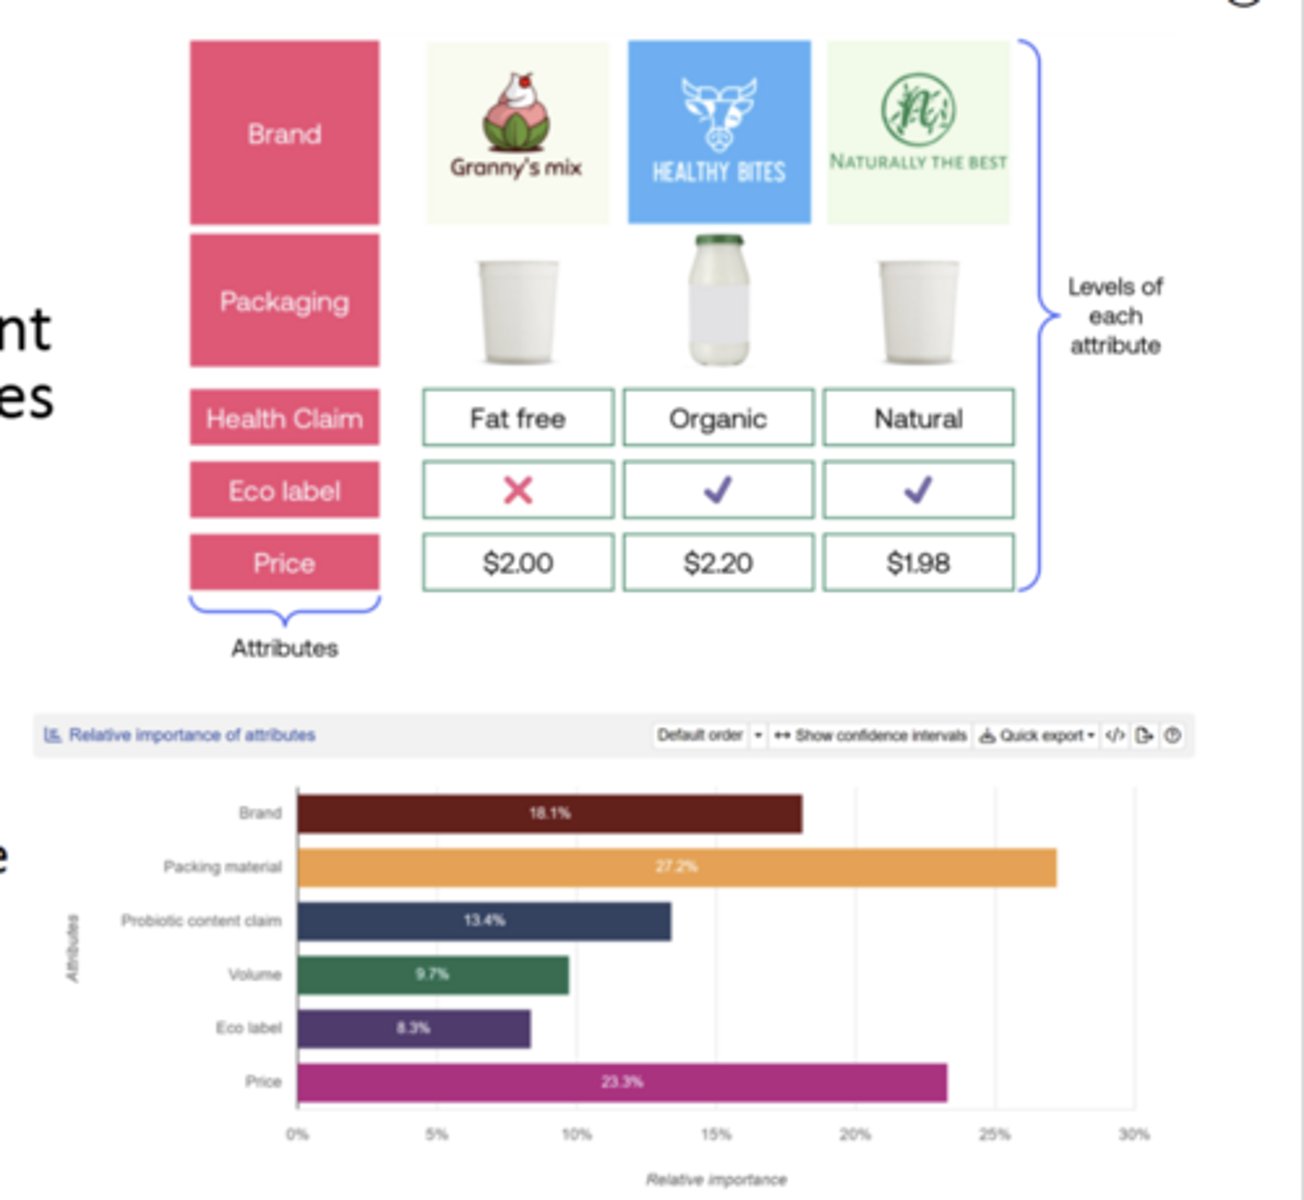
Be able to identify the output and understand how/why these types of analysis would be used - Conjoint Analysis:
Quantifies the value that consumers associate with different levels of product/service attributes or features
○ Simulates buyers choice with respondents making tradeoffs
○ Tradeoffs imply simultaneous attribute evaluation & indirect estimation of attribute importance
○ Can be artificial (respondents more deliberate in research context)
○ Presentation of options must be randomized; # of attributes tested need to be considered
What is included in an executive summary?
The key findings
Can be 1-3 pages: Can have charts/data with the finding OR just a page with bullets where you show the charts/data in the detailed findings.
What is the flow of a typical market research report?
1. Title Page (with group number, team member names, date)
2. Table of Contents
3. Background & Objectives: The Problem to be Solved(from the Research Brief)
4. Research Methodology: How You Did the Work
5. Executive Summary: The Big A-Ha's!
6. Recommendations: How You Recommend Solving the Problem
7. Detailed Findings
8. Appendix
What is typically included in the Appendix of a market research report?
Copy of actual questionnaire
Information relating to sampling, such as maps marked with locations of where the interviewing took place
Supporting data tables as relevant
How to get started when writing a market research report?
What are the non-negotiables of your market research report?
Do NOT include crosstabs that have been exported and copy/pasted from Qualtrics. It’s your job as a researcher to recreate the key points into a format (bullets, table, chart, graphic) that your client can read. Make sure to
What is CSAT?
customer satisfaction score, is a commonly used metric that indicates how satisfied customers are with a company's products or services. It's measured through customer feedback and expressed as a percentage (100% would be fantastic - 0% would be terrible).
What is CES?
Customer Effort Score, measures easy/difficulty
What is NPS (Know the calculation & the scale)?
What is the best/worst score you can have?
What are the two scenarios you can have for NPS=0?
Net Promoter Score (NPS) is a customer loyalty metric calculated by subtracting the percentage of detractors (0-6) score from the percentage of promoters (9-10) score based on the question: "How likely is it that you would recommend [Company] to a friend or colleague?". The scale ranges from (-100) (worst) to (+100) (best)
Scenario 1: Mixed Sentiment: You have an equal number of detractors and promoters (e.g., \(40\%\) Promoters, \(40\%\) Detractors, \(20\%\) Passives).
Scenario 2: High Passives/No Feedback: You have no promoters and no detractors—everyone is a passive (e.g., \(0\%\) Promoters, \(0\%\) Detractors, \(100\%\) Passives). [1, 2, 3, 4]
What variables are considered in a business decision?
both quantitative and qualitative variables to determine the best course of action
Key factors include financial impacts (costs, revenues, ROI), available resources (time, staff), market conditions (competition, trends), risks, and strategic alignment.
What is Business Success?
finding the intersections of good for the business AND the customer
How to break down silos?
increasing communication and removing barriers to collaboration to improve organizational efficiency and align teams around a shared, company-wide mission
What is CX research?
Customer Experience research is the systematic process of gathering and analyzing customer feedback and behavioral data across all brand touchpoints to understand their needs, emotions, and pain point
What is UX research?
User Experience Research is the process of studying target users' behaviors, needs, and motivations to inform the design and development of products
What is Design Thinking?
is a human-centered, iterative approach to problem-solving that prioritizes empathy for the user to develop innovative solutions
Why is it important to review the frequencies of all of the questions in your survey?
It is critical for Data Cleaning. You review them to ensure your survey logic (like skip patterns) worked correctly and to identify "dirty" data, such as "straight-liners" (people who gave the same answer to everything) or outliers that could skew your results.
In Qualtrics, is the number of responses shown on the data screen the number of completes? Why or why not? If not, how can you see how many completes you have collected?
No, the number on the Qualtrics "Data & Analysis" screen is usually not just the "completes". It often includes partial responses, screen-outs, and previews. The displayed total represents all Recorded Responses, which includes anyone who started the survey and met partial completion settings, not just those who reached the end.
Filter the Data: In the "Data & Analysis" tab, filter by the Finished variable. Set it to Finished = 1 to show only completed surveys.
Crosstabs, what is bucketing?
a data reduction technique that groups detailed, individual data points (categories or numerical ranges) into broader, manageable categories or "buckets". This process makes complex data sets easier to analyze, read, and interpret by reducing fragmentation and revealing trends.
Crosstabs, what do the capital letters signify?
typically signify statistically significant differences between columns at a high confidence level
When analyzing crosstabs, what type of variables should generally be placed in the banner?
independent variables—most commonly demographic or classification variables—should generally be placed in the banner (the columns)
What is the most important part of the research brief? (Objectives) AI & Reporting watchouts: What types of things can go wrong? - Drawing conclusions with low base sizes:
Drawing big conclusions from a small group (e.g., $n < 30$) leads to unreliable data.
What is the most important part of the research brief? (Objectives) AI & Reporting watchouts: What types of things can go wrong? - Mixing up subgroups:
Blending different types of customers (e.g., heavy users and non-users) into one average, which hides the real story.
What is the most important part of the research brief? (Objectives)AI & Reporting watchouts: What types of things can go wrong? - Forgetting about brands/variables that play an important role in the analysis:
Forgetting to include key competitors or market factors that influence the results.
What is the writing guideline that Seth Cohen shared to write clear and Impactful reports and presentations?
Everything in the research must point back to the specific business decision being made.
Every slide and every data point must answer "So what?" to provide clear business implications rather than just being a "data dump."
What is the difference between the Brand NPS and the Base Calibration studies and why does it matter? (From Emmanuel's NPS presentation)
Brand NPS: Measures how the general market perceives your brand.
Base Calibration: Measures the NPS specifically within your own customer database.
Why it matters: It identifies the "perception gap" between what the public thinks and what actual customers experience.
What is Data Fusion and what does it allow for?
It is a holistic view of all variables, regardless of which dataset they "live" in
What is Data Fusion and what does it allow for - How do you find common variables to "fuse"?
Fused results allow for views of all variables for both datasets
A holistic view of all variables - regardless of which dataset they "live" in
Analysis of relationships between variables never measured together in the same survey (e.g., NPS from one source + support tickets from another)
Prediction for non-respondents - estimate NPS for every customer in your database, not just the small fraction who took a survey
Correction of methodological bias - adjust for differences like incentivized vs non-incentivized, or panelists vs random customers
Richer customer understanding - link survey attitudes (e.g., likelihood to recommend) with behavioral data (e.g., purchase frequency, returns, churn)
Cost efficiency - avoid asking every customer every question; ask different groups different things and fuse the results
Driver analysis across populations - identify what drives NPS for different customer segments, even if each segment answered different survey questions
What are the benefits of knowing how each of your individual customers feel about you at any given moment - what kind of marketing implications does that have --> Proactive CRM: Promotions (Refer a Friend, BOGO, Free)
You can send "Refer a Friend" or BOGO deals specifically to Promoters.
What are the benefits of knowing how each of your individual customers feel about you at any given moment - what kind of marketing implications does that have --> Reactive IVR/Call Centers/Digital: Churn prediction & actions
You can use Churn Prediction to have call centers reach out to Detractors before they leave.
What are the benefits of knowing how each of your individual customers feel about you at any given moment - what kind of marketing implications does that have --> ROI
It allows for precise marketing spend on the individuals most likely to respond, increasing the return on investment.