8.23 - Experience & choice under uncertainty
1/18
There's no tags or description
Looks like no tags are added yet.
Name | Mastery | Learn | Test | Matching | Spaced | Call with Kai |
|---|
No analytics yet
Send a link to your students to track their progress
19 Terms
explanation of CRE simply & effect of experience
subjects don’t evaluate using real probabilities – use decision weights
Experience may reduce the distortion effect (away from true prob -> towards true prob)
Task experience
Experience gained from repeating a task
provides familiarity with decision problem + allows for reflection
Task less new each time
Repeated choice task WILL involve task experience
Outcome experience
Experience gained from learning about results
seeing how uncertainty resolved
What outcome would have happened if chose the other option
Not necessarily gained in repeated choice
Van de Kuilen & Wakker (2006) - OV
Subjects repeatedly make 2 choices per round (15 rds total) between lotteries with Common Ration structure
s - safe reward r - risky reward (scaled down with CRE) r > s > 0 AND 0.8r > s
Risk neutral would always pick risky
p of r = 0.8 p of s
2 feedback conditions
No feedback - Outcome of lotteries not determined until end
TE gained but no OE
Feedback - In each rd and for each task, uncertainty resolved as subject rolls die to determine outcome of chosen option and records it on decision-sheet, where unchosen option still visible
TE + OE (both result obtained and alternative if other choice chosen)
Task order randomised to avoid confounding experience with change in payoff parameters
Incentive - 1 lottery chosen and paid out at end of experiment (no wealth effect)
Van de Kuilen & Wakker (2006) - RESULTS
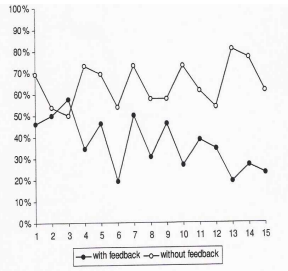
% of EUT violations (CRE or reverse) per round
With no feedback – the trend is mostly flat / slight up
TE has almost no effect on reducing EUT violations
Feedback - violations trending downwards
OE does reduce EUT violations and subjects behaves more like ST predicts
Proportion of subjects choosing consistently with expected value maximisation (max EV) rises
Learn to EV maximise
selecting risky option in both problems
~ 27% in R1 → ~ 58% in R15.
Matches field evidence - Starmer 2000
Van de Kuilen & Wakker (2006) - Why CRE falls
Experience through:
Die rolling - see how high prob of 0.8 really is to 0.2
Comparing outcome with alternative not picked
Mix
In scaled UP with feedback, if subject selected safer - sees could’ve has r 80% of the time
Drives subjects to choose risky so risky chosen in both (consistent preferences)
Bone et al. (1999) - OV
Studies different forms of experience
Task-repetition & Group discussion
3 stage experiment
12 individual choices with Common Ratio triples (3 choice problems with 2 scaled down versions)
Same choices with doubled payoffs BUT now in pairs and must agree on joint choice and division of prize AFTER GROUP DISCUSSION
Same as stage 1
We compare S1 - S3 to see effects of discussion
Bone et al. (1999) - RESULT
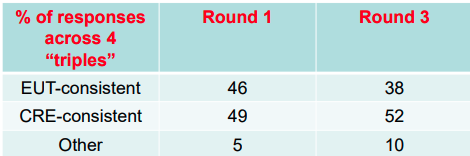
TE + Discussion doesnt eliminate CRE
CRE increases a bit
Description or experience
In almost all experiments on choice under risk we’ve covered, subjects see (for each option) a complete, verbal and/or numerical description of all possible outcomes and their probabilities
Matches complete information assumption for choice under risk
In reality we often dont have complete information (true probabilities mainly)
Instead, we gradually learn from experience - learn true probabilities
Maybe results are artefacts of full description - Inverse S probability weighting function just seen in experiments
Example of non-fully descriptive experiment
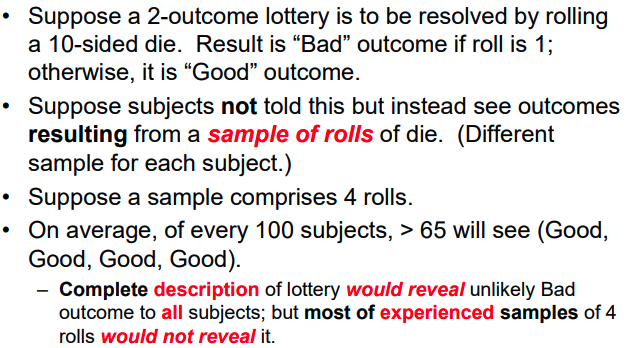
Experience doesn’t reveal bad outcome but description does
Reasons why non-full descriptions change behaviour
Sampling bias - small samples may not match true probabilities
Different presentation of information - e.g. sequential release of sample
Ambiguity - When information is from a sample, subjects may realise that it might not match true probability
plus people tend to be adverse to ambiguity
Cubitt et al. (2022) - OV
Studies if there is a Description-Experience (DE) gap
Study probability weighting functions
80 choices per subject between 2 monetary outcomes with probability in 1/40 units
Options resolved by drawing virtual cards with different colours
4 treatments
Cubitt et al. (2022) - treatments
Description - subjects sees probability of all colours
Experience-Unambiguous - Subjects see all 40 cards one at a time and are told it is the full deck
Experience-ambiguous - Same as EU but do not know if 40 seen are the whole deck
Experience restricted - Same as EA but sample is only 18 cards
focus on cases where sample under-represents rare colour
Sampling bias in play
Cubitt et al. (2022) - treatment rational
Description vs EU - identical information but manipulated fully-revealed vs sequential
EU vs EA - Manipulates if they know for sure all possibilities
tests for lack of certainty about probability & experience
EA vs ER - Subjects dont know size of deck but manipulated sample size
test for effect of small sample bias
Cubitt et al. (2022) - RESULTS: D vs all experience
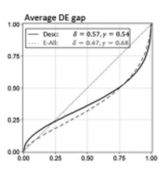
Inverse-S curve seen for Description BUT not for aggregate of all experience treatments
smaller range of over-weighting than usual (inflection ~ 0.2)
Cubitt et al. (2022) - RESULTS: D vs EU
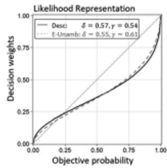
Almost no difference
Both Inverse S with low over-weighting
Cubitt et al. (2022) - RESULTS: EU vs EA
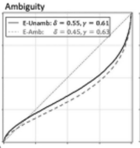
Knowing seen full deck has a small effect
some evidence of ambiguity aversion
Almost no over-weighting
Cubitt et al. (2022) - RESULTS: EA vs ER
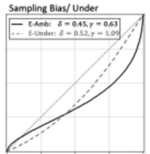
If ER sample underrepresents low-prob event, subjects under-weight it
Main driver of DE gap
Low prob events overweighted under description + all other experience
Inverse-S not an artefact of description
Cubitt et al. (2022) - takeaways
Choices and probability-weights affected by whether uncertainty described to subjects or inferred from sampling experience
especially if experienced sample under-represents a rare event.
Main driver of observed DE gap is sampling bias (from ER treatment)
Aggregate prob-weighting function is Inverse-S for both Description & experience (with controlled out sampling bias)
Implication - Inverse-S probability-weighting not artefact of Description
BUT bias in small samples may counter overweighting of low-prob events by distorting information, when uncertainty leaned about from small samples
Caveat - Results only applicable where information about uncertainty is only available from limited experience