[CHAPTER 5] Psychological Assessment
1/67
There's no tags or description
Looks like no tags are added yet.
Name | Mastery | Learn | Test | Matching | Spaced | Call with Kai |
|---|
No analytics yet
Send a link to your students to track their progress
68 Terms
Reliability
A synonym for dependability or consistency.
Reliability
It refers to consistency in measurement.
Reliability Coefficient
___________ is an index of reliability, a proportion that indicates the ratio between the true score variance on a test and the total variance.
Classical Test Theory
In ____________, a score on an ability test is presumed to reflect not only the testtaker’s true score on the ability being measured but also error.
Error
It refers to the component of the observed test score that does not have to do with the testtaker’s ability.
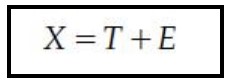
Observed score, true score, error
If we use X to represent an ________, T to represent a ________, and E to represent ________, then the fact that an observed score equals the true score plus error may be expressed as follows:
Variance
A statistic useful in describing sources of test score variability.
Variance
What symbol is this?

Standard Deviation Squared
Variance is ____________________.

True Variance
Variance from true differences is ____________.
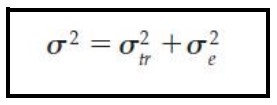
Error Variance
Variance from irrelevant, random sources is ____________.

Reliability
It refers to the proportion of the total variance attributed to true variance.
True Variance
The greater the proportion of the total variance attributed to __________, the more reliable the test.
Score Consistency
A systematic source of error would not affect ____________.
True
True or False
If a measuring instrument such as a weight scale consistently underweighed everyone who stepped on it by 5 pounds, then the relative standings of the people would remain unchanged.
Systematic Error
A ___________ source does not change the variability of the distribution or affect reliability.
Test Construction
Test Administration
Test Scoring and Interpretation
Other Sources of Error
4 Sources of Error Variance
Item Sampling or Content Sampling
It is one source of variance during test construction.
Item Sampling or Content Sampling
It refers to a variation among items within a test as well as to variation among items between tests.
The test creator is challenged to maximize the proportion of the total variance that is true variance and to minimize the proportion of the total variance that is error variance.
They have to pick a sample of questions. If they pick a bad sample, it introduces error.
Attention or Motivation
Sources of error variance that occur during test administration may influence the testtaker’s ______________.
The testtaker’s reactions to those influences are the source of one kind of error variance.
Room Temperature
Level of Lighting
Amount of Ventilation and Noise
Examples of untoward influences during administration of a test include factors related to the Test Environment:
Pressing emotional problems
Physical Discomfort
Lack of Sleep
Effects of Drugs or Medication
Potential sources of error variance during test administration (Testtaker Variables):
Examiner’s physical appearance and demeanor
Presence of absence of an examiner
Potential sources of error variance during test administration (Examiner-related Variables):
Computer Scoring
_________ virtually have eliminated error variance caused by scorer differences in many tests.
If subjectivity is involved in scoring, then the scorer (or rater) can be a source of error variance.
Other Sources of Error
This type of error variance comes down to human nature: People don't always tell the truth on tests or surveys.
Testtaker's personal motives, emotions, or fears can severely distort the results.
They tend to “underreport” and “overreport”
Test-Retest Reliability Estimates
Parallel-Forms and Alternate-Forms Reliability Estimates
Split-Half Reliability Estimates
3 Types of Reliability Estimates
Test-Retest Method
Using the same instrument to measure the same thing at two points in time.
The result of such an evaluation is an estimate of test-retest reliability.
Test-Retest Reliability
It is an estimate of reliability obtained by correlating pairs of scores from the same people on two different administrations of the same test.
Test-Retest Reliability
This measure is appropriate when evaluating the reliability of a test that purports to measure something that is relatively stable over time.
E.g., personality trait
Coefficient of Stability
Time is a massive source of error variance.
The longer you wait between the first and second test, the more life happens. People grow, learn, or experience things that alter their true score.
Because of this, if you wait more than six months between tests, psychometricians give the result a special name ____________.
This metric tells you not just that the test is consistent, but that the psychological trait itself has remained stable over a long period.
Estimate of Test-Retest Reliability
_____________ may be most appropriate in gauging the reliability of tests that employ outcome measures such as reaction time or perceptual judgments.
Including discriminations of brightness, loudness, or taste.
Even if you only wait a few days or weeks to minimize the "time" error, human brains still get in the way and mess up the reliability estimate.
E.g., Memory: testtaker might simply remember the answers they bubbled in on the first test and just repeat them, artificially inflating the reliability.
Parallel-Forms and Alternate-Forms Reliability Estimates
Instead of giving the exact same test twice (Test-Retest), you create two completely different versions of the test that measure the exact same thing.
It solves the "memory" problem.
E.g., If a student takes Form A on Monday and Form B on Wednesday, they can't just memorize their answers from Monday because the questions are completely different.
Expensive and exhausting for a researcher to write two completely valid, reliable tests.
Because the questions are different, we bring back the "item sampling" error.
Parallel Forms
For two tests to be truly "parallel," they must have the exact same average score (mean) and the exact same spread of scores (variance) when given to a group.
Alternate Forms
These are tests designed to have the exact same level of difficulty and cover the same content, even if they aren't mathematically perfect twins.
Coefficient of Equivalence
When you correlate the scores of Parallel Forms and Alternate Forms, you get the _________________.
Split-Half Reliability Estimates
It is obtained by correlating two pairs of scores obtained from equivalent halves of a single test administered once.
It is a practical way to check if an instrument is internally consistent by administering the test just once.
Divide: Split the test items into two equivalent groups.
Correlate: Calculate the correlation (Pearson r) between the scores of the two halves.
Adjust: Use the Spearman-Brown formula to correct the final number.
3 Steps of Computation of Coefficient (Split-Half Reliability)
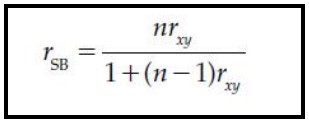
Spearman-Brown Formula
It allows a test developer or user to estimate internal consistency reliability from a correlation of two halves of a test.
True
True of False
By determining the reliability of one half of a test, a test developer can use the Spearman-Brown formula to estimate the reliability of a whole test.
Because a whole test is two times longer than half a test, n becomes 2 in the Spearman-Brown formula for the adjustment of split-half reliability.
The symbol rhh stands for the Pearson r of scores in the two half tests.
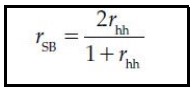
Spearman-Brown Formula
If test developers or users wish to shorten a test, the _____________ may be used to estimate the effect of the shortening on the test’s reliability.
Speed Tests
Heterogeneous Tests
Internal consistency estimates (like split-half) assume all the items are measuring the exact same thing at a reasonable pace. Therefore, they are useless for _______ and _______.
Inter-Item Consistence
The Kruder-Richardson Formulas
Coefficient Alpha
Other Methods of Estimating Internal Consistency
Inter-Item Consistency
It refers to the degree of correlation among all the items on a scale.
Instead of chopping the test in two (like the Split-Half method).
It looks at the relationships between every single question on the test all at once.
It is calculated from a single administration of a single form of a test.
Useful in assessing the homogeneity of the test.
The more a test focuses on a single, narrow topic (homogeneity), the more the individual questions will agree with each other (inter-item consistency), making the final score much easier to understand and interpret.
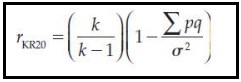
KR-20 (Kuder-Richardson Formulas)
It is specifically designed for dichotomous items.
Means there are only two possible outcomes—like True/False questions, or multiple-choice questions where the answer is strictly graded as "Right" or "Wrong."
It mathematically compares every single item on the test to every other item to see if they are all pulling in the same direction.
KR-21
It was designed as a quick, rough estimate of KR-20.
To make the math easier, _____ assumes that every single question on the test is exactly the same level of difficulty.
In the real world, this is almost never true.
Coefficient Alpha
The preferred statistic for obtaining an estimate of internal consistency reliability.
It is widely used as a measure of reliability, in part because it requires only one administration of the test.
Most commonly known as Cronbach's Alpha.
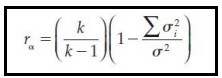
Coefficient Alpha
Unlike a Pearson r, which may range in value from -1 to +1, this typically ranges in value from 0 to 1.
0: Absolutely no consistency. The questions have nothing in common.
1: Perfect consistency.
Coefficient Alpha
___________ is appropriate for use on tests containing nondichotomous items.
E.g., "Rate your exhaustion from 1 to 5"
Inter-Score Reliability
"Do the graders agree with each other?"
It is also commonly called inter-rater or observer reliability.
This concept measures how consistent two or more humans are when they look at the exact same performance, essay, or test.
Coefficient of Inter-Scorer Reliability
In Inter-Score Reliability, you take the list of scores given by Grader A and the list of scores given by Grader B, and you run a standard statistical correlation between them.
The resulting number is called the _____________.
If that number is highly positive (close to 1.0), it proves your judges are perfectly in sync.
Test-Retest Reliability
What reliability formula match the test?
If a company wants to measure an employee's performance over a full year, the test must prove it is stable across time.
Estimate of Internal Consistency
What reliability formula match the test?
If a correlational study is measuring the danas ng commuter (commuter experience) to see how daily transit fatigue predicts academic persistence, it is highly likely the undergraduate participants are only being given the survey exactly once.
Homogeneity vs. Heterogeneity of Test Items
Dynamic vs. Static Characteristics
Restriction or Inflation of Range
Speed Tests vs. Power Tests
Criterion-Referenced Tests
5 Things Psychometricians look at before calculating reliability
Homogeneity vs. Heterogeneity of Test Items
Is the test laser-focused on one single topic, or does it cover a wide variety of different subjects?
Dynamic vs. Static Characteristics
Is the trait being measured constantly changing (dynamic), or does it stay relatively the same over a lifetime (static)?
Restriction or Inflation of Range
Are the test scores spread out widely from 0 to 100, or did everyone score tightly between 85 and 90?
Speed Tests vs. Power Tests
Is the test trying to see how fast you can answer easy questions before time runs out (Speed), or is it trying to see if you can solve incredibly difficult questions with no time limit (Power)?
Criterion-Referenced Tests
Is the test comparing you to a strict standard (like a driving test where you either pass or fail), rather than comparing you to other students?
Domain Sampling Theory
A test’s reliability is conceived of as an objective measure of how precisely the test score assesses the domain from which the test draws a sample.
Imagine you want to test someone's knowledge of the English dictionary (the "Domain"). The domain is an ocean of hundreds of thousands of words. You cannot possibly ask them to define every single word. So, you scoop up a small bucket of 50 words to put on your test (the "Sample").
Internal Consistency
__________ is the best way to measure reliability in Domain Sampling Theory.
Generalizability Theory
It is based on the idea that a person’s test scores vary from testing to testing because of variables in the testing situation.
Given the exact same conditions of all the facets in the universe, the exact same test score should be obtained.
This test score is the universe score, and it is, as Cronbach noted, analogous to a true score in the true score model.
Generalizability Study
It examines how generalizable scores from a particular test are if the test is administered in different situations.
It argues that scores change for very specific, measurable reasons, and we can mathematically isolate exactly what those reasons are.
Examines how much of an impact different facets of the universe have on the test score.
Decision Study
Once the Generalizability Study is complete and the developers know exactly what influences the scores, they run a _________.
This study asks: "Now that we know how this test behaves in the real world, is it actually useful?"
Item Response Theory
_______________ procedures provide a way to model the probability that a person with X ability will be able to perform at a level of Y.
Often called Latent-Trait Theory.
"Latent" - hidden or unobservable.
It allows test creators to build incredibly precise instruments by picking and choosing individual items based on their exact difficulty and discrimination levels, ensuring the test perfectly measures the specific group of people it is designed for.
Standard Error of Measurement
Often abbreviated as SEM or SE(m).
Provides a measure of the precision of an observed test score.
It provides an estimate of the amount of error inherent in an observed score or measurement.
Test is highly reliable, SEM goes down.
Test is unreliable, SEM goes up.
Confidence Interval
A range or band of test scores that is likely to contain the true score.
It’s a "buffer zone" around the observed score.
Standard Error of the Difference
"Is the difference between these two scores actually real, or is it just a fluke caused by random error?"
Because both scores you are trying to compare have their own invisible buffer zones, you need a new mathematical tool to combine those errors.
This tells you if the gap between the scores is large enough to matter.