Business Analytics Final Exam
1/88
There's no tags or description
Looks like no tags are added yet.
Name | Mastery | Learn | Test | Matching | Spaced | Call with Kai |
|---|
No analytics yet
Send a link to your students to track their progress
89 Terms
Data overload
the access or exposure to too much data that prevents data from being properly synthesized and interpreted
SOAR Analytics model
it is the major framework for developing a business analytics mindset. It is composed of 4 steps:
1. Specify the Question
2. Obtain the Data
3. Analyze the Data
4. Report the Results
1
Specify the Question
2
Obtain the Data
3
Analyze the Data
4
Report the Results
Structured Data
data that is organized in a specific, predefined manner, making it easily readable and understandable by both humans and machines
2 types of structured data
Categorical data and Numerical data
categorical data
data that is categorized into groups that are represented either by words or by non-meaningful numerical data
categorical data
ex. grouping by age, categorizing transaction types, or specifying inventory costing method
numerical data
meaningful numbers that represent quantities
numerical data
ex. transaction amount, age, net income, or score on an exam
2 types of categorical data
nominal data and ordinal
nominal data
o categorical data that cannot be ranked (summarized through counting and grouping or proportion)
nominal data
ex. country of origin and transaction type
ordinal data
categorical data with a natural order that allows them to be ranked and sorted (summarized through counting and grouping, proportion, or ranking/sorting)
ordinal data
ex. letter grade and Olympic medals
2 types of numerical data
interval data and ratio data
interval data
measured along a scale, with an equal and definitive interval or distance between each data point but no meaningful zero (counting and grouping, proportion, summing, and averaging)
interval data
ex. temperature and SAT Scores
ratio data
numerical data with an equal and definitive value between each data point, and with a meaningful zero (counting and grouping, proportion, summing, and averaging)
ratio data
ex. data measuring money, including all kinds of financials
big data concerns
Big data are data sets that are too large and complex for businesses’ existing systems to capture, store, manage, and analyze (1) cybersecurity and privacy, (2) data quality, and (3) integration and data silos
Volume, Velocity, Veracity, and Variety
4 Vs of Big Data
volume
the sheer amount of data
velocity
the speed that the data are being generated or the rate that data are being analyzed
veracity
the underlying truthfulness, accuracy (cleanliness), and trustworthiness of data
variety
different forms of data
population
group of phenomena that have something in common and is composed of every item of interest in that group (ex. every single retail store in the U.S.)
sample
a subset of members of a population (ex. 24% of retail stores in the U.S.)
statistic
a characteristic of a sample (ex. 24% of retail stores in the U.S. are open on Sunday)
parameter
characteristic of a population (ex. 28% of all retail stores in the U.S. are open on Sunday)
nonresponse bias
bias that results when respondents differ from non-respondents. This would be the bias that comes from people choosing not to do the survey for some reason.
selection bias
the bias that is introduced by the selection of individuals or data that are likely to sway the results of a study in favor of the analyst’s beliefs or hypothesis
confirmation bias
the bias that occurs when analysts analyze or present results in a manner that confirms their existing beliefs or theories while ignoring data and analysis that do not confirm their beliefs
outlier bias
the potential disproportionate influence of outliers in study results
mean
average of the measurements in a data set
median
the value that lies at the center of the data
mode
the most common observation in a data set (most)
symmetrical distribution
mean = median = mode
right-skewed
mean > median > mode
left-skewed
mean < median < mode
descriptive analytics
What happened? What is happening?
diagnostic analytics
Why did it happen? What are the causes of past results? Why are the results different than expectations?
predictive analytics
Will it happen in the future? What is the probability of something happening? Can we forecast what will happen?
prescriptive analytics
What should we do, based on what we expect will happen? How do we optimize our performance based on potential constraints?
adaptive analytics
How can we continuously learn using artificial intelligence? Can we learn from past and current events with adaptive learning?
predictive analytics (e)
What will product sales be? Or what is the chance the company will go bankrupt?
diagnostic analytics
why did revenue change? Or why did bond prices fall?
sorting
makes data for data visualization more meaningful and easier to identify. Can be done by category or numerically.
pie chart
a circular graph in which each slice represents the category’s proportion of the whole
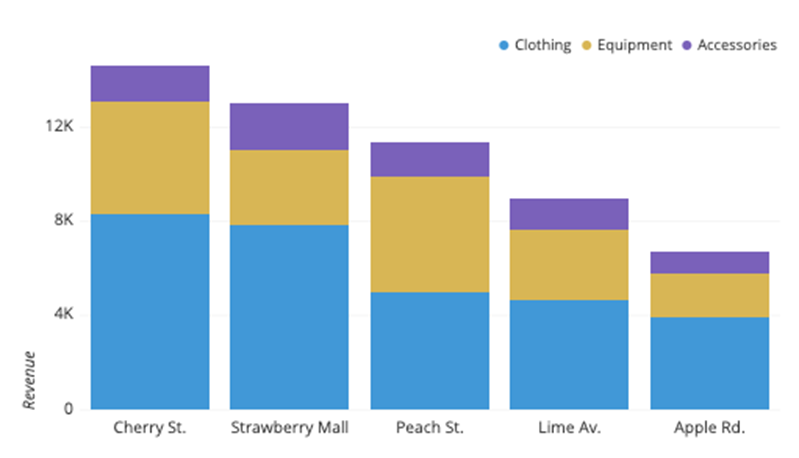
stacked bar graph
a variation of a standard bar chart that allows you to visualize two categorical variables at once. Each bar represents a primary category and is divided into segments (sub-bars) that correspond to levels of a secondary category. The total length of the bar shows the overall value.
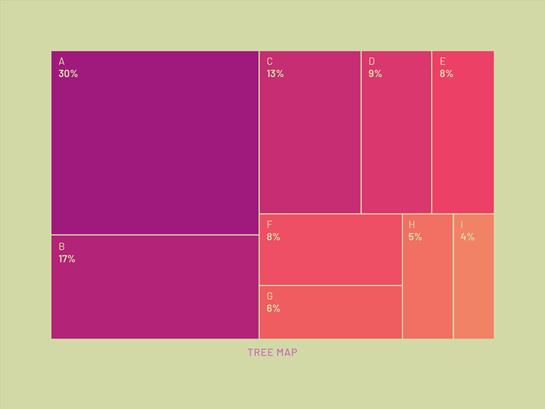
tree map
uses size and color to show the proportional size of values using physical space. It is made up of different sized rectangles with the color representing another category.
marketing mix
refers to the key choices that a company makes to bring a product/service to market. It consists of product, price, place, and promotion.
product, price, place, and promotion
4 Ps of the marketing mix
product
the good or service that a company offers to customers
price
the amount that a customer pays for a product
place
where the company sells a product and how the product is delivered to the market
promotion
all of the marketing communication strategies and techniques used to convince customers that they need the product at the specified price
product life cycle
the four phases (introduction, growth, maturity, and decline) that products go through, beginning with development and ending with decline/market removal
marketing dashboard
a visual management tool that helps track and monitor KPIs to improve marketing effectiveness
Financial, managerial, auditing, and tax accounting
4 branches of accounting
financial accounting
branch of accounting that focuses on collecting and analyzing business performance information for external decision makers. They provide information of the company’s performance, financial position, and financial statements under GAAP
managerial accounting
branch of accounting that focuses on collecting and analyzing business-performance information for internal decision makers (management). Does not have a set of accounting rules and solely exists to address management’s questions.
auditing
branch of accounting that investigates accounting and financial records to determine if they conform with GAAP or other relevant standards or laws. They work to fix errors, inaccuracies, and fraud.
tax accounting
branch of accounting that focuses on collecting and analyzing transactions to ensure they conform with tax law and minimizing future taxes through tax planning.
10-K, 10-Q, and 8-K
Forms required to be filed with the SEC
10-K
reports a company’s annual financial performance
10-Q
required quarterly submission reporting a company’s financial performance
8-K
notifies investors of important events or announcements
(new value - old value) / old value
percentage change formula
R-square
a measure to describe how well a simple regression (one independent variable) model predicts the dependent variable. The closer the value is to 1, the more prediction power it has (explains this percent of variation)
P-value
explains whether there is a significant relationship in the regression, the smaller the better (>0.05)
Significance F
evaluates whether a linear regression model provides a better fit of the data than a model that contains no independent variables. A very low significance power means it is a better model.
Regression coefficients
quantities by which variables in a regression equation are multiplied (slope of the line). Pay attention to whether it is positive or negative. This predicts what percent it will increase/decrease by 1 unit.
Human resources, IT operations, Supply Chain
3 branches of operations
human resources
focuses on managing and developing a company’s workforce
IT operations
how the company manages its hardware, software, and IT support
Supply Chain
responsible for the production of a good or service and its distribution to the final consumer
cash to cash cycle (DI + DAR - DAP)
measures the length of time between the company paying its vendors and the company receiving cash from its customers. The lower the ratio, the better
asset turnover (sales revenue/TA)
measures sales revenue generated by the company’s assets, the higher the better the efficiency
inventory to sales (inventory/sales)
measures amount of inventory being carried to fulfill sales, lower the better
inventory turnover (COGS/Inventory)
measures the number of times inventory is sold during the year, the higher the better
data mining
process of analyzing large amounts of data to identify patterns, anomalies, and relationships.
machine learning
statistical techniques that allow a computer to “learn” from data without being explicitly programmed
artificial neural network (ANNs)
a type of machine learning that uses connected processing nodes resembling the human brain
deep learning
when ANNs can be trained to recognize, classify, and describe unstructured data such as text, images, and voice. The more examples provided the more accurate the prediction.
customer segmentation
the process of grouping customers based on shared characteristics