Chapter 1: Advanced MA
1/36
There's no tags or description
Looks like no tags are added yet.
Name | Mastery | Learn | Test | Matching | Spaced | Call with Kai |
|---|
No analytics yet
Send a link to your students to track their progress
37 Terms
Cost Management
The activities managers carry out to use resources in a way that increases the value of a product for customers while also helping the organization achieve its goals. It is about managing costs intelligently.
Why cost management has become more important? (3 reasons)
First, there is a decrease in cost elasticity. Cost elasticity means how easily costs change when production or activity levels change. If a company has many variable costs, costs can move up and down more easily. But when the proportion of fixed costs increases, costs become less flexible. For example, if a company buys expensive machines, it has to pay depreciation, maintenance, and rent even if production decreases.
Second, cost transparency has deteriorated. Cost transparency means how clearly a company can see where its costs come from and which product, department, or customer causes them. This becomes harder when overhead costs increase. Overhead costs are indirect costs, such as administration, IT, rent, or management salaries, that cannot easily be traced to one specific product. For example, it is easy to know how much wood is used for one table, but harder to know how much of the IT department’s cost belongs to that table.
Third, the origin of costs has shifted. This means costs are not only created during production anymore. Many costs are already determined before production starts, for example during product design, research, development, and planning. Costs also continue after sales, for example through warranty, repairs, spare parts, and recycling. Traditional costing often focused mainly on production costs, but this slide shows that pre-production and follow-up costs must also be considered.
Product Pre-production period
In the pre-production period, the company searches for ideas, evaluates alternatives, develops the product, prepares production, and invests in specific equipment. During this period, there are usually cash outflows, meaning money goes out of the company, but there are no cash inflows yet because the product is not being sold. For example, when a car manufacturer designs a new car model, it spends money on engineers, testing, prototypes, and machines before earning any sales revenue from the car.
Product Market Period
The market period begins when series production starts. This is when the product is launched and sold. Cash inflows increase because customers start buying the product. The graph shows stages such as market launch, market penetration, market saturation, and market degeneration. Market penetration means the product is becoming more accepted and sales are growing. Market saturation means most possible customers already know or have bought the product, so growth slows down. Market degeneration means sales decline because the product becomes outdated or replaced by something newer.
Product Follow-up period
The follow-up period begins after series production ends. Even when the company stops producing the product, costs can continue. For example, the company may still have warranty obligations, spare part business, product recycling, or costs related to scrapping and selling equipment. The main message is that managers should not only look at production costs. They should manage costs across the whole life cycle of the product.
What are the three ways managers can manage costs?
Influencing the Cost level: Total amount of costs. Managers reduce it by changing factor amount (how much resource is used) or factor price (price per unit of resource).
Influencing the Cost structure: Composition of costs. Managers adjust the mix of fixed vs variable costs, direct vs overhead costs, and primary vs secondary costs.
Influencing the Development of costs: Managing costs before they become fixed/unavoidable, for example through early customer involvement, economies of scale, learning effects, and reducing complexity.
What is Reactive cost management?
Reactive cost management: Cost cutting after a negative problem has already happened, such as falling profits.
Examples: Budget cuts, postponed investments, hiring freezes, job cuts.
Disadvantages: Low employee acceptance, only short-term effects, less innovation, and lower quality.
What is Proactive cost management?
Proactive cost management means the company manages costs continuously before problems become serious. Instead of waiting for a crisis, the company constantly looks for ways to improve processes, reduce waste, and design products more efficiently
proactive vs reactive cost management
This graph compares reactive and proactive cost management over time. The vertical axis shows costs, and the horizontal axis shows time. The upper pattern shows reactive cost-cutting programs. Costs rise, then the company reacts by cutting costs, but after some time costs rise again. This creates a repeated pattern of crisis, cuts, and new cost increases. The overall direction can still move upward, meaning the company never really solves the cost problem permanently.
Competitive Advantage in terms of reactive and proactive cost management
The gap between the higher reactive cost level and the lower proactive cost level is called competitive advantage.
Competitive advantage means that the company is in a better position than competitors, for example because it can produce at lower cost while still offering good quality.
Proactive Cost Management Focuses on:
Proactive cost management: Continuous, planned, and early search for cost reduction opportunities.
Customer orientation: Focus on what customers actually value.
Process orientation: Analyze the whole supply chain to find inefficiencies.
Quality orientation: Prevent quality problems instead of fixing them later.
Added value orientation: Remove activities that do not create value for the customer.
Employee orientation: Involve employees because they often know where waste happens.
ABM vs ABC
Activity-Based Management, or ABM, is closely related to Activity-Based Costing, but the focus is slightly different. ABC helps us calculate and understand costs more accurately, while ABM uses that cost information to actually manage and reduce costs.
ABC vs Traditional method vs TDABC
Traditional costing: Assigns overhead using one broad cost driver, usually volume-based, like labor hours or machine hours. Simple but less accurate.
ABC costing: Assigns overhead based on activities that cause costs. More accurate because it uses several cost drivers, such as number of orders, setups, or deliveries.
TDABC: Time-Driven Activity-Based Costing. Assigns costs based on the time needed to perform activities and the cost per time unit. Easier and faster than normal ABC.
Advantages of using ABC instead of traditional. What does the traditional lack?
ABC is better than traditional costing because it connects overhead costs to the real activities that cause them. Instead of spreading overhead with one general driver, like labor hours or machine hours, ABC uses several cost drivers such as number of orders, deliveries, setups, inspections, or customer visits. This makes the cost calculation more accurate, especially when products or customers use company resources very differently.
Traditional costing lacks this detailed link between overhead and actual cost causes. Because it uses one broad allocation base, it can distort costs and create cross-subsidizing*. This means simple products/customers may be charged too much, while complex products/customers may be charged too little. So ABC gives better information for pricing, profitability analysis, cost control, and deciding which products or customers are truly worth focusing on.
*Cross-subsidizing: One product/customer is charged too much cost, while another is charged too little.
Ways of Activity Management that help cut costs
Order processing = redesigning activities + reducing non-value-added activities
Redesigning activities means changing the process itself to make it more efficient.
Example: manual order processing → online order processing.
Reducing non-value-added activities means removing activities that use resources but do not create customer value.
Example: reducing order mistakes so less time is spent correcting them.
Credit checks = eliminating activities + outsourcing activities
Eliminating activities means removing an activity completely if it is not needed.
Outsourcing activities means letting an external company do the activity instead of doing it internally.
What is the Pareto Rule?
The Pareto rule usually means that a small part of something creates a large part of the result. Here, the idea is that around 20% of customers are profitable and contribute to cumulative profit, while around 80% of customers reduce cumulative profit.
Explain Customer Profitability Analysis
Customer Profitability Analysis measures the net profit or loss earned from a specific customer or customer segment. The key point is that revenues and costs should be assigned to the customer if they are uniquely associated with that customer. This helps managers identify which customers are profitable and which are not.
High cost-to-serve customers vs Low cost-to-serve customers
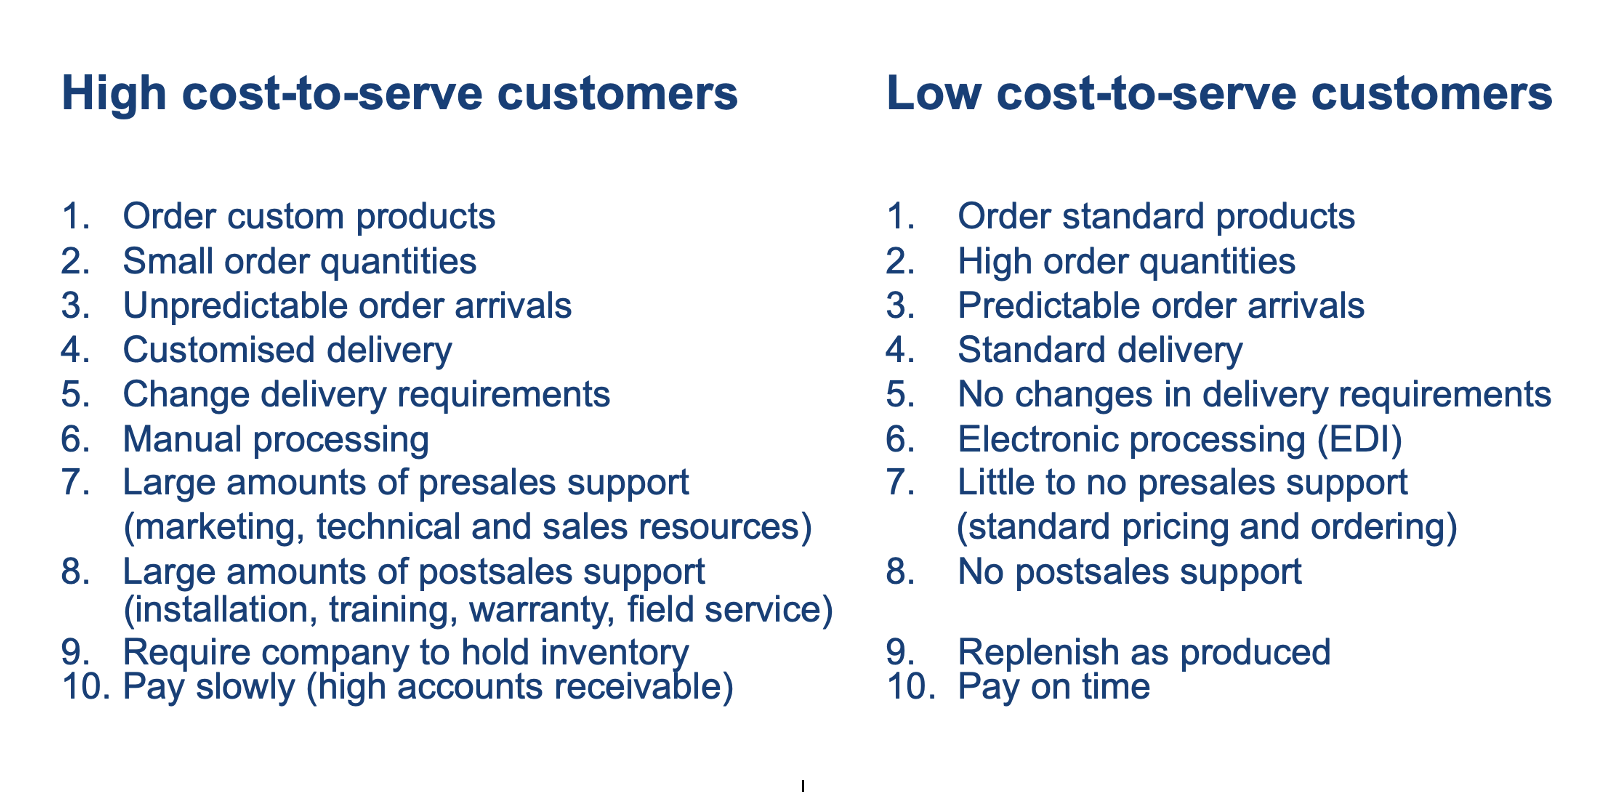
negative contribution + low volume customers =
losers
positive contribution + low volume customers =
potential
low contribution + positive volume customers =
problems
positive contribution + positive volume customers =
winners
Target Costing meaning
Target costing is a cost management method used mainly before a product is produced. The main idea is that the market and the customer determine what the product can cost. Instead of first calculating the cost and then adding profit to set the price, the company starts with the market price, subtracts the desired profit, and finds the maximum cost it is allowed to have.z
Allowable costs meaning and formula
The maximum costs a product may have while still achieving the target profit.
(Total) Allowable Costs = planned sales × (1 − target return on sales)
Drifting costs meaning and formula
Estimated costs if the product is made with the current design and current technology
If drifting costs are higher than allowable costs, there is a cost gap
Cost gap = If drifting costs > allowable costs
The difference between drifting costs and allowable costs when drifting costs are too high.
Cost splitting
Cost splitting means breaking down allowable costs into product features and components to see where cost reductions should happen. If there is no cost gap, or after the gap has been solved, the product can enter the market.
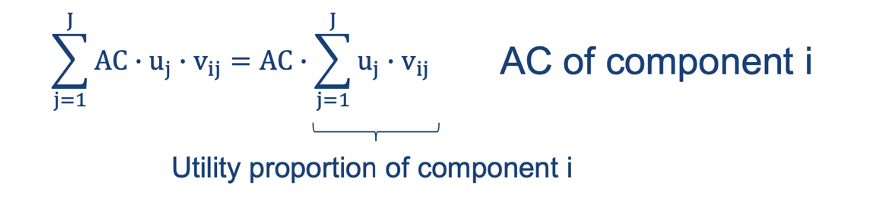
Formula calculating the allowable cost assigned to each component
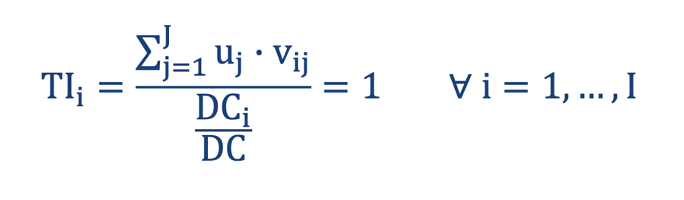
Target cost index formula
The target cost index, or TI, compares the utility proportion of a component with its cost proportion. The utility proportion shows how much customer value the component creates. The cost proportion shows how much of total drifting cost the component currently consumes. Drifting cost, or DC, means the estimated current cost of producing the component before optimization. The ideal situation is TI = 1. This means the component’s share of customer value and its share of cost are balanced. If a component creates 30% of customer value and causes 30% of cost, it is balanced. If the index is far away from 1, the component may need attention.
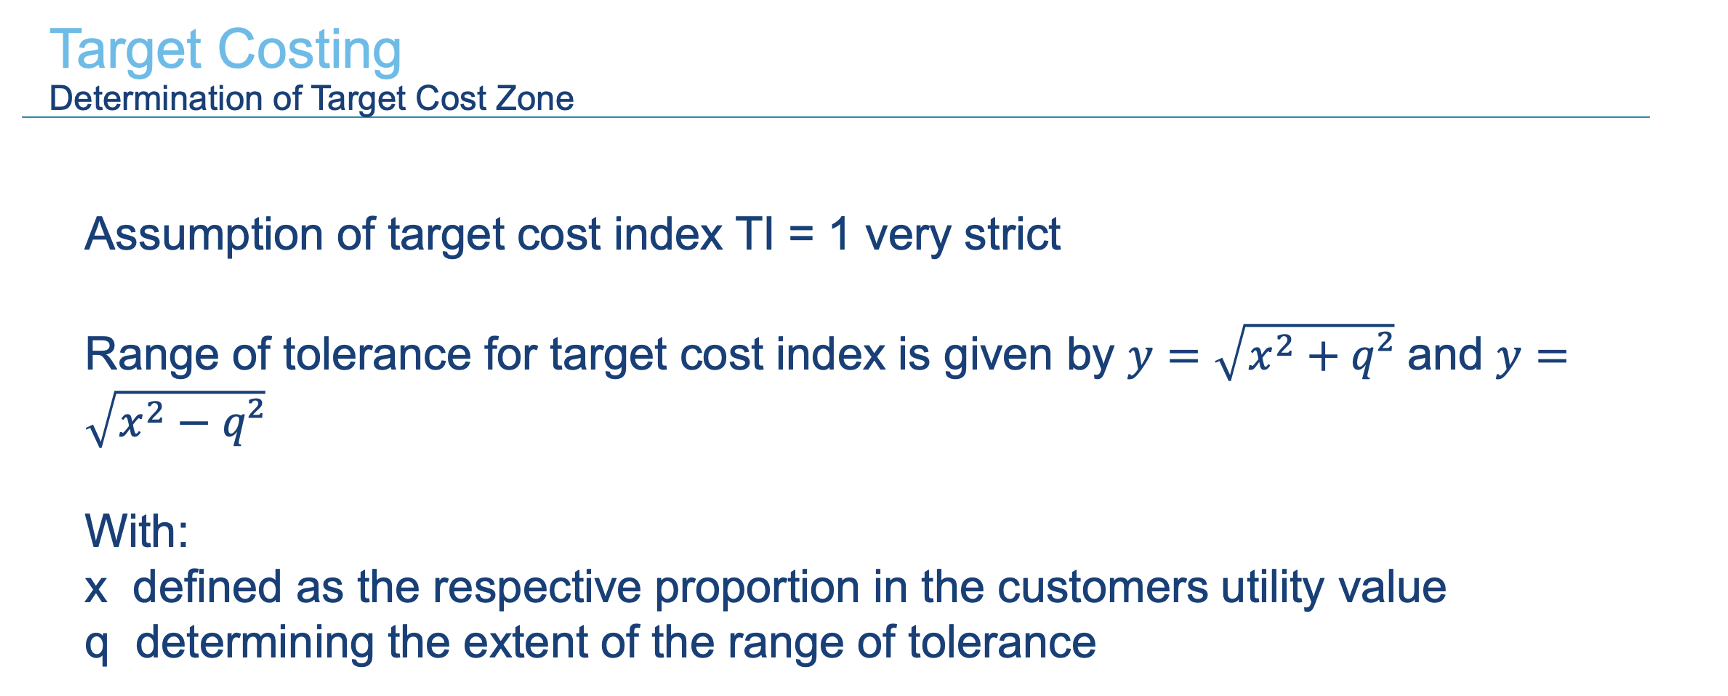
Target Cost Index Graph Tolerance Zone Calculation
Graph Interpretation
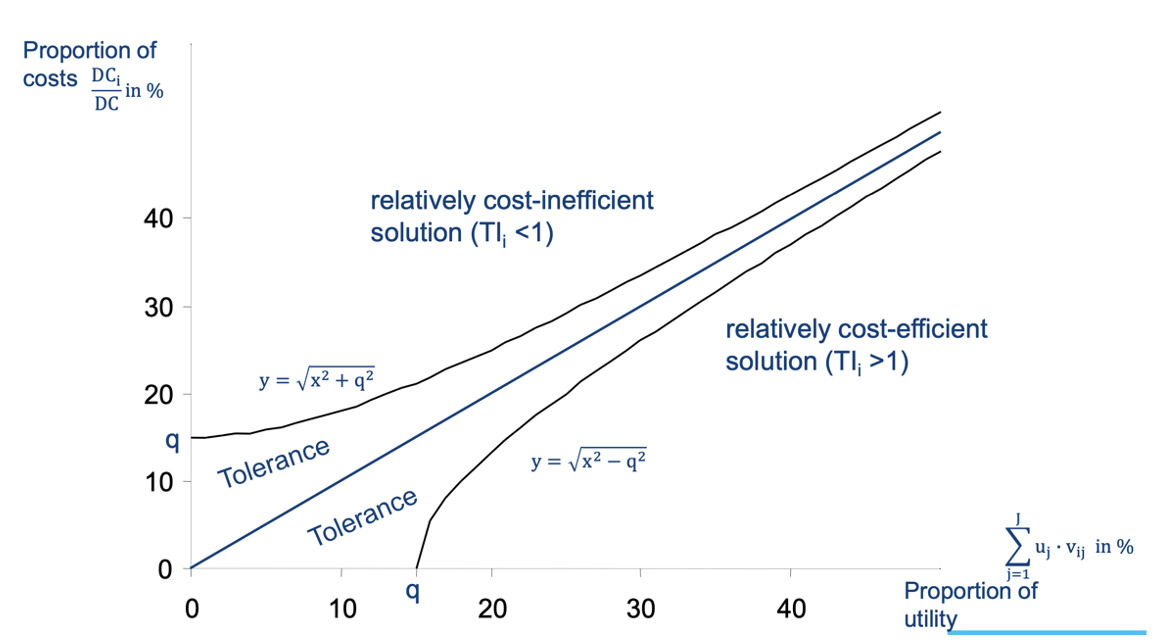
This graph shows the target cost zone. The horizontal axis shows the utility proportion of a component, meaning how much customer value the component creates. The vertical axis shows the cost proportion of the component, meaning how much of total cost the component consumes. The diagonal blue line represents the ideal situation where cost proportion equals utility proportion. This is where TI = 1. The area above the line means the component is relatively cost-inefficient. This means its cost share is higher than its value share, so TI < 1. For example, if a component creates 10% of customer value but causes 30% of total cost, it is probably too expensive compared with its value. The area below the line means the component is relatively cost-efficient. This means its value share is higher than its cost share, so TI > 1. For example, if a component creates 30% of customer value but only causes 10% of cost, it is creating a lot of value for little cost. The tolerance zone around the line shows the acceptable area where the company does not necessarily need to change anything.
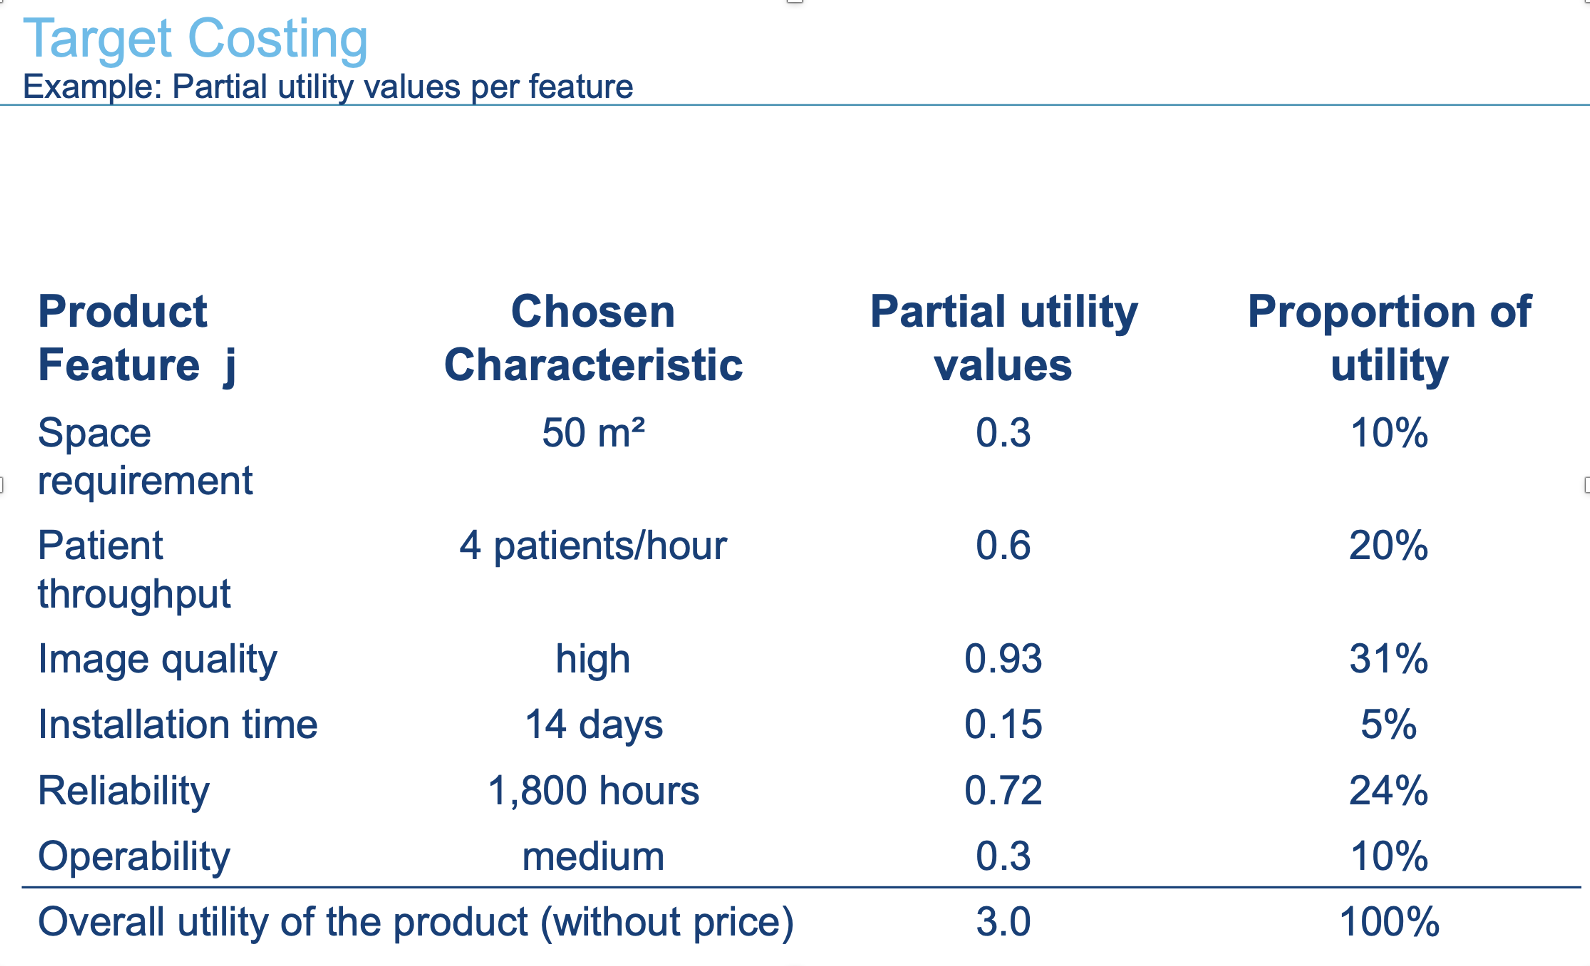
Partial Utility Value Meaning and Range of Utility Formula
Partial utility value means the amount of customer value created by one specific characteristic.
The range of utility shows how important a feature is overall. It is calculated as the highest utility value minus the lowest utility value.
The larger the range, the more customers care about that feature
Proportion of utility
Individual Utility / Total Utility
Target Costing Examples Solving
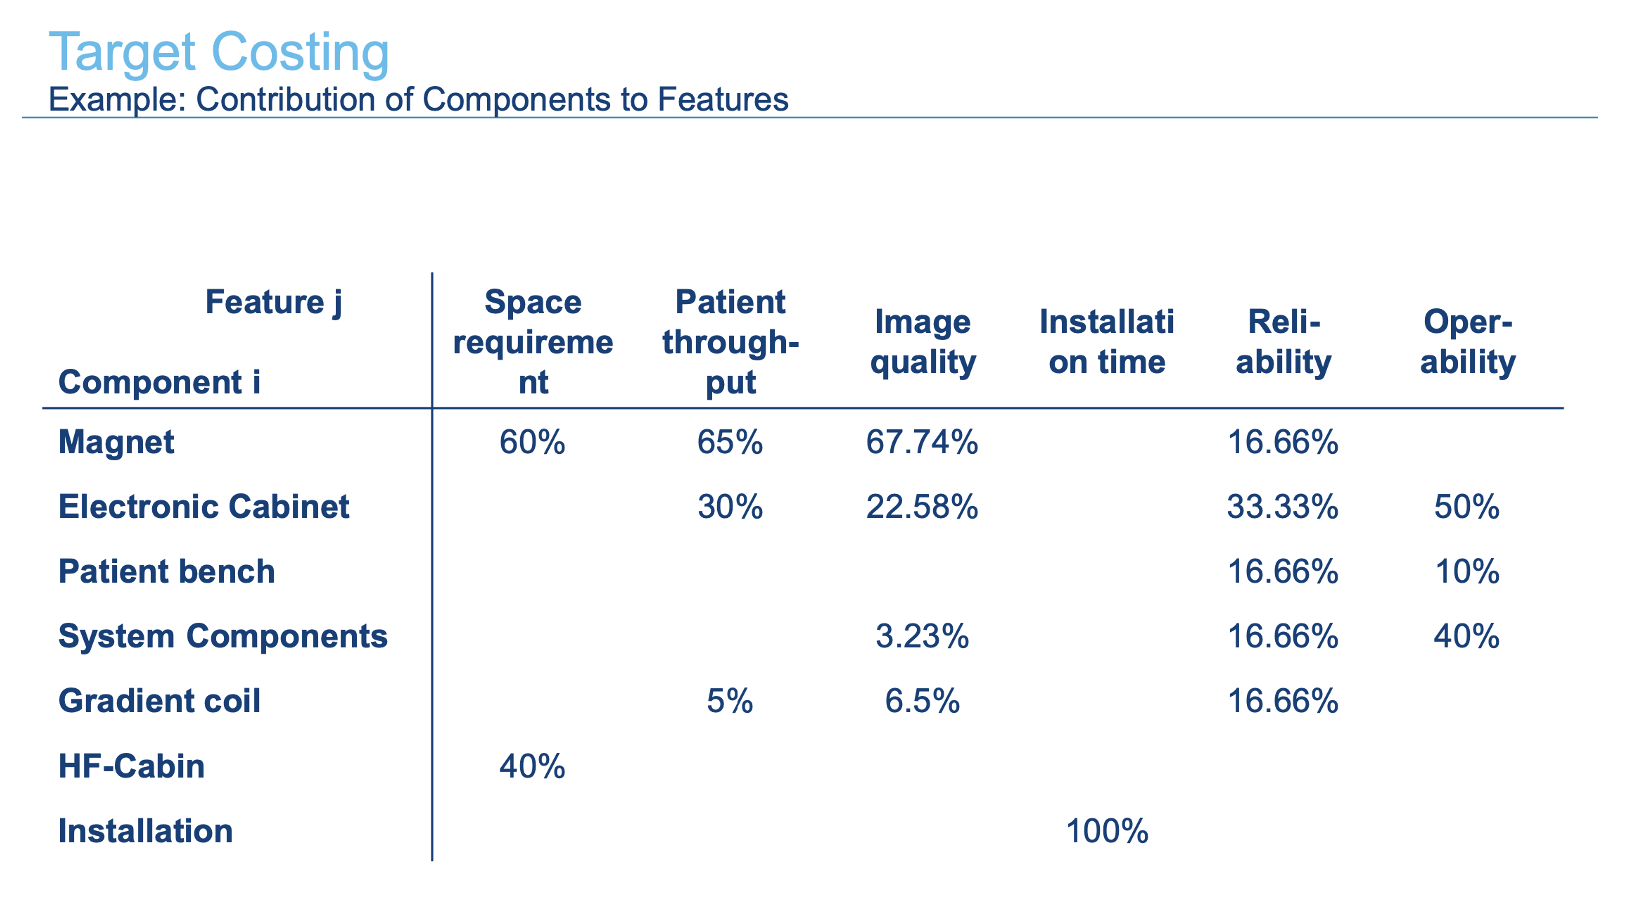
This slide shows how each technical component contributes to each product feature. The rows are components, such as magnet, electronic cabinet, patient bench, and installation. The columns are features, such as space requirement, patient throughput, image quality, installation time, reliability, and operability. For example, the magnet contributes 60% to space requirement, 65% to patient throughput, 67.74% to image quality, and 16.66% to reliability. Installation contributes 100% to installation time, because installation time is fully caused by the installation component. The important thing is that for each feature, the component contributions should add up to 100%. This table connects customer value to technical product parts. It allows the company to calculate how much customer value each component creates.
Part 2
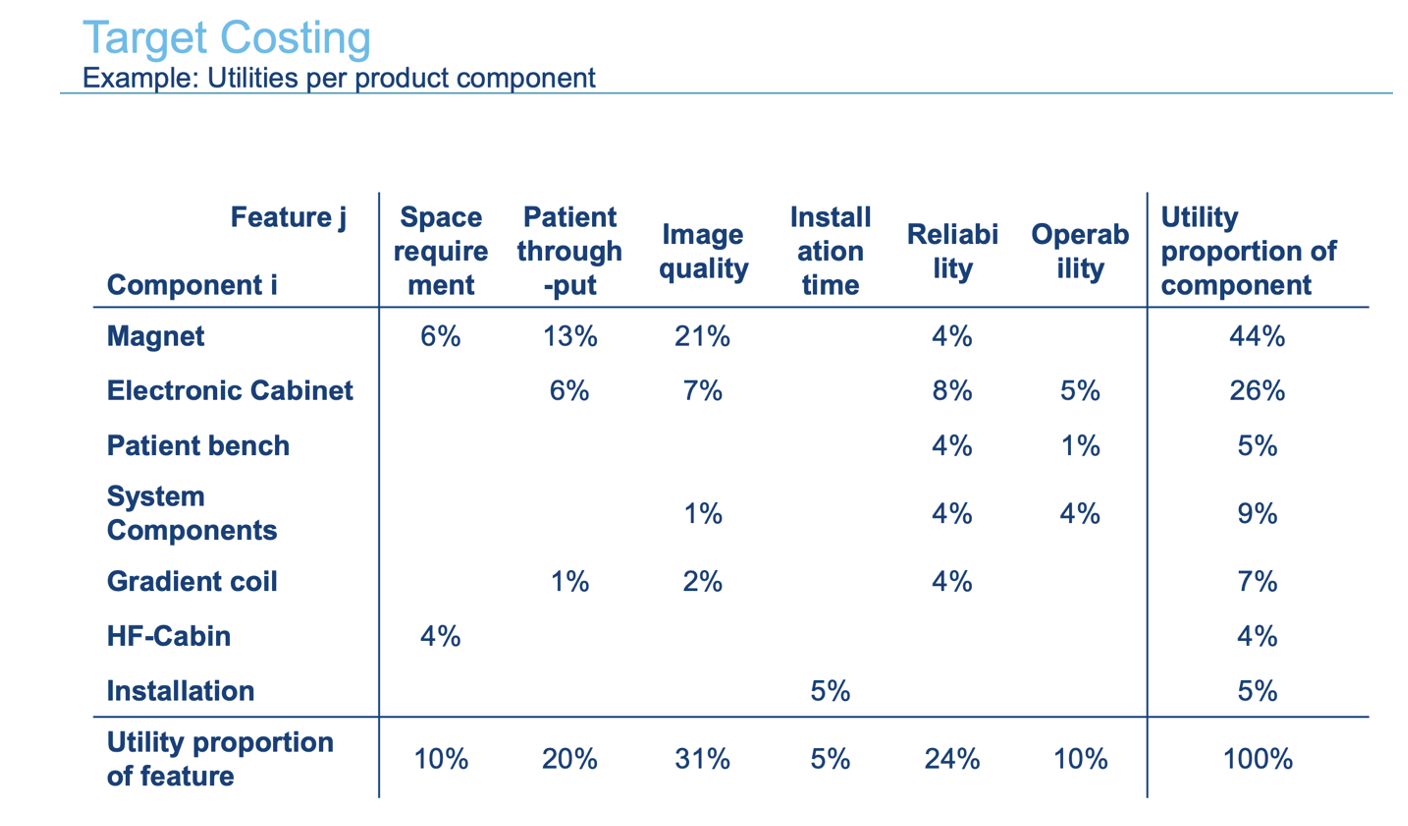
This slide calculates the utility proportion of each product component. It combines the previous slide’s feature importance with the contribution of each component to those features. In simple words, it answers the question: “How much of the total customer value is created by each component?” For example, the magnet contributes 60% to space requirement. Space requirement is worth 10% of total utility, so the magnet receives 6% from that feature. It also contributes 65% to patient throughput, which is worth 20%, so it receives 13% from patient throughput. It contributes 67.74% to image quality, which is worth 31%, so it receives around 21%. It also contributes 16.66% to reliability, which is worth 24%, so it receives around 4%. Adding these gives the magnet a total utility proportion of 44%. This final column is very important because it can now be compared with the cost proportions from the earlier cost table. For example, the magnet creates 44% of customer utility but only represents 31% of cost. That suggests it is relatively cost-efficient. The electronic cabinet creates 26% of customer utility and costs 27%, so it is roughly balanced. This is the logic of target costing: compare what each component costs with the customer value it creates.
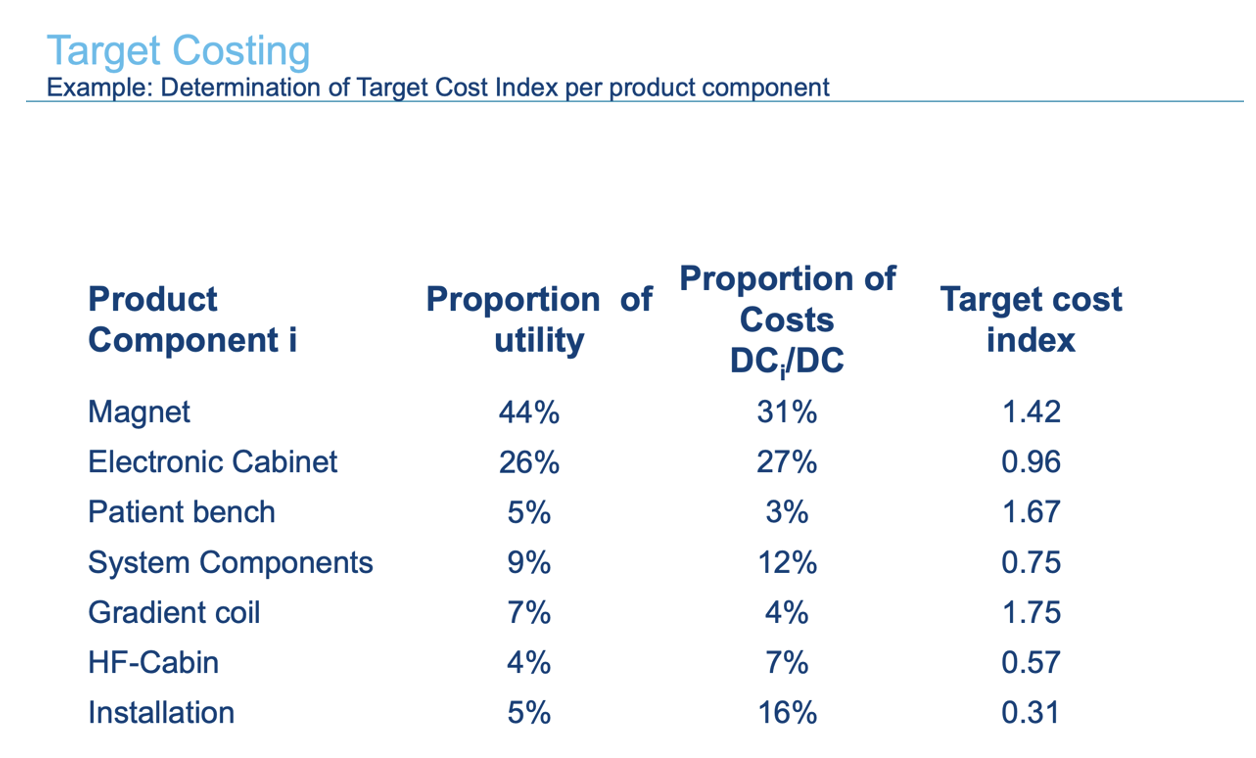
Part 3
This slide determines the target cost index for each product component. The target cost index compares the proportion of utility created by a component with the proportion of costs caused by that component. In simple terms, it asks: “Does this component create enough customer value compared to how much it costs?” The formula is: Target cost index = proportion of utility / proportion of costs. If the target cost index is 1, the component is balanced. This means the component’s share of customer value is equal to its share of cost. If the target cost index is higher than 1, the component is relatively cost-efficient because it creates more value than it costs. For example, the magnet has 44% utility and 31% cost, so its index is 1.42. This means the magnet creates a lot of value compared with its cost share. If the target cost index is lower than 1, the component is relatively cost-inefficient because it costs more than the value it creates. For example, installation has only 5% utility but 16% of costs, so its index is 0.31. This suggests that installation is too expensive compared with how much customers value it.
Relative Customer Value formula
partial utility / sum of the partial utilities