bio 1 - week 3 / content review 4.1 (week 4 - tues)
1/28
There's no tags or description
Looks like no tags are added yet.
Name | Mastery | Learn | Test | Matching | Spaced | Call with Kai |
|---|
No analytics yet
Send a link to your students to track their progress
29 Terms
when are populations likely to exhibit exponential growth?
low density: introduction to a new habitat, recovery from low densities, a decline
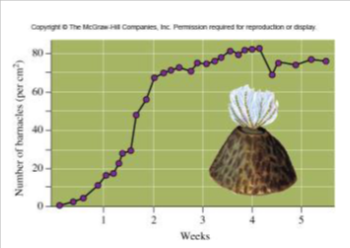
for the barnacles on the coast of scotland (see figure on the right), what is (approximately) their carrying capacity? their intrinsic rate of growth assuming density is 1 at week 0?
r = ln(10)
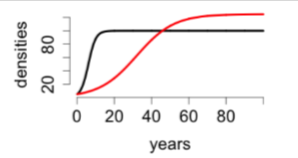
the dynamics of two populations, call them black and red, are shown to the right. which of these populations has the higher intrinsic rate of growth? the higher carrying capacity?
higher intrinsic rate of growth = black
higher carrying capacity = red
as a population demographer, the nature conservancy has asked you to study the demography of a rare songbird, the yellow-bellied thrush. to estimate the current population size, you sample the populations on two different days. on the first day, you catch 20 birds which you mark and release. on the second day, you catch 30 birds of which 6 are marked. what should be your estimate for the population size?
N/20 = 30/6
N = 100
when carlson’s yeast population is increasing exponentially, we estimated that r=0.5. given this value of r, how long will it take for the population to double in size?
2 = 1e0.5*t
t = 1.386
for the loggerheads, the population density was approximately 600 in 1976 and 300 in 1980. based on these two data points, what is your estimate of r for this population?
300 = 600er*4
r = -0.173
name three density-dependent factors that slow down population growth
cannibalism
competition for limited resources
pathogen prevalance
During the initial exponential rise of new COVID-19 cases in California, the intrinsic rate of growth was about 0.2/day. What is the doubling time for the number of new cases?
2 = 1e0.2*t
t = 3.465 days
what is a closed population? give an example.
immigration and emigration negligible
changes dominated by births and deaths
population of freshwater reptiles on a island
what is a open population? give an example.
immigration and emigration are substantial
population of birds on a island that is near other islands
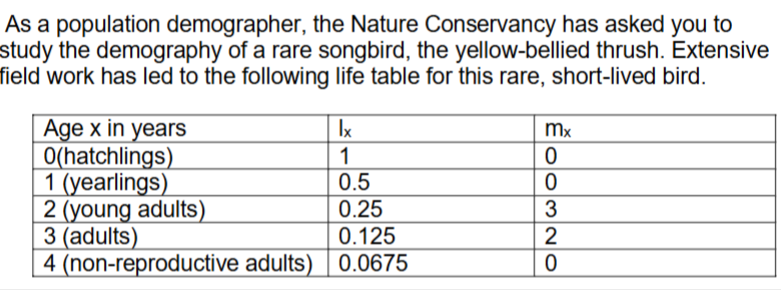
a. what type of survivorship curve does this small bird species exhibit (approximately)? explain briefly.
b. is this population increasing, decreasing, or tending to remain constant in size? support your answer with appropriate calculations.
c. what is the life expectancy of a yearling?
a. type ii because the probability of survival from year to year is around 50%
b. 1 = constant
c. 1.885
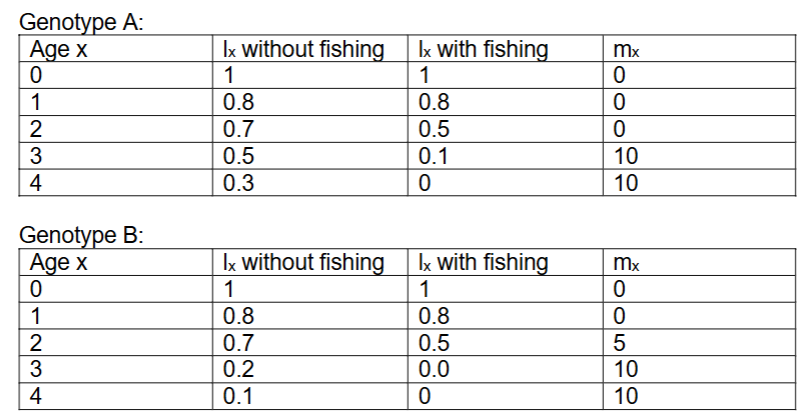
compute R0 for both genotypes in the presence and absence of fishing. discuss.
genotype a:
w/o fishing = 8
w/ fishing = 1
genotype b:
w/o fishing = 6.5
w/ fishing = 2.5
w/o fishing: selection for genotype a; w/ fishing: selection for genotype b
prof. truman young (ucd) studied two species on Mt. Kenya: lobelia deckenii: moister sites where iteroparous genotypes have a life expectancy at reproductive maturity of 10.9 years. lobelia telekii: drier sites and higher predation risk where iteroparous genotypes have a life expectancy at reproductive maturity of 2.7 years. for both species, semelparous genotypes produce 4.5 times more seeds per year than iteroparous genotypes. which species would you expect to be semelparous iteroparous?
l. deckenii - iteroparous = 1090
l. telekii - semelparous = 270
imagine a population of brightly colored beetles that are prey upon by visual predators. what are the three necessary conditions for evolution by natural selection to occur? imagine each of the conditions - describe why natural selection would NOT occur in a population if this condition is not met?
variation, heritability, and differential success
no variation = nothing for natural selection to choose
no heritability = offspring won’t resemble their parents (mean won’t shift)
no differential success = distribution of phenotypes will remain the same
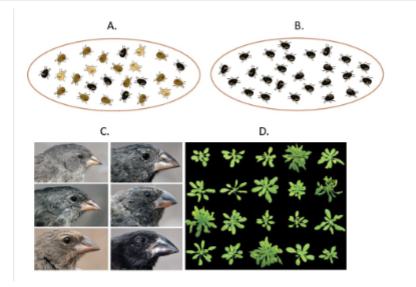
in which of these four populations could natural selection NOT operate in and why?
population b, because there is no phenotypic variation
what is the breeder’s equation and why is it useful in evolution? how do you estimate the strength of selection? how do you estimate the response to selection? using this equation, under what conditions can evolution NOT occur?
R = h2 - S ; predicts phenotypic change
strength of selection = breeder average - population average
response to selection = offspring average - population average
no heritability and no selection differential
sailfin mollies are a beautiful and awe-inspiring fish (see below). males use their large ‘sail’
(dorsal fin) to attract females. you’ve been observing a population of them in the wild for many
years because you love fish. while the average area of the male’s sails have typically maintained
at 3cm squared for many years, in one year you notice that the sails actually decreased to 2.6cm
squared (note: the fish typically only live for one year). you think that this is likely due to the
introduction of a novel predator that can spot the larger sails more easily. given that your work
has shown that the heritability of sails is quite high (0.47), how strong is the selection this
predator exerted on the previous generation?
-0.4 = 0.47 * S
S = -0.85
what is resource acquisition?
process in which organisms obtain energy and nutrients
what is optimal foraging?
the ratio or energy obtained vs energy spent (energy obtained / energy spent)
what is a type i survivorship curve?
low mortality until later stages of life
what is a type ii survivorship curve?
constant probability of survival from year to year
what is a type iii survivorship curve?
high juvenile mortality and low adult mortality
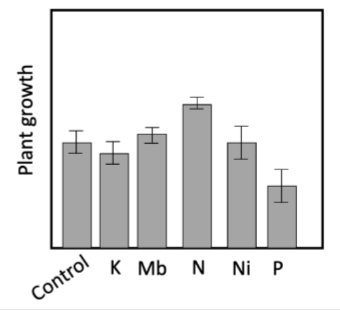
you are interested in determining the limiting nutrient of plants in a garden. in this garden, which nutrient is most likely not to be a limiting factor?
a. phosphorous (P)
b. nitrogen (N)
c. molybdenum (Mb)
d. potassium (K)
e. nickel (Ni)
f. none of these nutrients are limiting in this environment
phosphorous
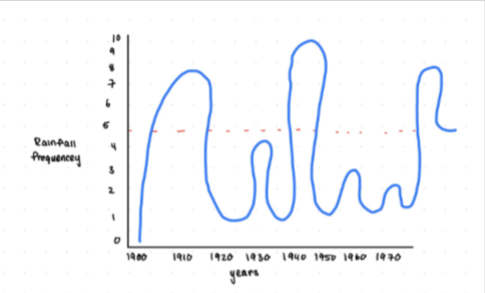
the graph shows the rainfall pattern of an island off the coast of florida. the dotted red line represents ideal rainfall. based on the graph, are you more likely to find semelparity or iteroparity species? explain your reasoning.
iteroparity, because since the rainfall fluctuates, survival is not guaranteed, so species reproduce multiple times to ensure that a new generation is created
what is a density-dependent factor?
biotic factors that affect population size based on its density
what is a density-independent factor?
abiotic factors that affect population size not based on its density
which of the following is an example of a density-independent factor regulating population size?
a). a flood occurs and washes away 60% of cacti
b). there is not enough nitrogen in the soil and 50% of the roses die
c). 65% of shorter plants die due to the taller plants crowding the space above and blocking their sunlight.
d). none of the above
e). more than one is true
a flood occurs and washes away 60% of cacti
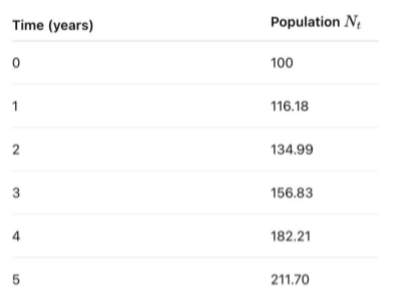
what is the growth rate of the population?
a) 0.15
b) 0.6
c) 0.8
d) 0.19
116.18 = 100er*1
r = 0.15