statistics refresher
 Call Kai
 Learn
Learn Practice Test
 Spaced Repetition
 Match
Match Flashcards
 Knowt Play
1/97

There's no tags or description
Looks like no tags are added yet.
Name | Mastery | Learn | Test | Matching | Spaced | Call with Kai |
|---|
No analytics yet
Send a link to your students to track their progress
98 Terms
statistics
are used for purposes of description.
Numbers provide convenient summaries and allow us to evaluate some observations relative to others
For example, if you get a score of 54 on a psychology examination, you probably want to know what 54 means
Is 54 lower than the average score or is it about the same?
Knowing the answer can make the feedback you get from your examination more meaningful. If you discover that the 54 puts you in the top 5% of the class, then you might assume you have a good chance for an A. If it puts you in the bottom 5%, then you will feel indifferently
statistics
can be utilized to make inferences, which are logical deductions about events that cannot be observed directly
For example, you do not know how many people watched a particular television movie unless you ask everyone.
However, by using scientific sample surveys, you can infer the percentage of people who saw the film
Two Kinds of Statistics
Descriptive Statistics
Inferential Statistics
Descriptive Statistics
These are methods used to provide a concise description of a collection of quantitative information
brief informational coefficients that summarize a given data set, which can be either a representation of the entire population or a sample of a population
broken down into measures of central tendency and measures of variability (spread)
mean, median, mode
Inferential Statistics
These are methods used to make inferences from observations of a small group of people known as a sample to a larger group of individuals known as the population
Typically, the psychologist wants to make statements about the larger group but cannot possibly make all the necessary observations. Instead, he or she observes a relatively small group of subjects (sample) and uses inferential statistics to estimate the characteristics of the larger group
Properties of Scales
make scales of measurement different from one another which are:
Magnitude
Equal Intervals
Absolute 0 (Zero)
magnitude
property of “moreness”
A scale has the property of magnitude if we can say that a particular instance of the attribute represents more, less, or equal amounts of the given quantity than does another instance
On a scale of height for example, if we can say Michael is shorter than Denzel, then the scale has the property of?
magnitude
There are scales that do not have the property of?
For example, a coach assigning identification numbers to teams such as Team 1, Team 2, and Team 3 does not have the property of magnitude
However, if these teams are ranked based on the number of games they have won, then the new numbering system would have the property of?
Equal Intervals
A scale has the property of equal intervals if the difference between two points at any place on the scale has the same meaning as the difference between two other points that differ by the same number of scale units
For example, the difference between inch 2 and inch 4 on a ruler represents the same quantity as the difference between inch 10 and inch 12: exactly 2 inches
Absolute 0 (Zero)
Absolute 0 (Zero) is obtained when nothing of the property being measured exists
For example, if you are measuring heart rate and observe that your patient has a rate of 0 and has died, then you would conclude that there is no heart rate at all
For many psychological properties, it is extremely difficult, if not impossible, to define an absolute 0 point
For example, if one measures shyness on a scale from 0 to 10, then it is hard to define what it means for a person to have absolutely no shyness
Nominal
does not have the property of magnitude, equal intervals, or an absolute 0
really not scales at all; their only purpose is to name objects
For example, the numbers in the back of the jersey of basketball or football players are nominal because they are not used to quantify, they are only used to label the player
Ordinal
A scale with the property of magnitude but not equal intervals or an absolute 0
This scale allows you to rank individuals or objects but not say anything about the meaning of the differences between ranks
If you were to rank the members of your class by height, then you would have an ordinal scale. For example, if Vin is the tallest, Rovi the second tallest, and Peter the third tallest, you would assign them the ranks of 1, 2, & 3, respectively but you would not give consideration as to how many inches are their difference between each other
Interval
When a scale has the properties of magnitude and equal intervals but not absolute 0
the measurement of temperature in degrees Fahrenheit. This temperature scale clearly has the property of magnitude, because 35°F is warmer than 32°F
Also, the difference between 90°F and 80°F is equal to a similar difference of 10 degrees at any point on the scale. There is no absolute 0 because 0° in Fahrenheit still refers to a degree of temperature which is a temperature that is very cold
Ratio
A scale that has all three properties (magnitude, equal intervals, and an absolute 0)
For example, consider the number of yards gained by running backs in football teams. Zero yards actually mean that the player has gained no yards at all
If one player has gained 1000 yards and another has gained only 500, then we can say that the first athlete has gained twice as many yards as the second
Another example is the speed of travel. For instance, 0 miles per hour (mph) is the point at which there is no speed at all. If you are driving onto a highway at 30 mph and increase your speed to 60 when you merge, then you have doubled your speed
DISTRIBUTION OF SCORES
A single test score means more if one relates it to other test scores
summarizes the scores for a group of individuals.
Frequency Distribution
It displays scores on a variable or a measure to reflect how frequently each value was obtained
one defines all the possible scores and determines how many people obtained each of those scores
Usually, scores are arranged on the horizontal axis from the lowest to the highest value.
The vertical axis reflects how many times each of the values on the horizontal axis was observed
bell-shaped, with the greatest frequency of scores toward the center of the distribution and decreasing scores as the values become greater or less than the value in the center of the distribution
Class Interval
Whenever you draw a frequency distribution or a frequency polygon, you must decide on the width of this
This answers the question “What percent of the scores fall below a particular score”
the percentage of scores in its frequency distribution that are equal to or lower than it.
For example, a test score that is greater than 75% of the scores of people taking the test is said to be at the 75th percentile, where 75 is the percentile rank
Describing Distributions
Statistics are used to summarize data. If you consider a set of scores, the mass of information may be too much to interpret all at once.
That is why we need these numerical conveniences to help summarize the information:
Mean
Standard Deviation
Z-Score
Standard Normal Deviation
T-Score
Quartiles and Deciles
mean
The arithmetic average score in a distribution
To calculate the mean, we total the scores, and we divide the sum with the number of cases
Standard Deviation
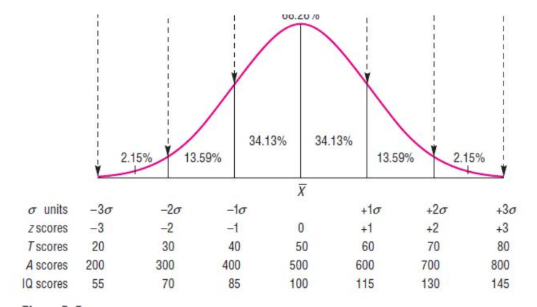
This is an approximation of the average deviation around the mean.
This is basically the degree of variation in test scores
Z-Score
One problem with means and standard deviations is that they do not convey enough information for us to make meaningful assessments or accurate interpretations of data
transforms data into standardized units that are easier to interpret.
This describes a value’s relationship to the mean of a group of values
have a mean of 0 and a standard deviation of ±1
T-Score
to transforms data into standardized units that are easier to interpret.
This describes a value’s relationship to the mean of a group of values
have a mean of 50 and a standard deviation of 10
Quartiles
These are points that divide the frequency distribution into equal fourths.
The first quartile is the 25th percentile, the second quartile is the 50th percentile, the third is the 75th percentile
Deciles
These are similar to quartiles except that they use points that mark 10% rather than 25% intervals
Correlation
It is an expression of the degree and direction of correspondence between two things
For example, a test administrator would like to know the correlation between the scores of a Brief Resilience Scale and Mental Toughness Scale. If the scores on BRS are mostly high and the scores on the MTS also show the same trend, we can say that there is a correlation between the two variables
coefficient of correlation (r)
expresses a linear relationship between two (and only two) variables, usually continuous in nature
Positive Correlation
refers to when the Scores in BRS are high while the scores in MTS high as well.
This can also happen when both scores are low
both high or both low
Negative Correlation
happens when the two scores contradict with each other.
When one is high, the other score is low
Regression
This may be defined broadly as the analysis of relationships among variables for the purpose of understanding how one variable may predict another
The statistical tool that can be utilized for this is the ANOVA
Simple Regression
involves one independent variable, which is typically referred to as the predictor variable, and one dependent variable typically referred to as the outcome variable.
The statistical tool utilized for this is the T-Test
Multiple Regression
the statistical technique that can be used to analyze the relationship between a single dependent variable and several independent variables
Multimethod Assessment
No measure of personality or behavior is perfect.
Some have excellent reliability, validity, and clinical utility, but even these have their limitations.
For that reason, it is important for clinical psychologists not to rely exclusively on any single assessment method.
Instead, personality is best assessed by using multiple methods, including tests of different types, interview data, observations, or other sources.
Multimethod Assessment

Evidence-Based Assessment
Clinical psychologists who practice evidence-based assessment select only those methods that have strong psychometrics, including reliability, validity, and clinical utility
They typically target their assessment strategies toward a particular diagnosis or problem, such that “what works” for assessing attention-deficit/ hyperactivity disorder (ADHD) might be a different set of assessment tools than “what works” for assessing panic disorder, schizophrenia, bulimia, PTSD, or any other clinical issue
Some of its advocates hope it will influence not only current graduate students in clinical psychology but also experienced psychologists “who use assessment instruments because they learned them in graduate school, rather than because there is strong evidence that they work.
Culturally Competent Assessment
essential across all activities of clinical psychologists, especially personality assessment.
Simply put, every culture has its own perception of “normal” and its own variations of “abnormal” as well
A personality assessment conducted without knowledge or sensitivity to these cultural specifics can be a dangerous thing; in fact, it has been labeled “cultural malpractice” by some
A primary danger lies in the possibility of overpathologizing—that is, viewing as abnormal that which is culturally normal
In other words, the clinical psychologist must appreciate the meaning of a behavior, thought, or feeling within the context of the client’s culture, which may differ from the context of the psychologist’s own culture
Objective Personality Tests
unambiguous test items, offer clients a limited range of responses, and are objectively scored.
Most often, the objective personality tests that clinical psychologists use are questionnaires that clients complete with pencil and paper
They typically involve a series of direct, brief statements or questions and either true/false or multiple-choice response options in which clients indicate the extent to which the statement or question applies to them
Minnesota Multiphasic Personality Inventory-2
When creating a personality test, it is relatively easy for an author to create a list of items that should, theoretically, elicit different responses from “normal” and “abnormal” people of various categories
Hathaway and McKinley chose to take on a greater challenge: to create a list of items that empirically elicit different responses from people in these normal and abnormal groups
Hathaway and McKinley succeeded in creating such a list of items by using a method of test construction called empirical criterion keying
Empirical Criterion Keying
Essentially, this method involves identifying distinct groups of people, asking them all to respond to the same test items, and comparing responses between groups
If an item elicits different responses from one group than from another, it’s a worthy item and should be included on the final version of the test
If the groups answer an item similarly, the item is discarded because it does not help categorize a client in one group or the other
Hypochondriasis
scale number: 1
abbreviation: Hs
description of high scale scores: Somatic problems, excessive bodily concern, weakness, ailments, complaining and whining
Depression
scale number: 2
abbreviation: D
description of high scale scores: Depressed, unhappy, low confidence, pessimistic
Hysteria
scale number: 3
abbreviation: Hy
description of high scale scores: Vague medical reactions to stress, somatic symptoms, denial of conflict and anger
Psychopathic Deviate
scale number: 4
abbreviation: Pd
description of high scale scores: Antisocial, rebellious, blaming others, poor consideration of consequences of actions
Masculinity-Femininity
scale number: 5
abbreviation: Mf
description of high scale scores: Rejection of traditional gender roles, effeminate men, masculine women
Paranoia
scale number: 6
abbreviation: Pa
description of high scale scores: Suspicious, guarded, hypersensitive, belief that others intend to harm
Psychasthenia
scale number: 7
abbreviation: Pt
description of high scale scores: Anxious, nervous, tense, worrisome, obsessive
Schizophrenia
scale number: 8
abbreviation: Sc
description of high scale scores: Psychotic, disorganized, or bizarre thought process, unconventional, hallucinations, delusions, alienated
Mania
scale number: 9
abbreviation: Ma
description of high scale scores: Manic, elevated mood, energetic, overactive, accelerated movement and speech, flight of ideas
Social Introversion
scale number: 10
abbreviation: Si
description of high scale scores: Introverted, shy, reserved, more comfortable alone than with others
Personality Assessment Inventory (PAI)
contains 344 items, each of which offers four responses: totally false, slightly true, mainly true, and very true.
It is appropriate for clients 18 to 89 years old, but an adolescent version, the PAI-A, can be used for clients as young as 12.
It includes 11 clinical scales, some that match with those of the MMPI but others that are more uniquely tied to specific diagnoses or problems, like Borderline Features, Antisocial Features, Anxiety- Related Disorders, Alcohol Problems, and Drug Problems.
Millon Clinical Multiaxial Inventory-IV
like the MMPI-2 and PAI in many ways: It is a comprehensive personality test in a self-report, pencil-and paper, true/false format.
The primary difference between the tests is its emphasis on personality disorders
features separate clinical scales corresponding to each of the 10 current personality disorders (e.g., antisocial, borderline, narcissistic, paranoid)
It also includes clinical scales for other forms of personality pathology, many of which have been considered for inclusion as disorders in DSM but are currently omitted (e.g., self-defeating personality, negativistic/passive-aggressive personality, depressive personality, turbulent personality
NEO Personality Inventory-3
The authors, Paul Costa and Robert McCrae, sought to create a personality measure that assesses “normal” personality characteristics
In short, the authors of the NEO-PI-3 (who also put forth the corresponding five-factor model of personality or “Big Five”) argue that the many words our language offers for describing personality traits “cluster” into five fundamental traits of personality that characterize everyone in varying degrees.
These traits—Neuroticism, Extraversion, Openness, Agreeableness, and Conscientiousness— are the five primary scales yielded
Neuroticism

Extraversion

Openness

Agreeableness

Conscientiousness

Beck Depression Inventory - II
self-report, pencil-and-paper test that assesses depressive symptoms in adults and adolescents
brief—only 21 items, usually requiring a total of 5 to 10 minutes to complete.
Each item is a set of four statements regarding a particular symptom of depression, listed in order of increasing severity.
The clients choose the one sentence in each set that best describes their personal experience during the previous 2 weeks (a time period chosen to match DSM criteria)
Beck Depression Inventory - II
The 21 item scores are summed to produce a total score, which reflects the client’s overall level of depression
consider the following set of statements, of which the client would choose one:
I never think about dying. (0 points)
I occasionally think about dying. (1 point)
I frequently think about dying. (2 points)
I constantly think about dying. (3 points)
Projective Personality Tests
based on a fundamentally different assumption: People will “project” their personalities if presented with unstructured, ambiguous stimuli and an unrestricted opportunity to respond
Imagine a group of people lying on the ground, looking up at the same series of vaguely shaped clouds in the sky.
The way each person makes sense of the series of clouds implies something about that person’s personality
Projective Personality Tests
To extend this analogy, projective personality tests are similar to a series of “clouds” that psychologists display to clients.
The lack of objectivity, especially in scoring and interpreting, highlights the most frequently cited shortcoming
Critics stress that they are far too inferential to be empirically sound; that is, they rely too heavily on a psychologist’s unique way of scoring and interpreting a client’s responses
Rorschach Inkblot Method
In 1921, Hermann Rorschach created
Rorschach was a Swiss psychiatrist who, as a child, played a game in which participants looked at vague blots of ink and said what they saw in the blots
As an adult, he decided to apply a similar method to his patients, with the hypothesis that their responses would reveal their personality characteristics
Rorschach created 10 inkblots, 5 with only
black ink and the other 5 with multiple colors.
Administration occurs in two phases. In the “response”
or “free association” phase, the psychologist presents
one inkblot card at a time, asks, “What might this be?”
and writes down the client’s responses verbatim.
After the client has responded to all 10 cards, the
“inquiry” phase begins, in which the psychologist reads
the client’s responses aloud and asks the client to
describe exactly where in the inkblot each response
was located and what features of the inkblot caused
the client to offer that response.
Thematic Apperception Test
feature interpersonal scenes rather than inkblots. The client’s task is to create a story to go along with each scene
They are asked to consider not only what is happening in the scene at the moment but also what happened before and what may happen after the scene.
They are also asked to describe what the characters may be thinking and feeling
Although it is considered a global measure of personality by many, its strength may lie in its ability to measure interpersonal relationship tendencies
Thematic Apperception Test
includes a total of 31 cards, but psychologists typically select their own subset of cards—often about 10 or so—to administer to a particular client
As the client tells stories aloud and the psychologist writes them down, the psychologist may ask questions during a client’s story to solicit more information and can remind the client of the initial instructions as well.
often analyzed without formal scoring at all.
Thus, interpretation is frequently more art than science.
A client’s story may be interpreted one way by one psychologist but very differently by another.
Sentence Completion Tests
the ambiguous stimuli are neither inkblots nor interpersonal scenes; instead, they are the beginnings of sentences
The assumption is that clients’ personalities are revealed by the endings they add and the sentences they create
Intelligence Tests
Measure a client’s intellectual activities
Neuropsychological Tests
Focuses on issues of cognitive or brain dysfunction, including the effects of brain injuries and illnesses
Charles Spearman
To him, Intelligence is One Thing.
In other words, intelligence is a singular characteristic
he labeled this characteristic “g” for general intelligence and argued that it represented a person’s global, overall intellectual ability
he acknowledged that more specific abilities “s” existed, but he argued that they played a relatively minor role in intelligence
Louis Thurstone
he argued that intelligence should not be understood as a single, unified ability but as numerous distinct abilities that have little relationship to one another
He was a pioneer of the statistical procedure called multiple-factor analysis, which enabled him to identify underlying factors in a large data set
Using multiple-factor analysis, he found several independent factors.
These factors were given labels such as verbal comprehension, numerical ability, spatial reasoning, and memory
This means that you cannot say confidently that a person performing well in mathematics will also perform well when it comes to verbal skills
Hierarchical Model of Intelligence
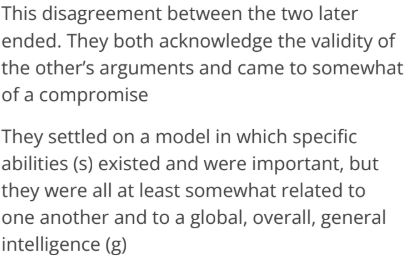
raymond cattell
proposed two separate intelligences:
Fluid Intelligence: The ability to reason when face with novel problems
Crystallized Intelligence: The body of knowledge one has accumulated as a result of life experiences
Three-Stratum Theory of Intelligence
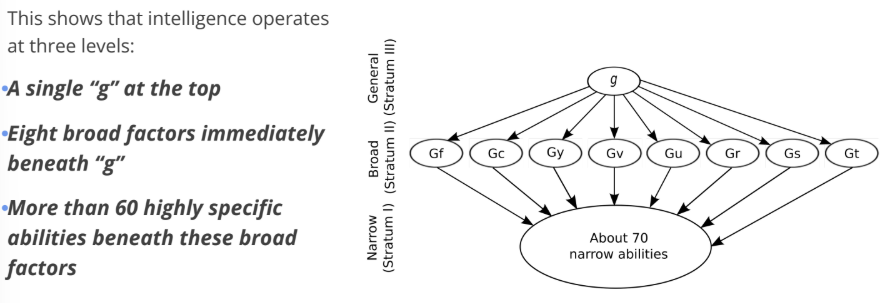
General Ability
can provide a broad and comprehensive assessment of cognitive functioning.
It is often associated with problem-solving skills, adaptability, and learning ability.
it may not provide detailed insights into specific skills or aptitudes.
Specific Ability
provide a detailed and focused assessment of an individual's proficiency in a particular area
They can be useful for identifying strengths and weaknesses in specific domains.
may not provide a complete picture of an individual's overall cognitive capacity
It may also be less applicable in contexts that require a broad understanding or adaptability across different domains.
Task or Goal Specificity
Consider the specific task or goal of the assessment.
If you need a broad understanding of overall cognitive ability, general ability assessments may be more appropriate.
If you are interested in a particular skill or domain, specific ability assessments may be more relevant.
Balanced Approach
incorporates both general and specific ability assessments can provide a more comprehensive understanding of an individual's cognitive profile.
Context and Purpose
The choice between general and specific abilities also depends on the context of the assessment and the purpose for which the information is being gathered.
For academic or employment settings, a combination of both may be beneficial.
Wechsler Intelligence Tests
cover virtually the entire life span.
They vary slightly from one another, as necessitated by the demands of measuring intelligence at different ages
They are administered one-on-one and face-to-face.
cannot be administered to a group of examinees at the same time, nor are they entirely pencil-and-paper tests (e.g., multiple choice, true/false, essay) that examinees simply administer to themselves
Wechsler Intelligence Tests
They feature large, carefully collected sets of normative data.
That is, the manual for each Wechsler test includes norms collected from about 2,000 people
have a number of notable strengths: They have impressive reliability and validity; they feature comprehensive and recent normative data; they cover an extremely wide age range; they provide full-scale, index, and subtest scores that have great clinical utility; and, at this point in their history, they are very familiar to most clinical psychologists.
Wechsler Intelligence Tests
On the other hand, these tests have received criticism for some limitations: Some subtests may be culturally loaded or biased, the connection between the tests and day-to-day life (ecological validity) may be limited, and scoring can be complex or subjective on some subtests
Stanford-Binet Intelligence Scale
It is administered face-to-face and one-on-one
It employs a hierarchical model of intelligence and therefore yields a singular measure of full-scale IQ (or “g”), five factor scores, and many more specific subtest scores
Rather than three separate tests for three different age ranges, it covers the entire life span (ages 2–85+) as a single test
Stanford-Binet Intelligence Scale - 5
Five Specific Factors and Subtests:
•Fluid Reasoning
•Knowledge
•Quantitative Reasoning
•Visual-Spatial Processing
•Working Memory
Fluid Reasoning
the ability to solve novel problems
Knowledge
general information accumulated over time via personal experiences, including education, home, and environment
Quantitative Reasoning
the ability to solve numerical problems
Visual-Spatial Processing
the ability to analyze visually presented information, including relationships between objects, spatial orientation, assembling pieces to make a whole, and detecting visual patterns
Working Memory
the ability to hold and transform information in short-term memory
Wechsler Individual Achievement Test—Third Edition (WIAT-III)
a comprehensive achievement test for clients aged 4 to 50 years
administered face-to-face and one-on-one.
measures achievement in four broad areas:
Reading, Math, Written Language, Oral Language
Each of these broad areas is assessed by two to four subtests
Listening Comprehension
Paying attention to orally presented information and answering questions about it
Oral Expression
Using speech to repeat spoken material, create stories about presented pictures, providing direction, etc.)
Word Reading
Reading isolated words
Pseudoword Decoding
Using phonetic skills to sound out nonsense words, such as plore or tharch
Reading Comprehension
Reading sentences or passages and answering questions about their content
Numerical Operations
Written math problems
Math Problem Solving
Word problems, numerical patterns, statistics and probability questions, etc.
Spelling
Increasingly difficult words
Sentence and Essay Composition
Constructing sentences, paragraphs, or essays as instructed