Diagnostic Tests and Probability in Diagnostic Decision Making (week 4)
1/123
There's no tags or description
Looks like no tags are added yet.
Name | Mastery | Learn | Test | Matching | Spaced | Call with Kai |
|---|
No analytics yet
Send a link to your students to track their progress
124 Terms
Diagnostic testing
used to determine a specific disease condition or possible illnesses
Four examples of diagnostic tests
-heartworm or FeLV test
-clinical pathology parameter
-clinical sign (such as cranial drawer test)
-radiographic sign
Three types of data
1.) nominal
2.) ordinal
3.) continuous
nominal data
results are either a "yes" or "no" such as SNAP tests for heartworm
ordinal data
data categorized as mild, moderate, severe or high, medium, low; ex is urinalysis strips
continuous data
scale with known intervals, such as kidney values or liver enzymes
for continuous data, there are _____-_____ values
cut-off
Test result
apparent disease status based on a diagnostic test result
The words ______ or ________ refer to a test result
positive; negative
Disease status
Presence or absence of a health condition; assumed or known
The words ________ or __________ refer to a disease status
diseased or not diseased
probability
The extent to which an event is likely to occur, measured by the ratio of the cases where the event occurs to the cases possible
probabilities will range between ____ and ___
0 (will never happen) and 1 (will always happen)
Probability can be defined at two levels:
1.) population level
2.) individual level
population level probability
The proportion of animals in a population with a test result or disease status
individual level probability
Probability of a test result or disease status within an individual
Pre-test probability
The likelihood that the animal has the disease prior to the
diagnostic test
Three things pre-test probability is influenced by:
1.) prevalence in the population
2.) risk factors
3.) clinical exam findings
Example of prevalence in the population and pre-test probability
The prevalence of Salmonella in dairy cows in Ohio is 10%. We randomly select a single dairy cow from Ohio. The probability of the cow of being positive for Salmonella (prior to a culture) is 10%
Example of risk factors and pre-test probability
Cows close to calving have twice the risk of being positive for Salmonella
Example of clinical exam findings and pre-test probability
Cow with diarrhea is more likely to have Salmonella
Two types of disease testing:
1.) screening for disease
2.) testing for diagnosis
screening for disease
Apparently healthy individuals are systematically tested for the purpose of detecting a (often subclinical) disease
When screening for disease, the pre-test probability is equal to the...
prevalence
Testing for diagnosis
Individuals with clinical signs of disease are tested with the aim of diagnosing disease
When testing for diagnosis, the pre-test probability will be the cumulative probability given (4):
1.) prevalence
2.) risk factors
3.) clinical history
4.) clinical signs
True positive
a positive test in an animal known to have the disease
False positive
a positive test in an animal known to not have the disease
True negative
a negative test in an animal known to not have the disease
False negative
a negative test in an animal known to have the disease

1
test positive

2
test negative

3
diseased
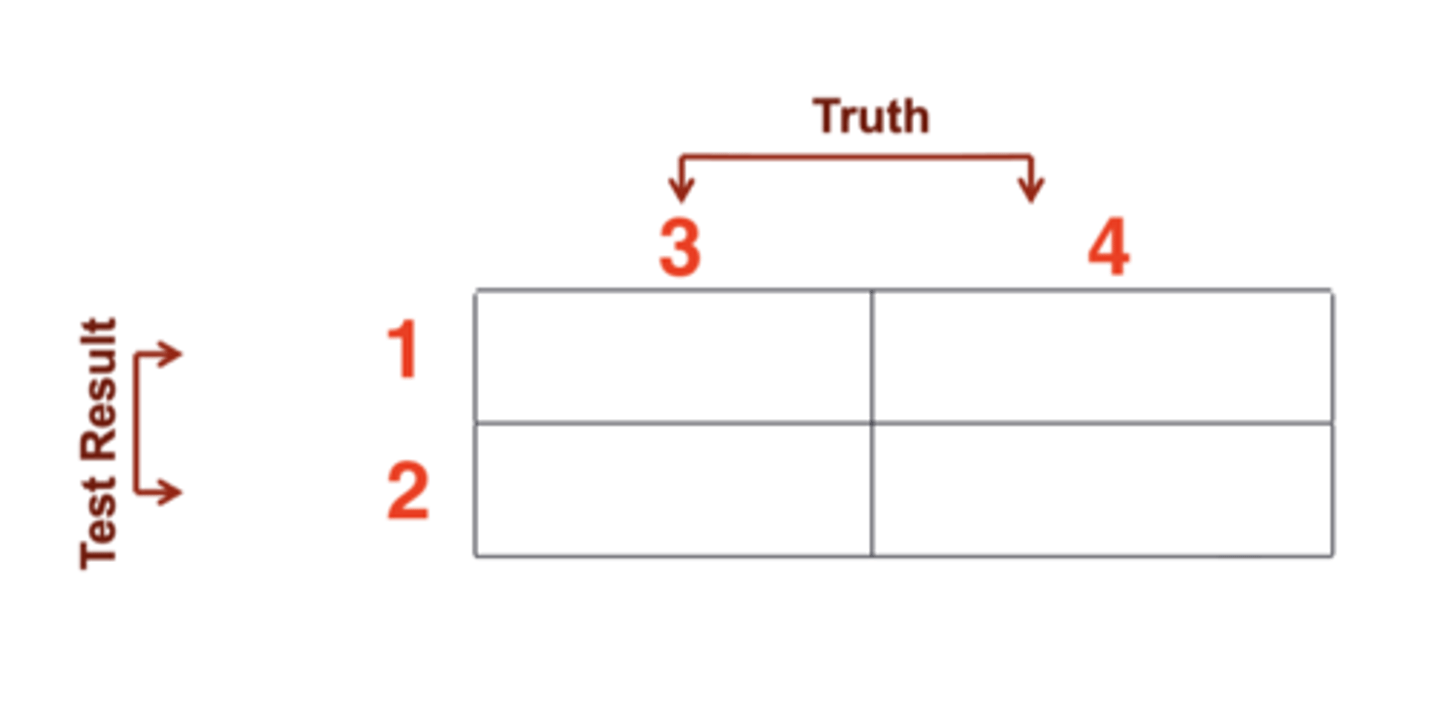
4
not diseased

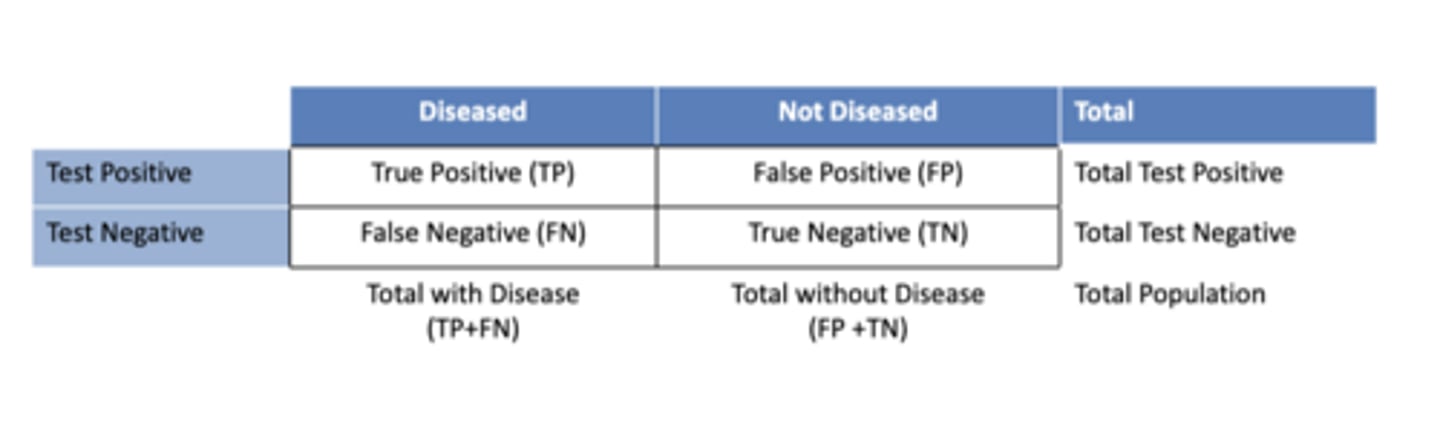
a
true positive

b
false positive

c
false negative

d
true negative

a + b
total test positive

c + d
total test negative

a + c
total with disease
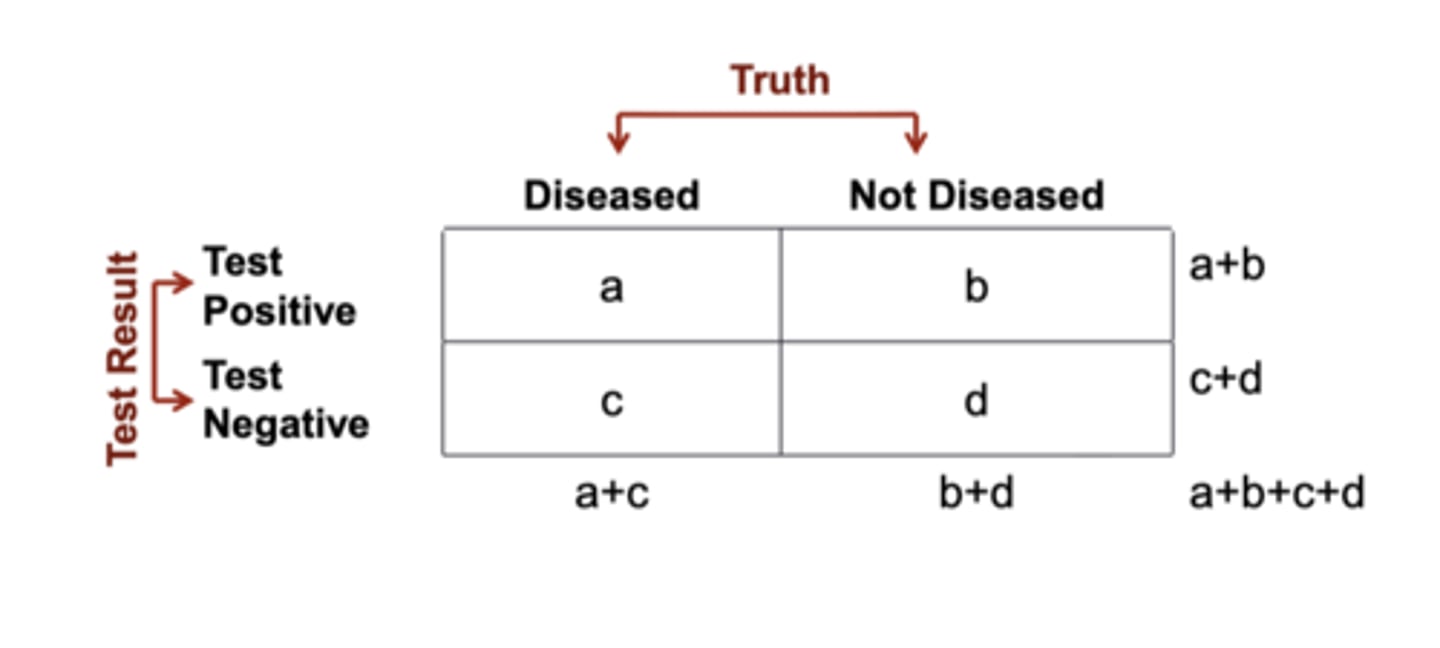
b + d
total without disease

a + b + c + d
total population
True prevalence equation
total diseased / total population
Apparent prevalence equation
total test positive / total population
*what is actually measured
Post-test probability
The likelihood that the animal has the disease after the diagnostic test
Post-test probability is aka...
predictive values
The post-test probability depends on two things:
1.) pre-test probability
2.) characteristics of the test (sensitivity and specificity)
If a test is useful, the post-test probability will be ________ than the pre-test probability
higher
If a test is worthless, the post-test probability will be ________ than the pre-test probability
lower
The magnitude of change between the pre and post-test probability depends on...
sensitivity and specificity
Some tests are better than others. How can we objectively measure test performance?
-Calculate sensitivity, specificity, PPV, and NPV.
-apply measures of sensitivity and specificity in clinical scenarios
Sensitivity
The proportion of animals that test positive out of a number of animals known to have the disease
Sensitivity is the probability of a _________ test in an animal ________ to have the disease
positive; known
Equation for sensitivity
true positives / (true positive + false negative)
Specificity
The proportion of animals that test negative out of a number of animals known to not have the disease
Specificity is the probability of a ___________ test in an animal known to _______ _______ the disease
negative; not have
Specificity equation
true negative / (false positive + true negative)
In a group of ten cattle known to have a disease, if the sensitivity is 80%, how many test positive and how many test negative?
positive: 8 (true positive)
negative : 2 (false negative)
In a group of ten cattle known to not have a disease, if the specificity is 80%, how many test positive and how many test negative?
positive: 2 (false positive)
negative: 8 (true negative)
Positive predictive value
The proportion of positive test results that are from diseased animals
Positive predictive value is the probability of __________ in an animal with a __________ test result
disease; positive
Positive predictive value equation
true positive / (true positive + false positive)
Another way of looking at positive predictive value is, "now that I have a __________ test result, what is the probability it is correct?"
positive
Negative predictive value
The proportion of negative test results that are from non-diseased animals
Negative predictive value is the probability that an animal __________ have the disease when the test result is _________
does not; negative
Negative predictive value equation
true negatives / (true negatives + false negatives)
Another way of looking at negative predictive value is, "now that I have a ________ test result, what is the probability it is correct?"
negative
"Ruling in" a diagnosis
The diagnosis is sufficiently likely that no other possibilities should be considered
"Ruling in" a diagnosis is a result of having a high ________ predictive value
positive
"Ruling out" a diagnosis
The diagnosis is sufficiently unlikely that it should no longer be considered as a possibility
"Ruling out" a diagnosis is a result of having a high ________ predictive value
negative
Sensitivity and specificity represent a...
head-to-head comparison of diagnostic tests
Are sensitivity and specificity dependent on pre-test probability?
no!
Predictive values represent...
the level of certainty of a diagnosis
Are predictive values dependent on pre-test probability?
yes!
Test characteristics (sensitivity and specificity) are the probability of a __________ _________ when we know the _________ ________
test result; disease status
Predictive values (PPV and NPV) are the probability of a __________ _________ when we know the _________ ________
disease status; test result
Sensitivity is the probability of a _________ test result when we know an animal _________ diseased
Specificity is the probability of a _________ test result when we know an animal _________ diseased
positive; is diseased
negative; isn't diseased
Positive predictive value is the probability of a _________ when we know the test is __________
Negative predictive value is the probability of a _________ when we know the test is __________
disease; positive
lack of disease; negative
A lower sensitivity means there will be more...
false negatives
More false negatives means there will be a ___________ positive predictive value
higher
A lower specificity means there will be more...
false positives
More false positives means there will be a ___________ positive predictive value
lower

Based on this information, fill out the table:
a: 175
b: 1
c: 33
d: 31
e: 208
f: 32
g: 176
h: 64
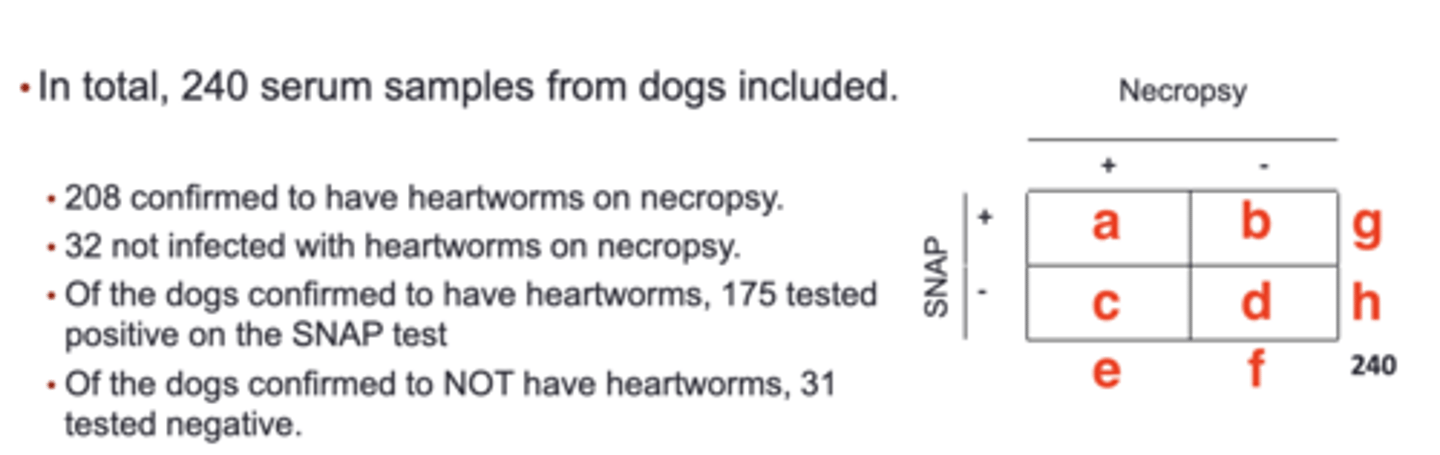
Based on this information, calculate sensitivity and specificity:
sensitivity: 175/208= 84%
specificity: 31/32= 97%
Three things you will need to calculate predictive values:
1.) pre-test probability
2.) sensitivity
3.) specificity
Five steps for calculating predictive values:
1.) start with hypothetical population (such as 10,000 animals)
2.) determine the number of diseased and non-diseased animals based on the pre-test probability
3.) apply the estimates for specificity and sensitivity
4.) complete the 2 X 2 table
5.) calculate the predictive values
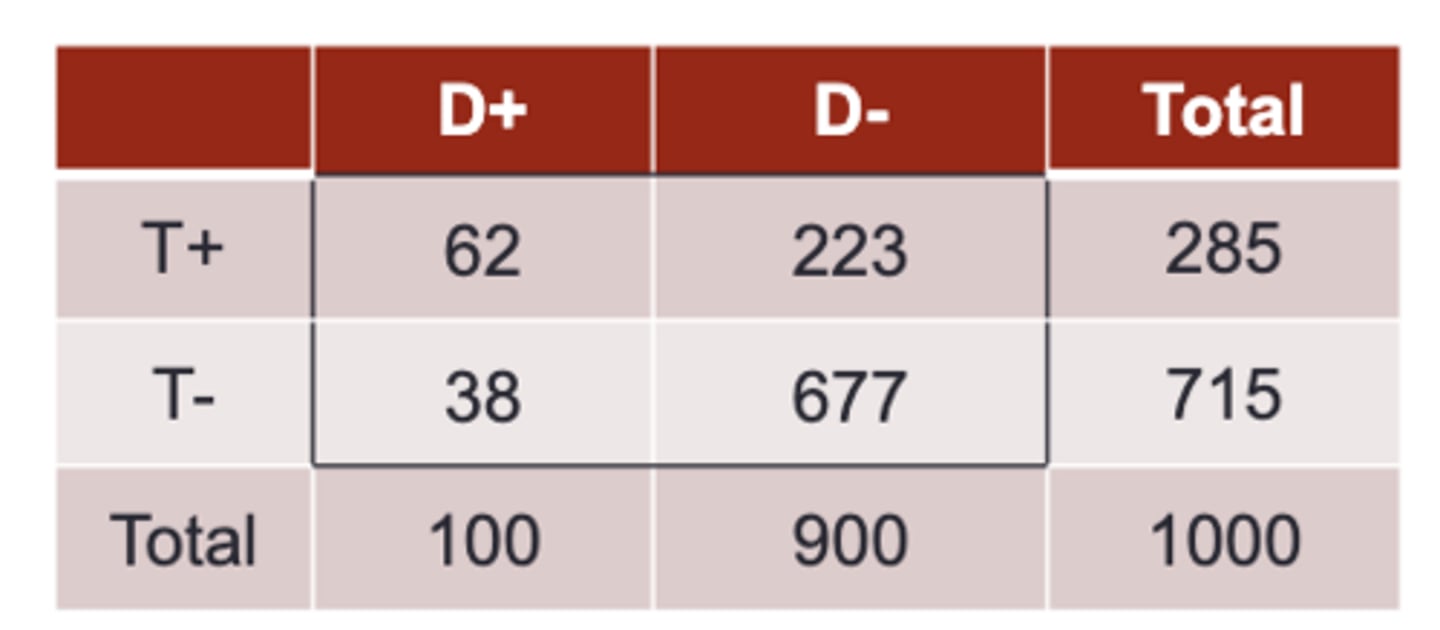
Fill out the 2 X 2 table based on the information given about bovine respiratory disease:
Signs of clinical illness have been shown to have a diagnostic sensitivity and specificity of 61.8% and 75.3%, respectively
In a feedlot of cattle, the prevalence of respiratory disease is 10%
If a single ride through doesn't identify a diseased calf, how sure are we that the calf doesn't have respiratory
disease?
1.) First choose a hypothetical population
total population: 1,000 cattle
2.) Determine the # of diseased and non diseased based on pre-test probability
total with disease: (1,000 x .10) = 100
total without disease: (1,000 - 100) = 900
3.) Apply the estimates for sensitivity and specificity
true positive: (.618 x 100) = 62
true negative: (.753 x 900) = 677
false positive: (900 - 677) = 233
false negative: (100 - 62) = 38
4.) Finish the table by addition
total test positive: (62 + 233) = 285
total test negative: (38 + 677) = 715
Signs of clinical illness have been shown to have a diagnostic sensitivity and specificity of 61.8% and 75.3%, respectively
In a feedlot of cattle, the prevalence of respiratory disease is 10%
If a single ride through doesn’t identify a diseased calf, how sure are we that the calf doesn’t have respiratory
disease?
How sure we are that the calf doesn't have disease is asking for negative predictive value:
Negative predictive value = true negative / total test negative
Negative predictive value = 677 / 715 = 95%

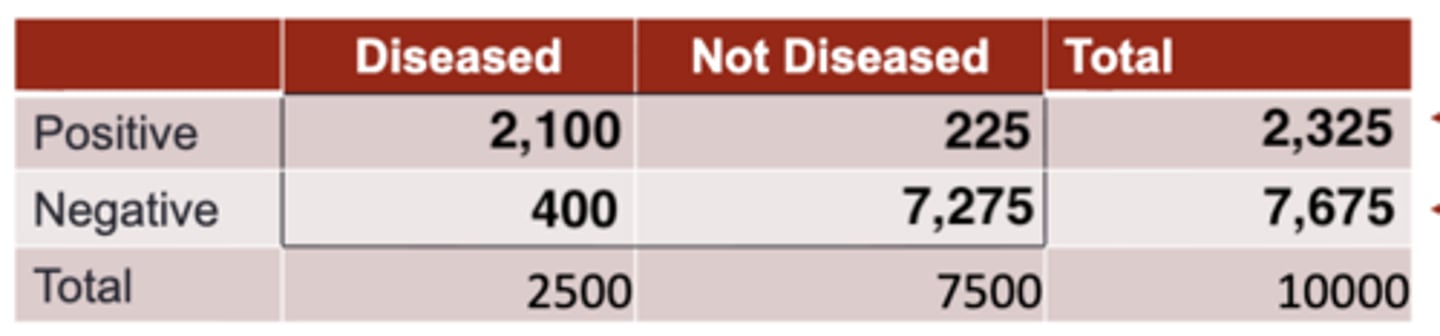
Fill out the 2 X 2 table based on the information given about heartworm disease:
A five-year-old outdoor
laboratory retriever presents to you for exercise intolerance, weight
loss, coughing, and fatigue.
The dog is not on heartworm
preventive and the SNAP test is positive
What's the probability that it is
correct, given a pre-test probability of 25%, sensitivity of 84%, and specificity of 97%?
1.) First choose a hypothetical population
total population: 10,000
2.) Determine the # of diseased and non diseased based on pre-test probability
total with disease: (10,000 x .25) = 2,500
total without disease: (10,000 - 2,500) = 7,500
3.) Apply the estimates for sensitivity and specificity
true positive: (.84 x 2,500) = 2,100
true negative: (.97 x 7,500) = 7,275
false positive: (7,500 - 7,275) = 225
false negative: (2,500 - 2,100) = 400
4.) Finish the table by addition
total test positive: (2,100 + 225) = 2,325
total test negative: (400 + 7,275) = 7,675
A five-year-old outdoor
laboratory retriever presents to you for exercise intolerance, weight
loss, coughing, and fatigue.
The dog is not on heartworm
preventive and the SNAP test is positive
What’s the probability that it is
correct, given a pre-test probability of 25%, sensitivity of 84%, and specificity of 97%?
Probability the test is correct is asking for positive predictive value:
positive predictive value = true positives / total positives
positive predictive value = 2,100 / 2,325 = 90%
Continuous data
scale with known intervals, such as kidney values or liver enzymes
For a continuous data set, there are ____-____ values
cut-off values
Advantages to cut-off values for continuous data:
1.) communicating
2.) clinical decisions are often dichotomous
3.) necessary to calculate the post-test probability of disease
Disadvantage to cut-off values for continuous data:
oversimplification of complex disease processes
An increase in a cut-off value for continuous data will ________ the amount of false positives and ____________ the amount of true negatives
decrease; increase
An increase in a cut-off value for continuous data will _______ specificity
increase
A decrease in a cut-off value for continuous data will ________ the amount of false positives and _______ the amount of true negatives
increase; decrease
An decrease in a cut-off value for continuous data will _______ specificity
decrease