AP Micro - GRAPHS
1/34
There's no tags or description
Looks like no tags are added yet.
Name | Mastery | Learn | Test | Matching | Spaced | Call with Kai |
|---|
No analytics yet
Send a link to your students to track their progress
35 Terms
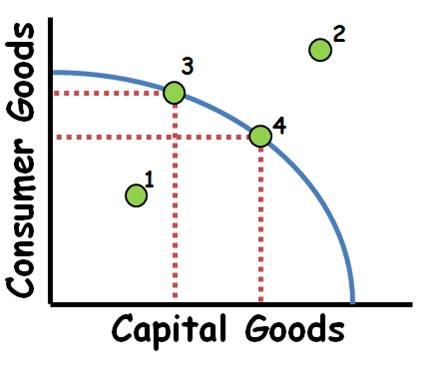
Production possibilities curve
Maximum combinations of two different goods (or categories of goods) that can be produced
Concave curve indicated increasing opportunity costs due to imperfectly adaptable resources
Linear curve indicates constant opportunity costs due to perfectly adaptable resources
Points outside the curve are impossible because of scarcity
Greater quality or quantity of resources expands the curve (outward shift)
Can affect just one side
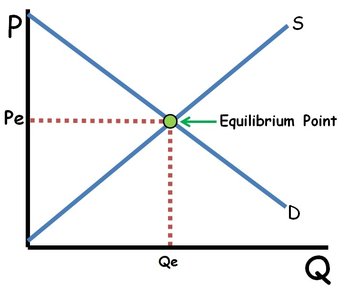
Supply and Demand
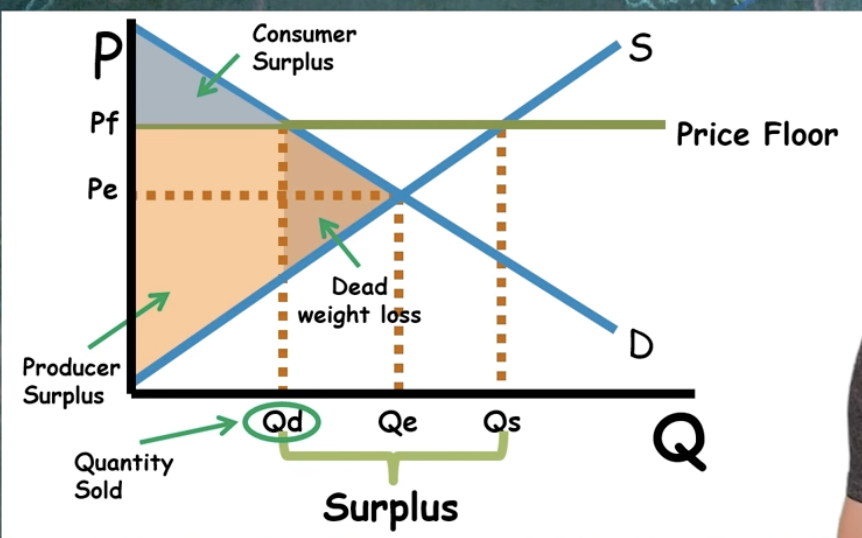
Price floor
When price is above equilibrium: surplus (price floor has to be above to be binding)
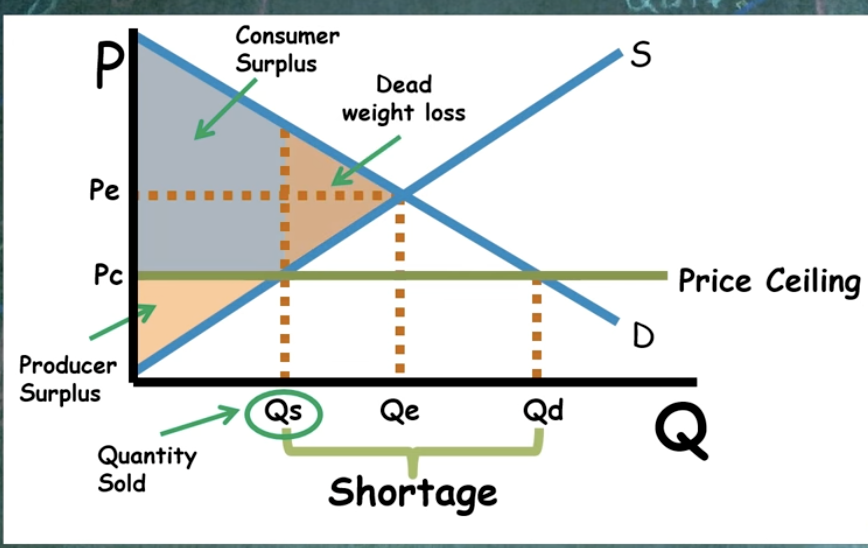
Price ceiling
When price is below equilibrium: shortage (price ceiling has to be below to be binding)
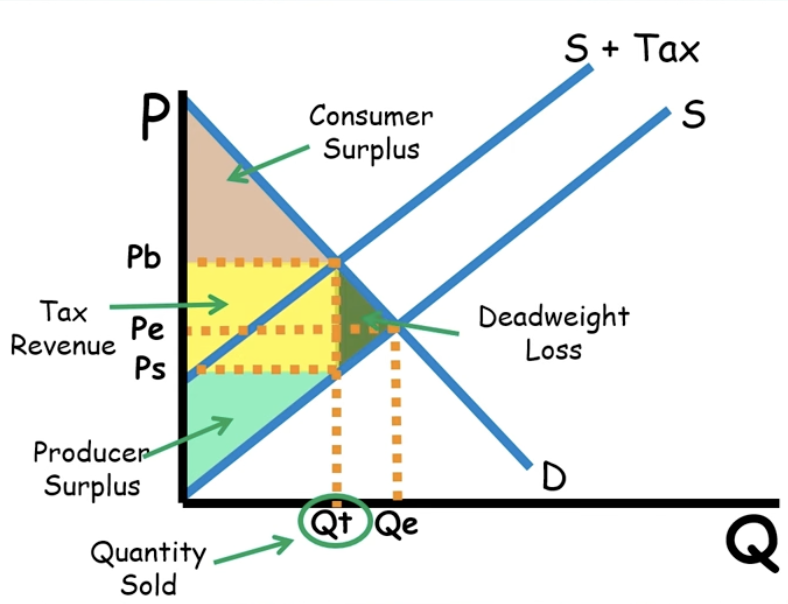
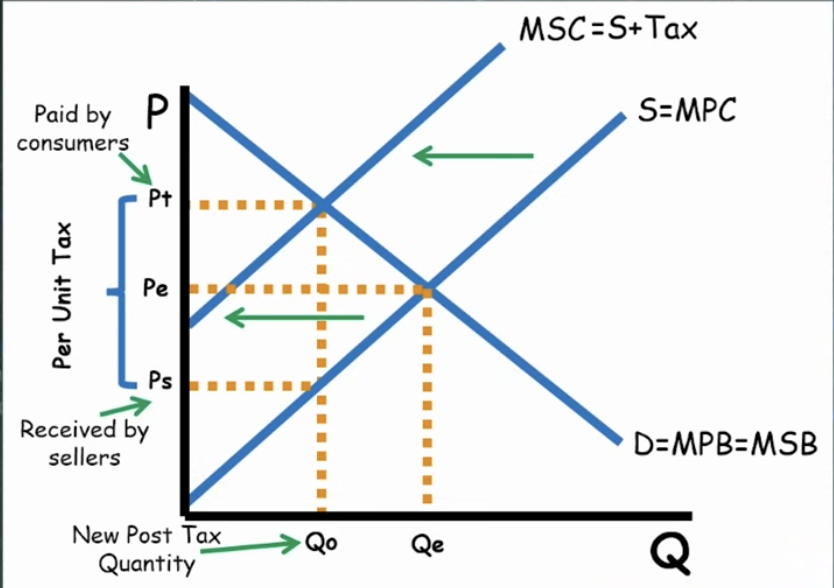
Excise tax
Per-unit tax
More inelastic = More tax burden
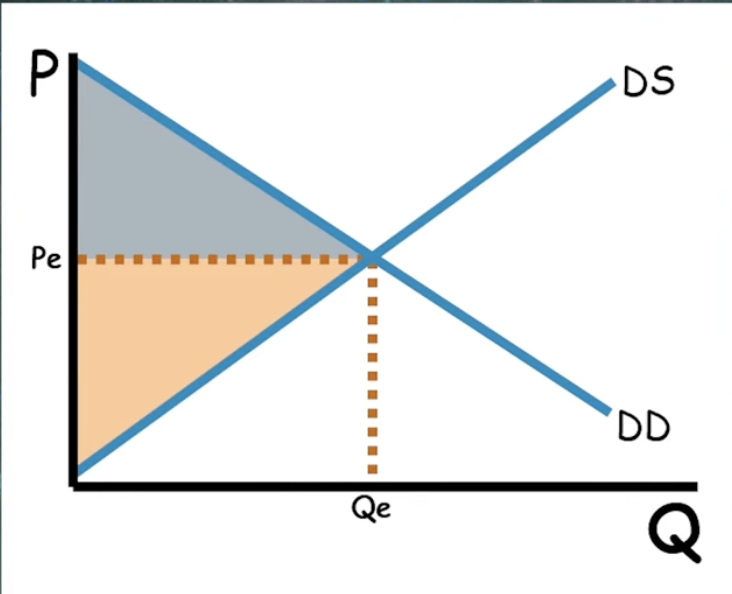
Autarky graph
An autarky graph represents a country's market in a state of self-sufficiency or isolation, where no international trade occurs
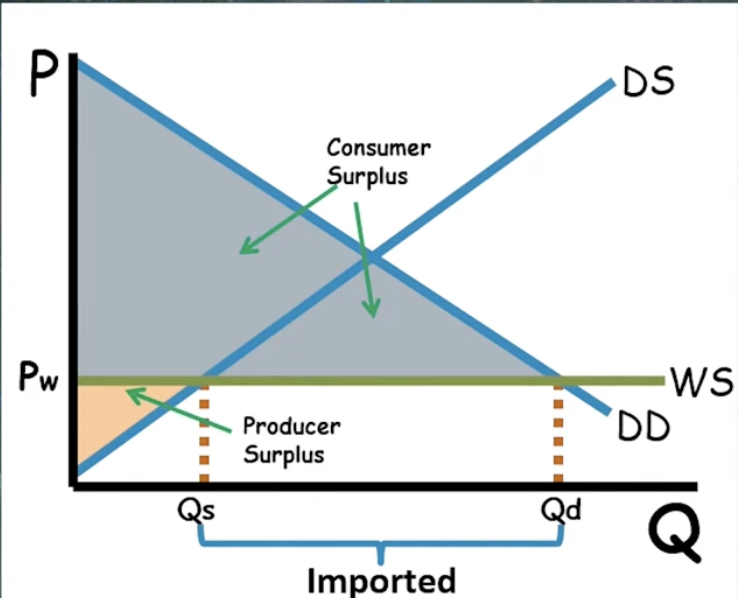
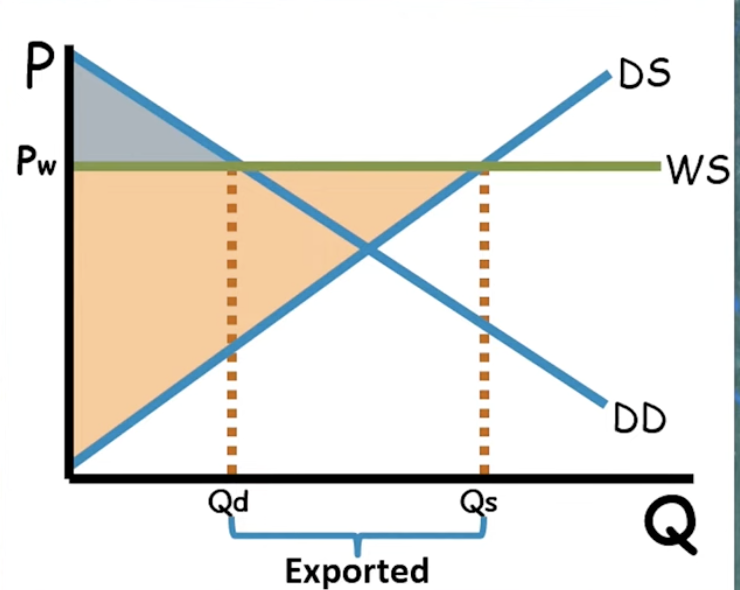
World trade graph - low world price
World trade graph - high world price
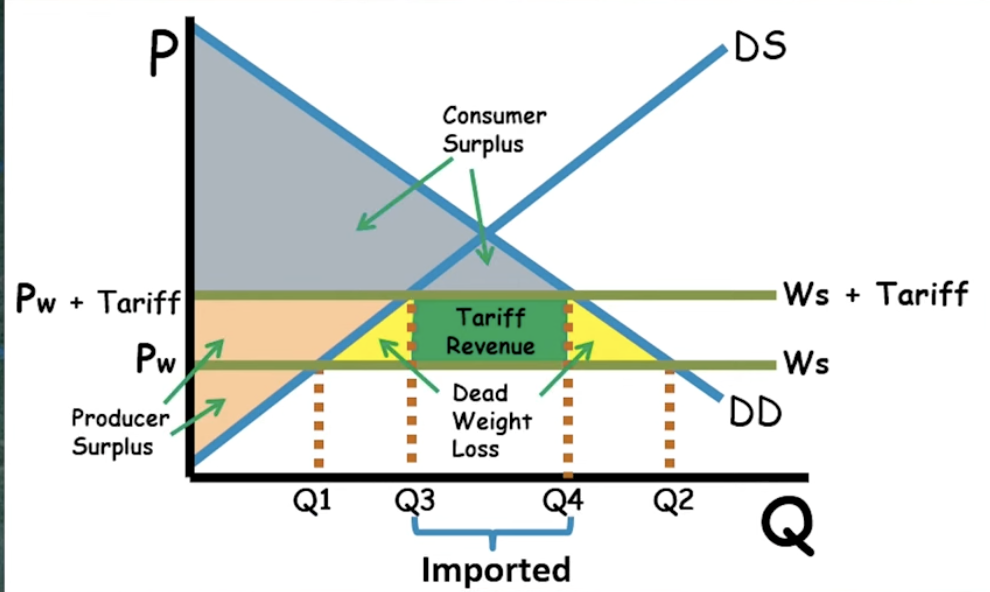
World trade graph - with tariff
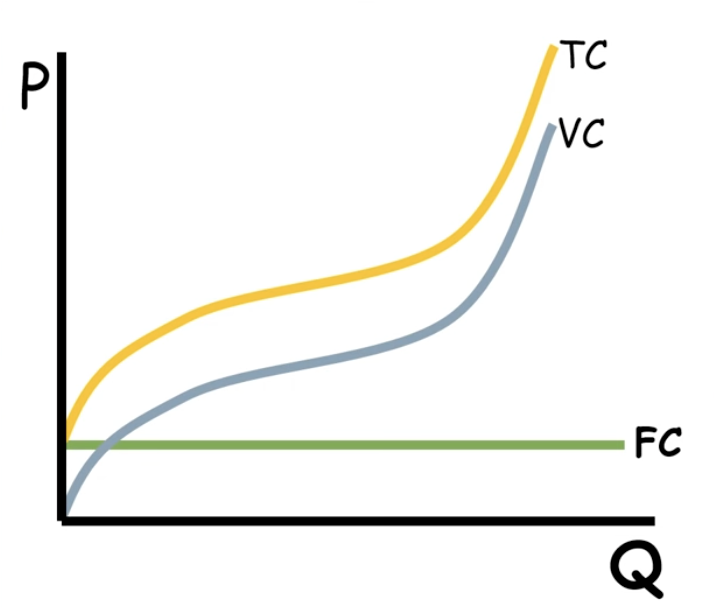
Total cost curves
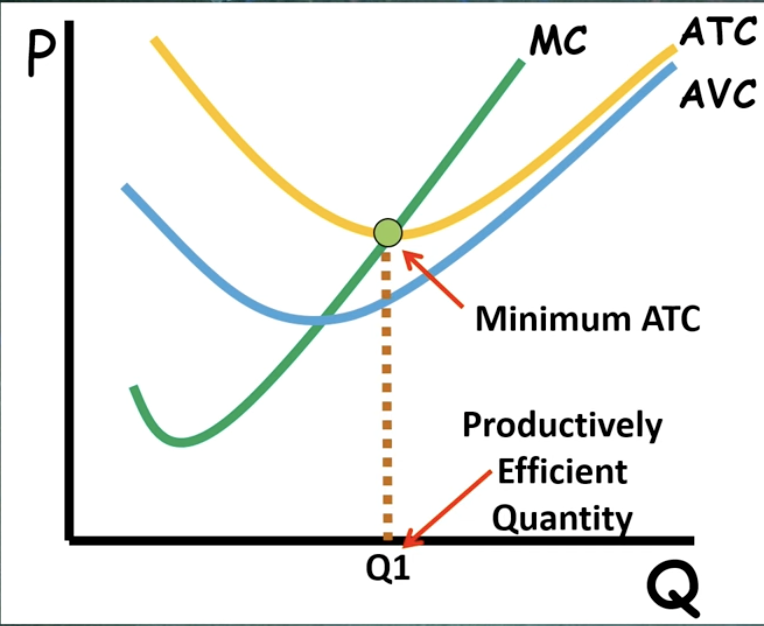
Average cost curves
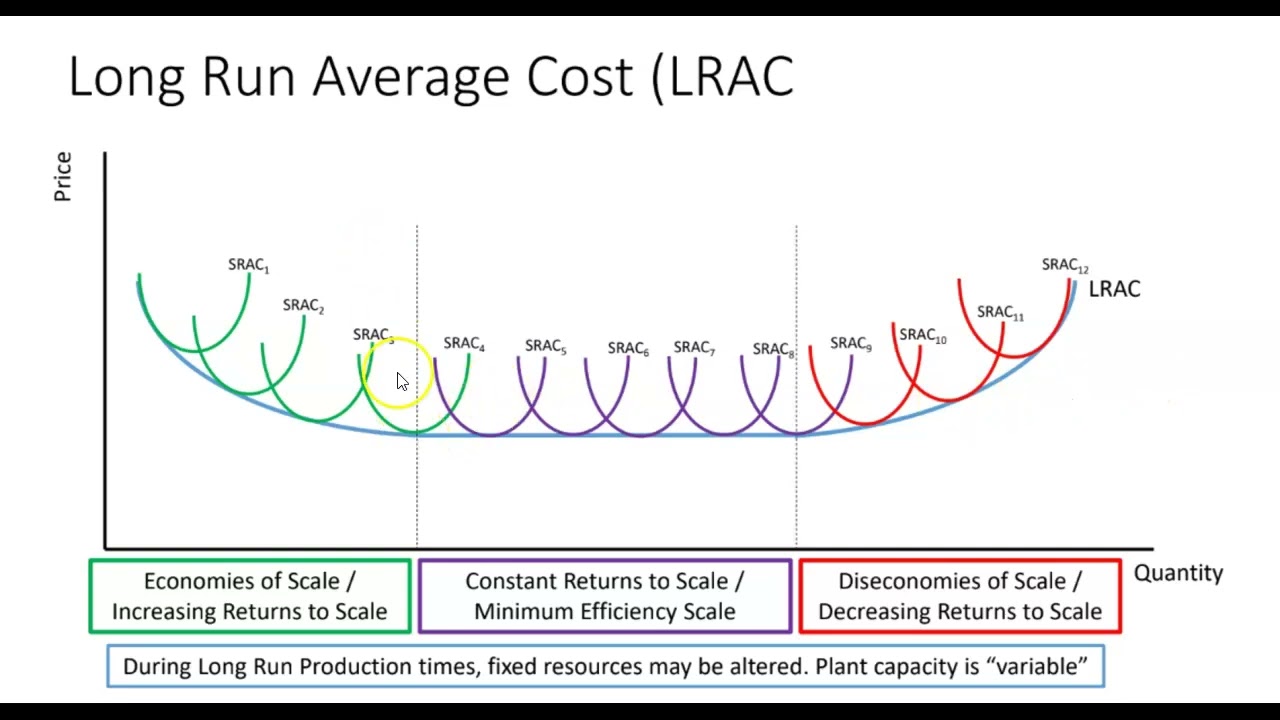
Long-run ATC
Perfect competition
MR = MC
In the long run: no economic profit
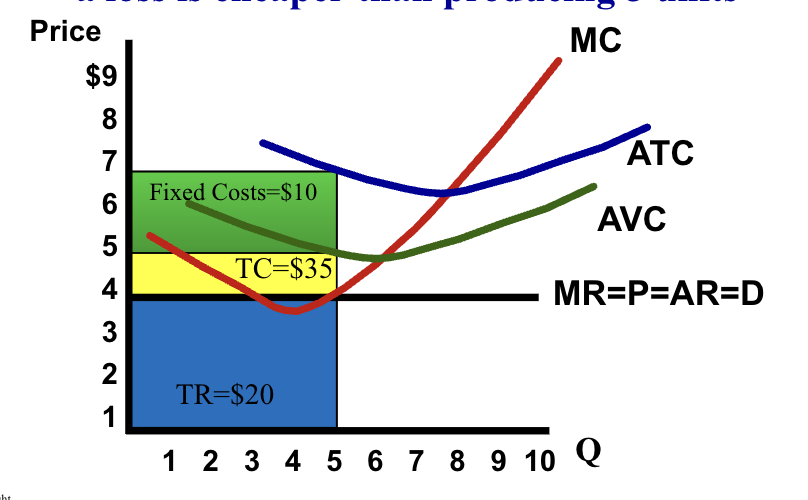
Perfect competition - shut down
P < Minimum AVC: Shut down
The firm’s supply curve is the marginal cost above the minimum of the average variable cost
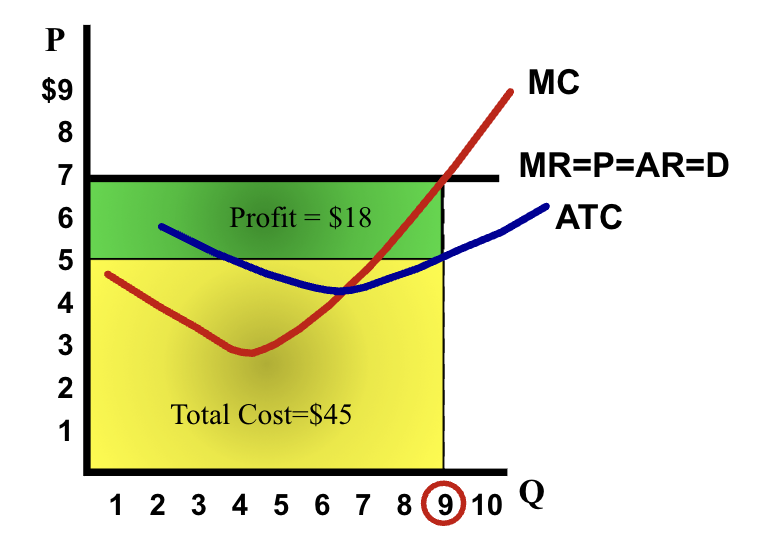
Monopoly
MR = MC
Price up to demand
Earns economic profit in the long run
ATC is long run ATC (capture economies of scale)
Productively efficient: when min ATC = MC
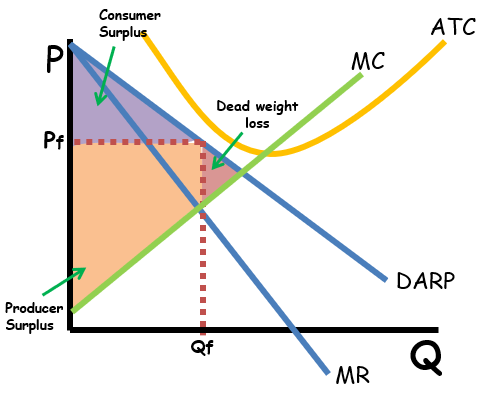
Monopoly - consumer and producer surplus
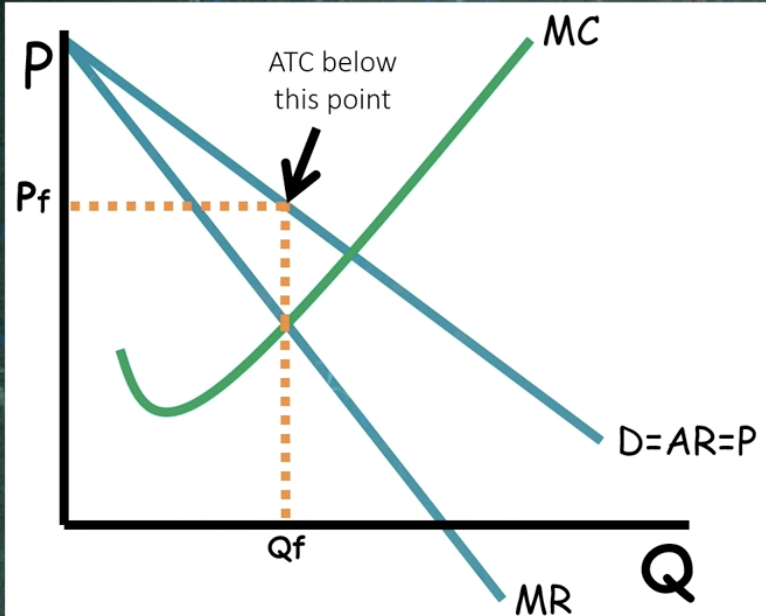
Monopoly - economic profit
ATC below this point
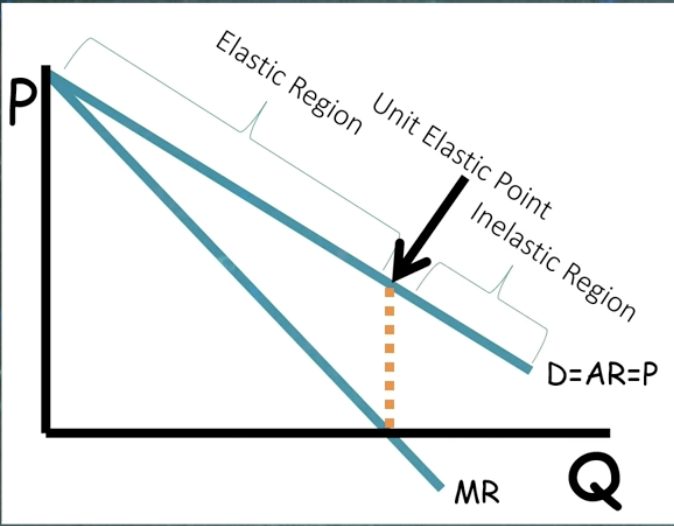
Monopoly graph elasticities
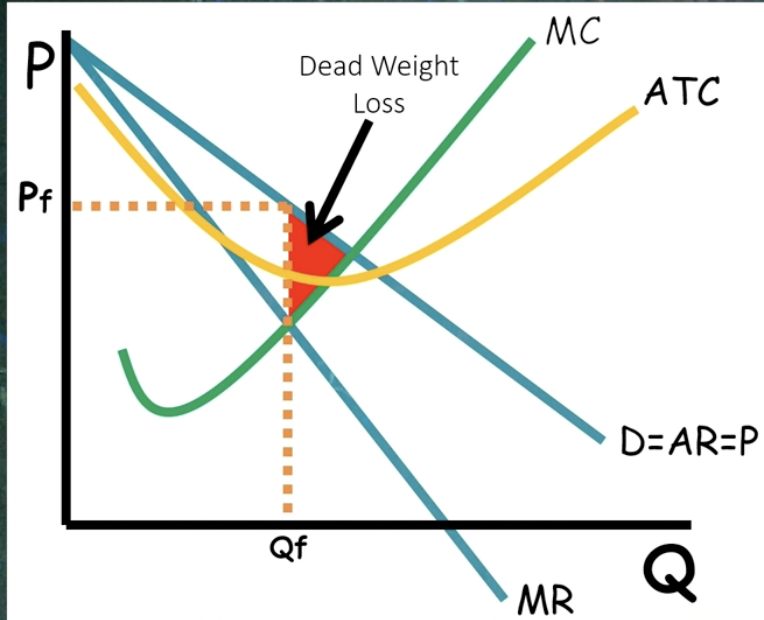
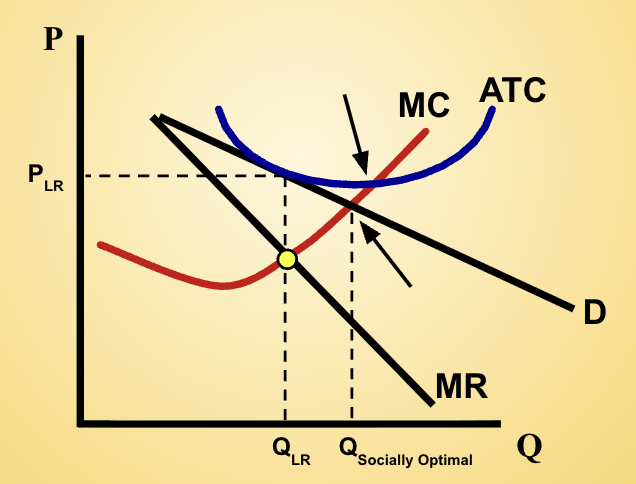
Natural monopoly
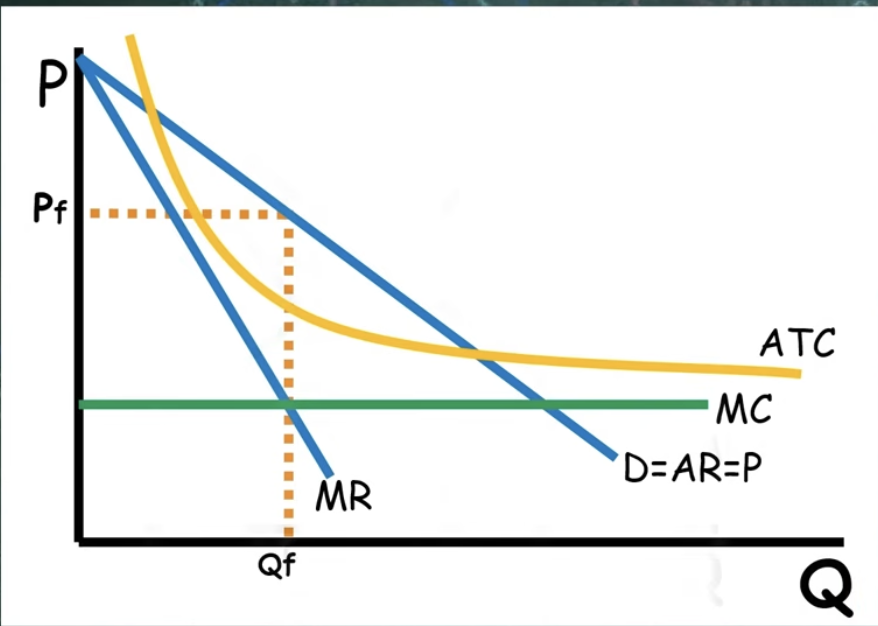
Unregulated natural monopoly
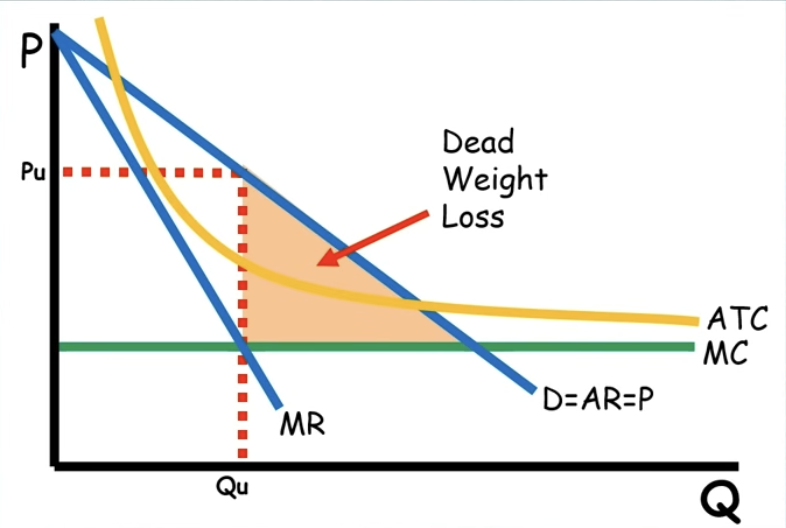
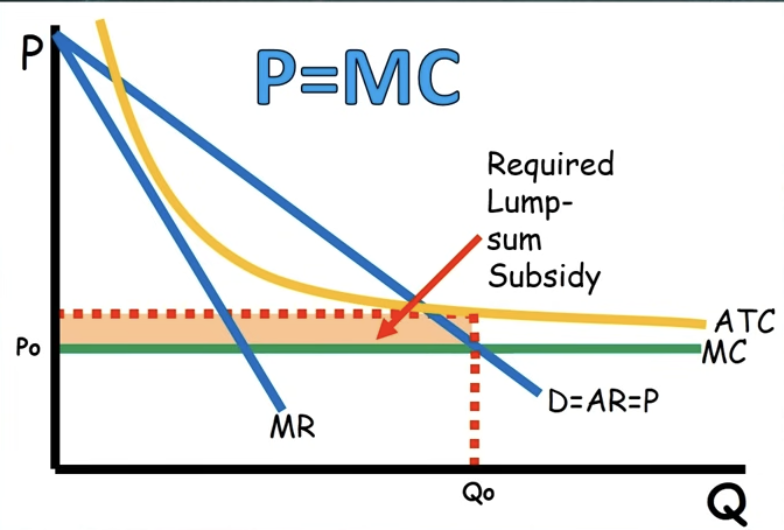
Natural monopoly - socially optimal price ceiling
P = MC
Earns economic losses
Gov has to give them lump sum subsidy
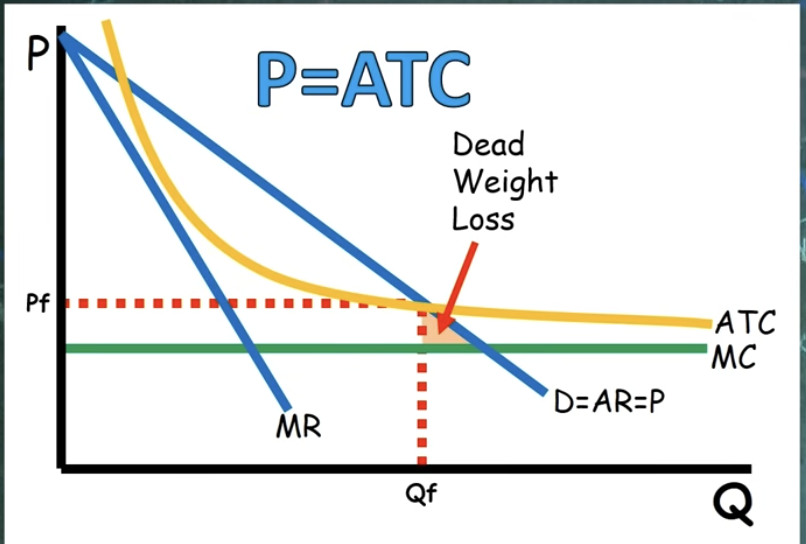
Natural monopoly - fair return price
P = ATC
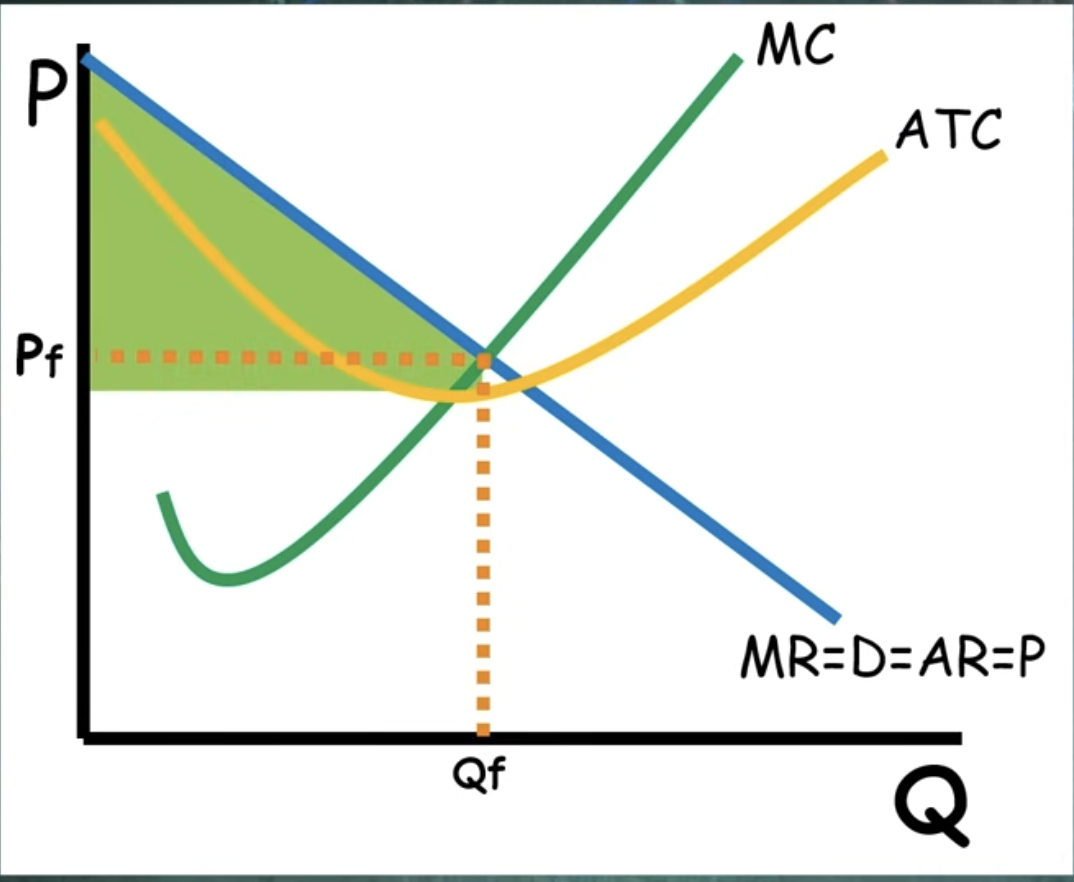
Price discriminating monopoly
MR = D = AR = P
Allocatively efficient (no DWL)
Turn consumer surplus into profit
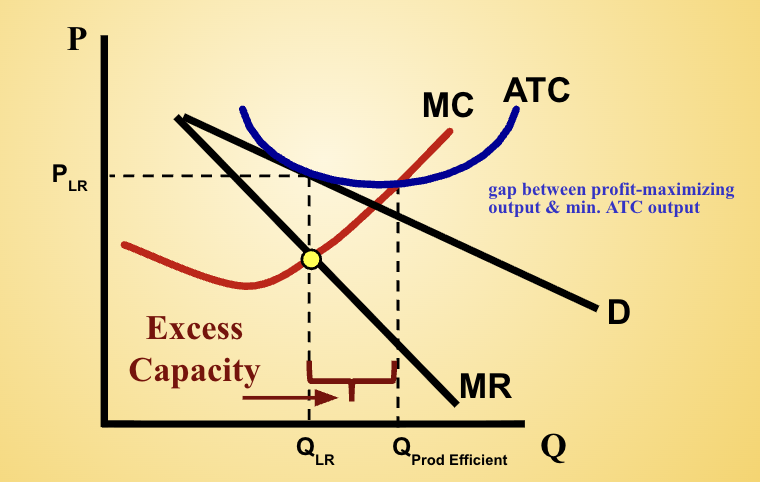
Monopolistic competition
Similar to monopoly graph (but demand curve flatter or more elastic)
Breaks even in the long run but can earn economic profits in the short run
When earning profit: demand and MR shift left to return to breaking even (opposite for loss)
Monopolistic competition - excess capacity
Gap between profit-maximizing output and min. ATC output (productively efficient output)
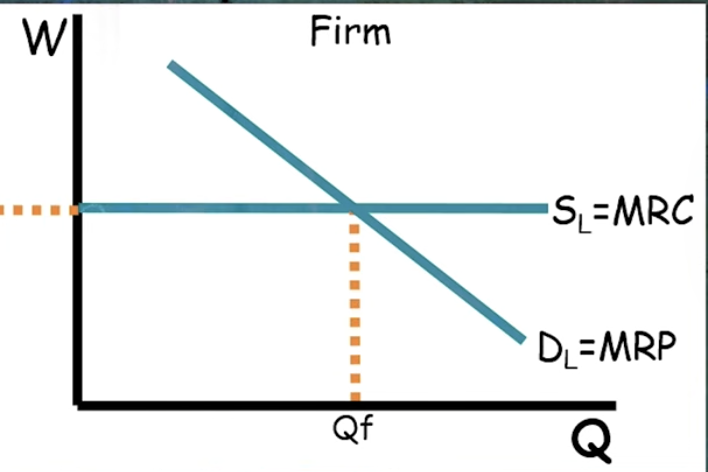
Factor market
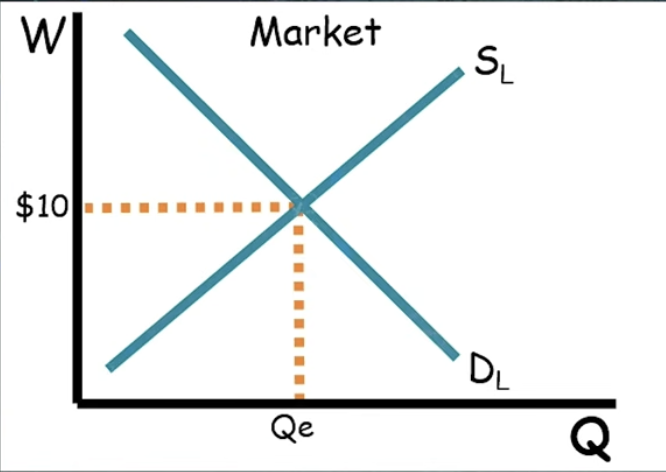
Perfectly competitive factor market - one firm
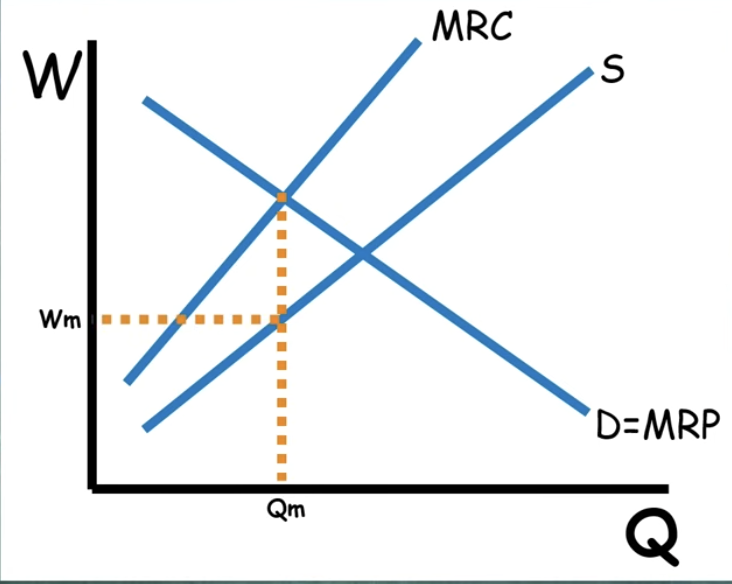
Monopsony
Hire where MRP = MRC
Wage is at supply below
DWL in triangle
Only one buyer
Firm is wage-maker:
To hire additional workers, the firm must increase the wages for all workers
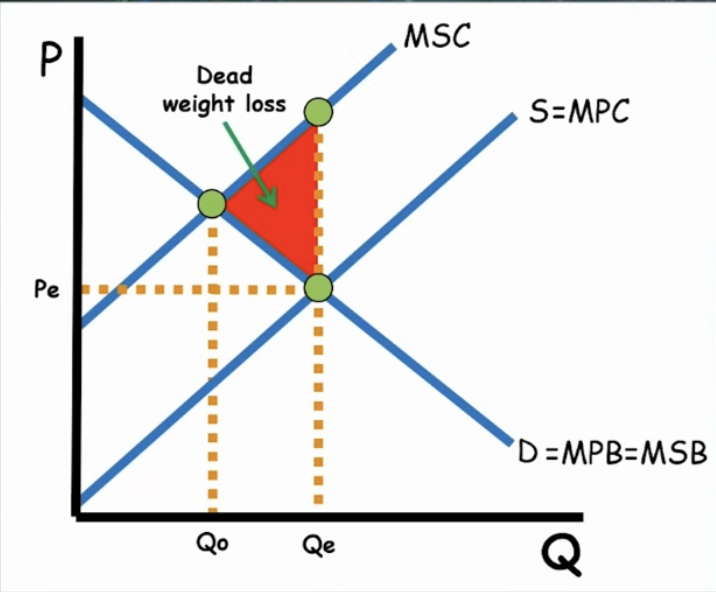
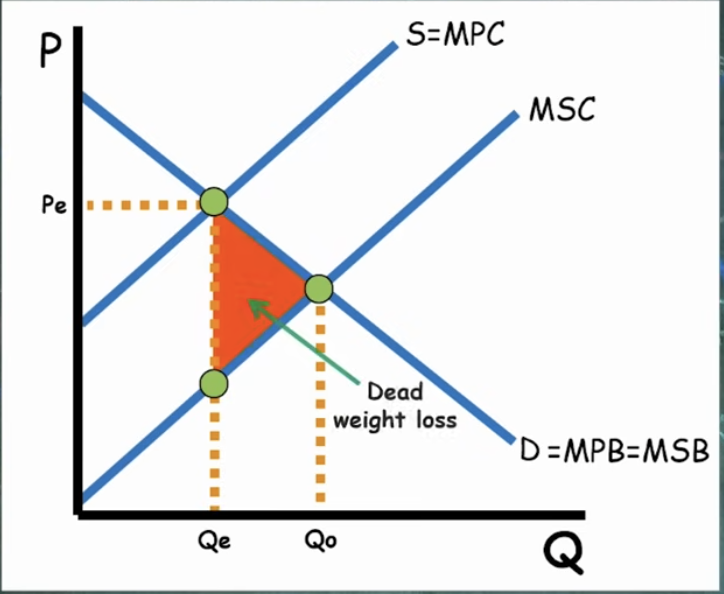
Negative externality in production
DWL is arrow towards NEW equilibrium
Affects supply curve
Negative externality in consumption
DWL is arrow towards NEW equilibrium
Affects demand curve
Negative externality - correction with per-unit tax
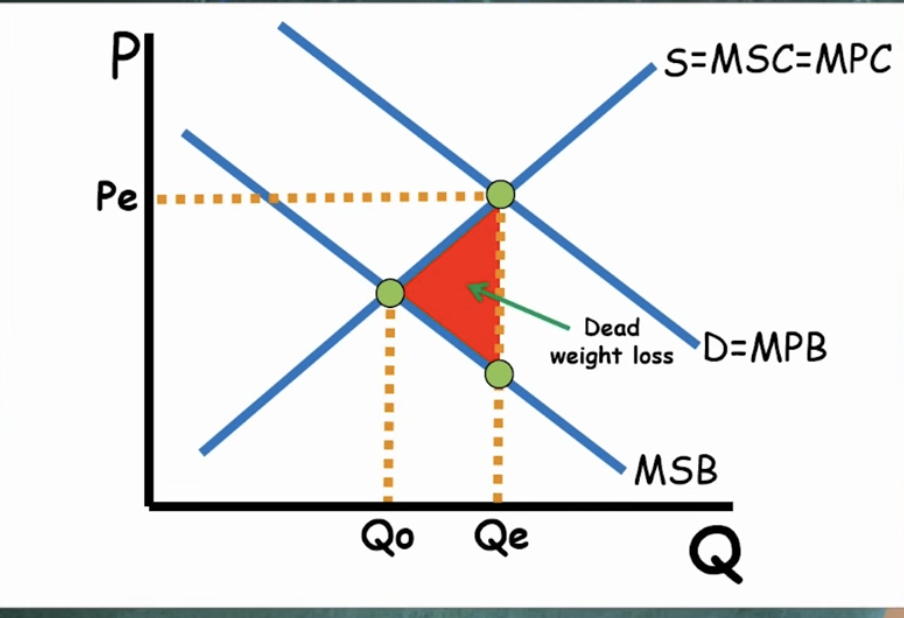
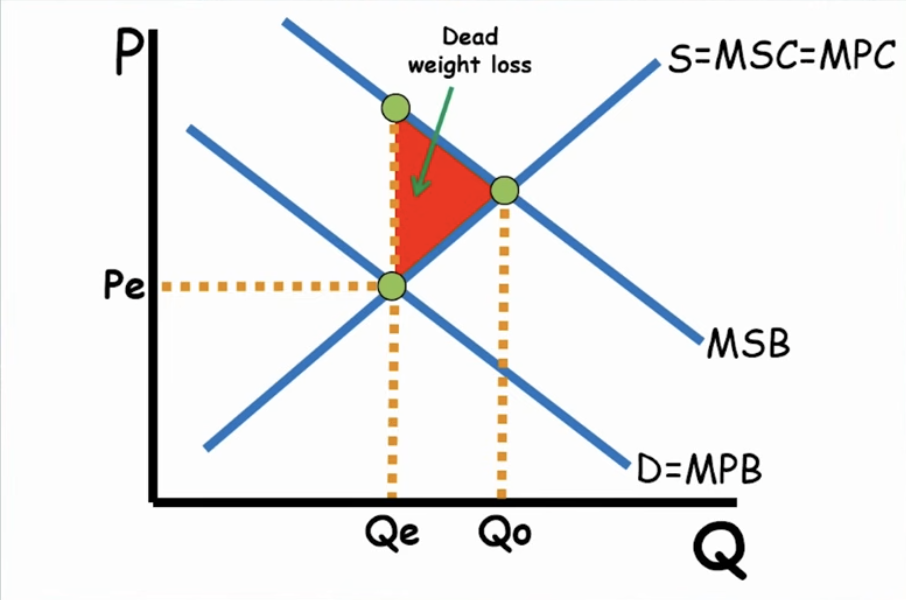
Positive externality in production
DWL is arrow towards NEW equilibrium
Affects supply curve
Positive externality in consumption
DWL is arrow towards NEW equilibrium
Affects demand curve
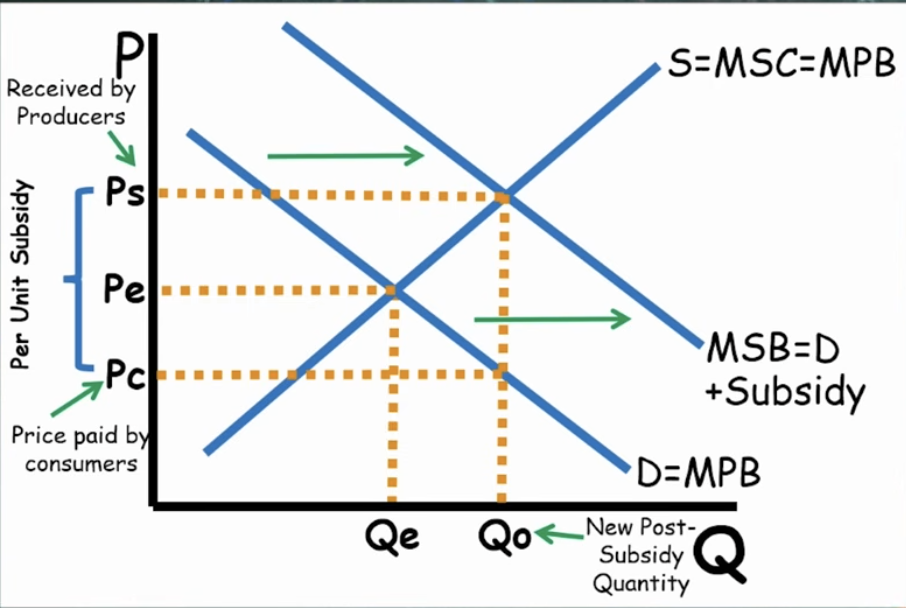
Positive externality - correction with per-unit subsidy
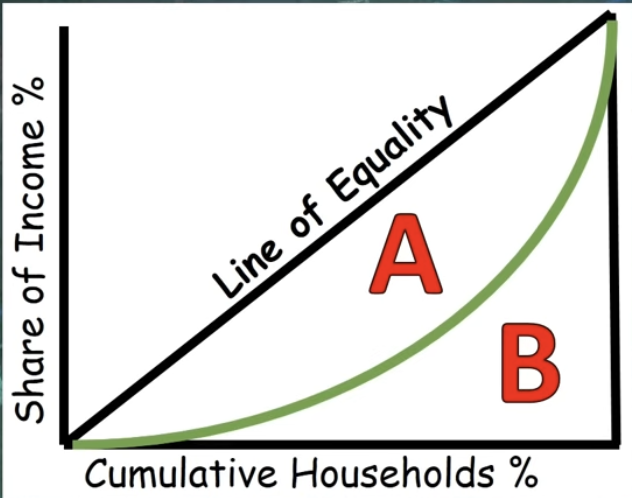
Lorenz curve
Measures income distribution
The closer the Lorenz curve is to the line of equality, the more equal the distribution of income is within that society