research methods
1/77
There's no tags or description
Looks like no tags are added yet.
Name | Mastery | Learn | Test | Matching | Spaced | Call with Kai |
|---|
No analytics yet
Send a link to your students to track their progress
78 Terms
nature-nurture issue
the longstanding controversy over the relative contributions that genes and experience make to the development of psychological traits and behaviors; today’s science sees traits and behaviors arising from the interaction of nature and nurture
predisposition
the tendency to develop certain genes because of family but not guaranteed
twin studies
because identical twins have the same genes, they are ideal to participate in studies designed to shed light on hereditary and environmental influences on intelligence, personality, and other traits; studies of identical and fraternal twins provide a rich array of findings that underscore the importance of both nature and nurture
adoption studies
studies of adopted children to see how much of their traits come from biological vs. adoptive parents
biopsychosocial approach
integrated approach that incorporates biological, psychological, and social-cultural levels of analysis
behavioral perspective
bandura - psychological approach studying observable behavior and being explained by principles of learning
biological perspective
psychological approach studying links between biological (genetic, neural, hormonal) and psychological processes (some biological psychologists call themselves behavioral neuroscientists or other things)
cognitive perspective
psychological approach studying all of the mental activities associated with thinking, knowing, remembering, and communicating
evolutionary perspective
psychological approach studying evolution of behavior and mind using principles of evolution
humanistic perspective
maslow and rodgers - psychological approach focused on how we meet our needs for love and acceptance and achieve self-fulfillment
psychodynamic perspective
freud - psychological approach studying how unconscious drives and conflicts influence behavior and then using that information to treat people with psychological disorders
social-cultural perspective
psychological approach studying how situations and cultures affect our behavior and thinking
hindsight bias
the tendency to believe, after learning an outcome, that one would have foreseen it
overconfidence
tending to think, as humans, that we know more than we do
theory
explaining and predicting behaviors or events by offering ideas that organize what we have observed
hypothesis
testable prediction, often implied by a theory; these predictions specify what results would support the theory and what would cast doubt our theories can bias our observations
null hypothesis
when the results of a study are not statistically significant, you say that there is no significant relationship, effect, or difference between the variables being studied; it proposes that any observed results are due to random chance
operational definition
carefully worded statement of the exact procedures used in a research study; describes concepts with precise procedures or measures
replicate
repeating the essence of a research study, usually with different participants in different situations, to see whether the basic finding extends to other participants and circumstances; operational definitions help a lot with this
descriptive methods
describe behaviors, often by using case studies, surveys, or naturalistic observations
correlational methods
associate different factors, or variables (anything that contributes to a result) to see how they are related
experimental methods
manipulate variables to discover their effects
case study
descriptive technique in which one individual or group is studied in depth in the hope of revealing universal principles; used often for people with things like brain injuries
naturalistic observation
observing and recording behavior in naturally occurring situations without trying to manipulate and control the situation
confirmation bias
a cognitive bias where individuals actively search for, interpret, favor, and recall information that confirms their pre-existing beliefs, while ignoring or discounting contradictory evidence
participant bias
when research subjects consciously or unconsciously alter their behavior or answers to align with what they think the researcher wants, rather than responding naturally, skewing results
longitudinal study
tracks the same individuals over an extended period (months, years, or decades) to observe changes, development, or effects
cross-sectional study
research method that collects data from different age groups or populations at a single point in time to compare them, providing a "snapshot" of developmental differences or relationships between variables
survey
technique for ascertaining the self-reported attitudes or behaviors of a particular group, usually by questioning a representative, random sample of the group; done when wanting to estimate, from a representative sample of people, the attitudes or reported behaviors of a whole population
wording effect
how subtle changes in question phrasing or order in surveys significantly influence participant responses, even if the core meaning is the same
sampling bias
produces an unrepresentative sample
population
group being studied
random sample
fairly represents a population because each member has an equal chance of inclusion
convenience sample
researchers select participants who are easy to access, like students in their own class or people at a mall, because they are readily available and convenient, rather than using random selection, leading to quick, easy, but often biased samples that aren't representative of the broader population, limiting generalizability
correlation
a measure that two variables change together, and how well either variable predicts the other
correlation coefficient
a statistical measure of how closely two things vary together, and thus how well either one predicts the other
scatterplot
dots graphed represent two variables (slope = direction of the relationship between two variables)
correlation & causation
correlation shows a relationship but does not show cause (like if one variable causes another or if they are both caused by something else)
third variable problem
when a correlation between two variables (X and Y) isn't a direct cause-and-effect but is actually influenced by an unmeasured, external variable (Z) that affects both X and Y
illusory correlation
when you think there is a correlation but there isn’t one; explains superstitions
regression towards the mean
the statistical tendency for extreme scores (very high or very low) on an initial test or measurement to be followed by scores that are closer to the average (mean) upon retesting, due to the influence of chance
experiment
type of research where you manipulate variables to discover their effects
experimental group
group that receives treatment
control group
group that doesn’t receive treatment
random assignment
minimizes pre-existing differences by randomly assigning participants to experimental or control groups
single blind procedure
an experimental technique where participants are unaware of whether they are assigned to the experimental group or the control group, while the researchers know
double-blind procedure
a research method where neither the participants nor the researchers/staff know who's in the experimental group (getting the treatment) and who's in the control group (getting the placebo), preventing both participant bias (expectations) and experimenter bias (unintentional influence) from affecting results, ensuring more objective data, especially in drug trials
placebo effect
shows how effective a drug really is because one might think they are experiencing the effects of something because they assume they will
independent variable
variable whose effect is being studied
confounding variables
an outside, unmeasured factor in a study that influences both the independent variable (cause) and the dependent variable (effect)
dependent variable
variable being studied
validity
how well a study measured what it aimed to measure
descriptive statistics
numerical data used to measure and describe characteristics of groups; includes measures of central (main) tendencies and measures of variation
frequency distribution
a summary table or graph (like a histogram or polygon) organizing data points to show how often specific scores or ranges of scores occur
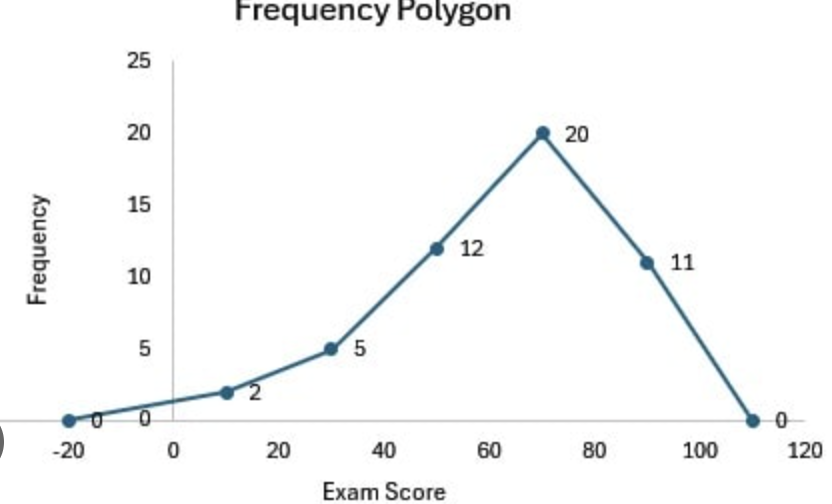
frequency polygon
a line graph used to represent frequency distributions, created by plotting points at the midpoint of each class interval and connecting them with straight lines
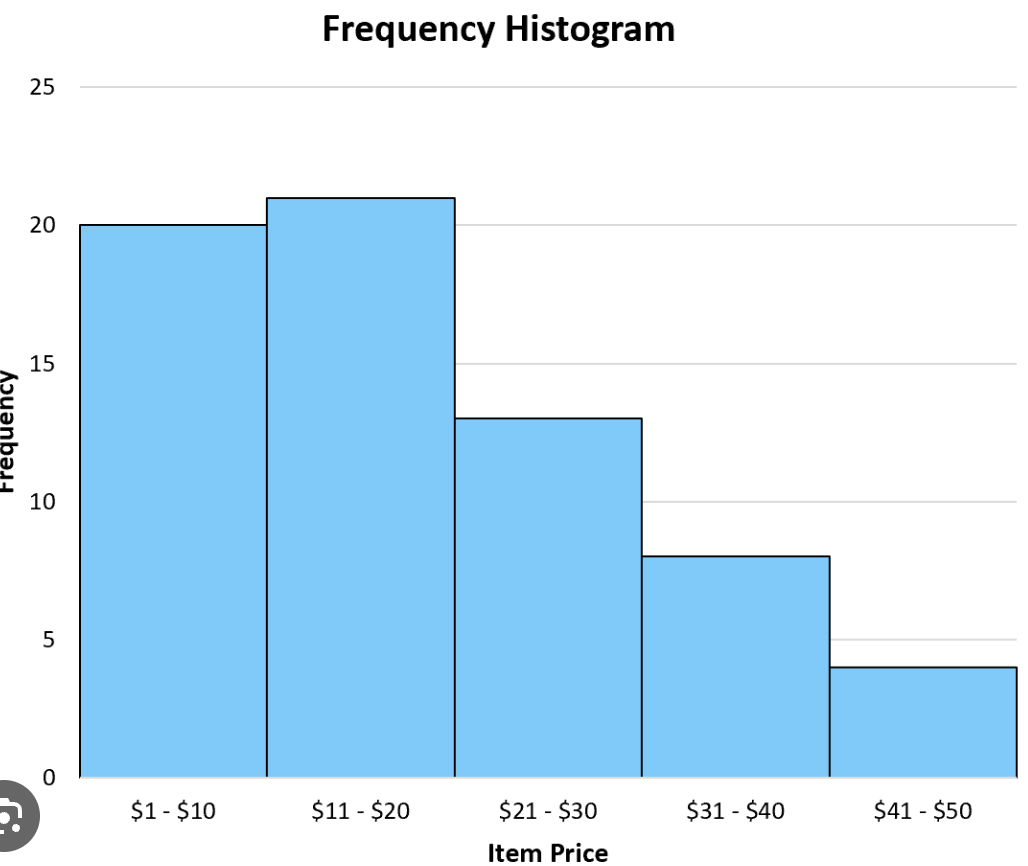
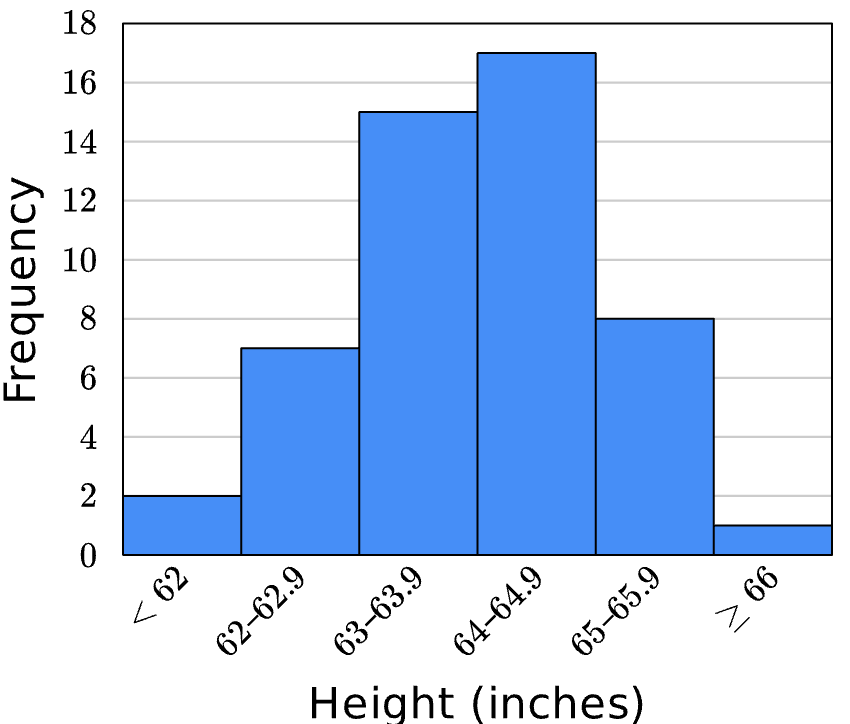
histogram
bar graph depicting a frequency distribution
likert scales
a common survey tool measuring attitudes or opinions by asking respondents to rate agreement with statements (e.g., "Strongly Agree" to "Strongly Disagree") or frequency (e.g., "Always" to "Never") on a symmetric, numerical scale, quantifying subjective feelings for easier data analysis in research like survey research
measure of central tendency
descriptive statistics that identify the center or typical score in a dataset: mean (average), median (middle score), and mode (most frequent score)
mean
average value
median
middle/central value
mode
most frequently occuring value
positive skew
more scores are lower, with a few very high outliers (ex. a test where most students score low, but a few score really high)
negative skew
more scores are higher, with a few very low outliers (ex. a test where most students score high, but a few score really low)
measures of variation
describe the spread or dispersion of data points in a distribution, indicating how clustered or scattered scores are around the mean; range, variance, and standard deviation
range
difference between highest and lowest scores; only gives a crude estimate of variation
percentile rank
shows the percentage of test-takers who scored the same or lower than you on the exam, with higher percentages indicating better performance
standard deviation
computed measure of how much scores vary around the average; large numbers of data in a standard deviation graph (not income though) often form a bell curve
normal curve
bell curve that describes the distribution of many types of data; most scores fall near the mean (about 68% within one standard deviation of it) and fewer and fewer near the extremes
inferential statistics
numerical data that allow one to generalize
meta-analysis
a statistical research method where a psychologist combines and analyzes results from many individual studies on the same topic (like therapy effectiveness or choice overload) to find overall patterns
statistical significance
a statistical statement of how likely it is that an obtained result occurred by chance; when sample averages are reliable, and when the difference between them is relatively large, we say it has statistical significance, meaning the observed difference is likely not due to chance variation between samples
p-value
value that shows a study’s results’ statistical significance; must be less than 0.05 or 5%
N
the total number of subjects, participants, or observations in a study or population
effect size
measures the magnitude or strength of a relationship between variables, indicating the practical significance or real-world impact of research findings
protection from harm
an ethical guideline for research that ensures research protect participants from physical or emotional harm and discomfort
confidentiality
an ethical guideline for research that ensures researchers keep information about individual participants confidential
debriefing
an ethical guideline for research that ensures researchers fully debrief participants on the details of the study
institutional review board (IRB)
an ethics committee that screens research proposals and safeguards participants’ well-being