7-Terrain Analysis
1/34
There's no tags or description
Looks like no tags are added yet.
Name | Mastery | Learn | Test | Matching | Spaced | Call with Kai |
|---|
No analytics yet
Send a link to your students to track their progress
35 Terms
What is terrain analysis?
complexity: spheroid < geoid < land surface (terrain)
using topographic data to derive terrain features. The morphology of terrain surface. Influence of terrain on environmental processes.
Contours, spot heights, DEM (raster) and TIN (vector)
Different ways of representing the same continuous surface at the same scale and extent.
What are the main digital terrain data sources?
ground surveys
photogrammetry
radar altimetry
interferometric synthetic aperture radar InSAR
airborne laser scanning LiDAR
most of these are in the form of, or can be readily transformed to DEM
What are the applications for terrain analysis?
Terrain analysis is about how the shape of the land influences or reflects natural processes, hazards, ecosystems, and human influences.
Mapping drainage networks - identifying channels, flow paths, and watershed boundaries for river management
Flood modelling - locating floodplains, flow bottlenecks, and overtopping points.
Erosion risk assessment - to predict where soil loss is likely
Wetland and groundwater recharge mapping - identifying depressions, low-slope zones, and convergent flow areas
geomorphological mapping of ridges, valleys, terraces, and scarps and dunes
shape parameters of volcanic landforms (subglacial edifies on Mars)
Mapping glacial features e.g. drumlims, morains, and meltwater channels
What is TIN (vector)?
Triangulated irregular networks
TIN using contiguous, non-overlapping triangles linking 3 adjacent elevation points.
Independent of data scale = flexible in level of detail
efficient in terms of data storage
TIN less useful than DEM when surface is flat (e.g. plateau, derserts)
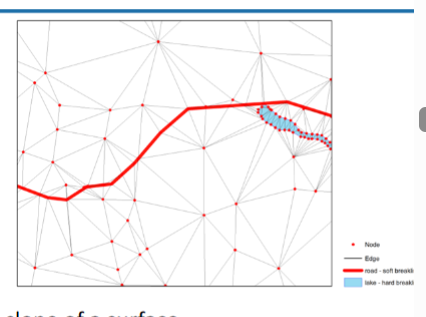
What is a breakline?
A breakline is a line feature with elevation values that forces the TIN surface to follow a specific shape. They prevent the interpolation from smoothing over important terrain edges.
Hard breakline - a discontinuity in slope of a surface
Soft breakline - does not change local slope of terrain surface
Hard breaklines keep water inside channels; soft breaklines guides the flow along the deepest parts of channels.
Hard breaklines preserve scarps; soft breaklines maintain natural curvature.
What are the primary terrain attributes?
elevation, slope, aspect, plan and profile curvature are primary terrain attributes
flow direction, flow accumulation, flow length, flow order, drainage network and catchment area are derived (hydrological) characteristics of a terrain surface
In GIS, they are mainly derived from DEM or TIN and represented in raster layers.
What are secondary terrain attributes?
secondary attributes are computed from two or more primary attributes
quantify the role played by topography in redistributing water in the landscape and in modifying the amount of solar radiation received at the surface
these attributes affect soil characteristics, distribution and abundance of soil water, susceptibility of landscapes to erosion by water, and the distribution and abundance of flora and fauna.
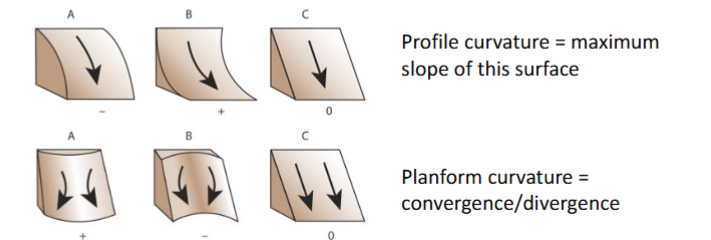
What is surface curvature?
amount by which a surface deviates from being flat
profile curvature is the rate of change of slope in the direction of the maximum slope
plan curvature is the curvature perpendicular to the direction of the maximum slope
Profile curvature affects the flow acceleration and erosion/deposition rate, and plan curvature affects the convergence and divergence of flow.
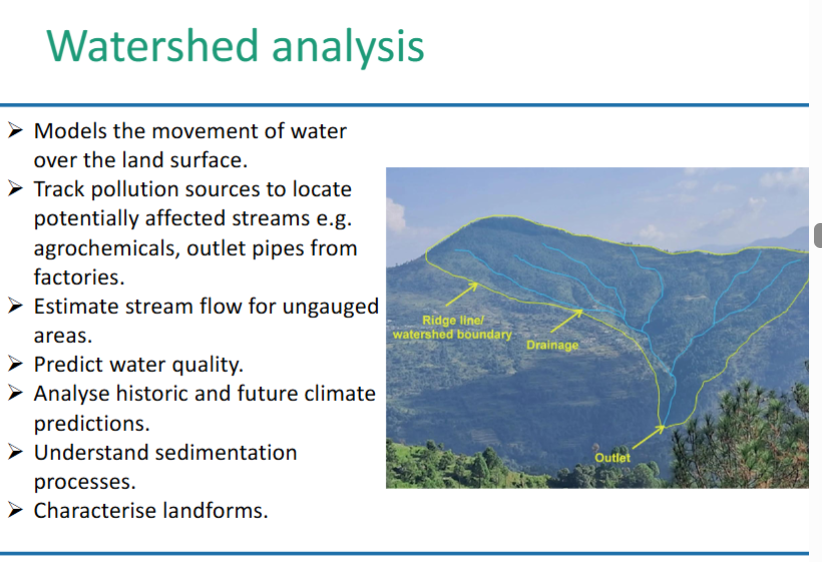
Example watershed analysis:
What is hydrologically correct DEM?
checking the DEM for sinks (hydrological conditioning)
areas which are pits, surrounded by higher elevation values
whilst these can occur naturally, often they result from errors in the input DEM
bridges, roads, quarries, sinkholes or misrepresentation of narrow-sides channels can all result in sinks
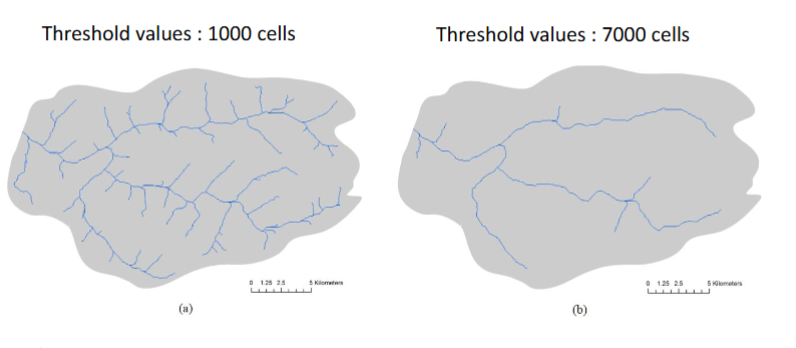
What are threshold values?
Threshold values are numerical cut-offs used to decide where surface runoff becomes a stream. Thresholds convert continuous flow accumulation into discrete drainage network.
In visibility analysis: what is line of sight?
Line of sight - draws a line between the observer point and the target point to indicate the visibility (visible or obstructed) along the line between the given points.
What is viewshed?
Shows the visibility (visible or obstructed) of an area from a specified viewpoint.
What is solar radiation mapping?
estimate spatial and temporal distribution of solar radiation on the Earth’s surface
solar radiation is radiant energy emitted by the sun
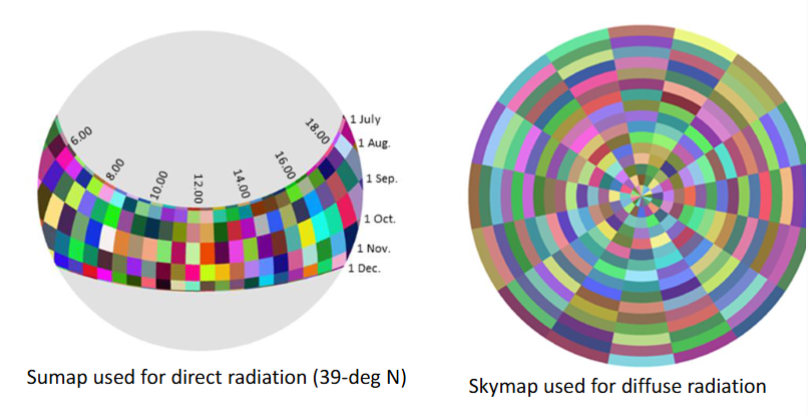
direct radiation propagates unimpeded in a direct line from the Sun to the receiving surface
diffuse radiation is scattered by clouds and dust
reflected radiation is the direct and diffuse radiation reflected by nearby terrain towards the location of interest
total or global solar radiation is the sum of direct, diffuse, and reflected radiation
What is a hemispherical viewshed?
upward-looking hemispherical viewshed model (DTM)
maximum angle of sky obstruction in all directions
used in combination with sunmaps and skymaps
calculate solar radiation for each location
Quiz: Slope is measured either in degrees or percentage. 45 degree is equivalent to what percentage?
100%
Slope % = tan (angle)*100
= tan(45)*100
To answer the question ‘how can an aesthetically unpleasant building be optimally hidden in the terrain in order to preserve the beauty of a landscape?’, which of the following analysis types is best to use?
Viewshed
A viewshed answers the question ‘from how many places can this object be seen, and where is visibility lowest?’. The latter location is what is needed for optimal hiding. The goal is to find locations where the building will be visible from as few viewpoints as possible, ideally none.
Sinks in a DEM are NOT caused by…
Natural depressions on terrain surface.
Sinks in a DEM are not caused by natural depressions. They are almost always the result of human made barriers, artefacts or processing errors.
Sinks in DEM are caused by sampling effects, rounding of elevations to integer numbers, spatial variations in the DEM.
In environmental monitoring, which situation best demonstrates an effective use of viewshed analysis?
Determining which areas of a forest can be visually monitored from a fire-water tower.
Viewshed analysis is used to optimise the placement of fire-watch towers, ensuring maximum visibility of potential ignition points and improving early-warning capacity. It can also be used to dentify blind spots.
Which factor primarily determines the amount of diffuse solar radiation received at a location in a GIS based solar radiation model?
The atmospheric scattering conditions and the sky-view factor.
Diffuse radiation depends on how much of the sky hemisphere is visible (sky-view factor) and on atmospheric scattering, which redistributes incoming light. Diffuse radiation is especially important in shaded or north-facing slopes where direct radiation is limited, making it a key component in micro-climate and habitat modelling.
Which of the following is not well represented using TIN?
Deserts.
TINs are best for complex, rugged terrain - but poor for flat, uniform landscapes (e.g. floodplains, agricultural plains, large flat deserts)
In order to answer the question ‘can a tower in the terrain be seen from a given viewpoint?’, which of the following GIS operations is the best?
Line of sight analysis.
Viewing from one specific location to another can be assessed using line of sight. This evaluates the visibility across a DEM, determining which cells are visible from a specified observer location. IT accounts for terrain elevation, intervening hills, ridges, and depressions, and can incorporate tower height or observer height if needed.
Which of the following correctly distinguishes primary from secondary terrain attributes in GIS?
Primary attributes are derived directly from elevation data, while secondary attributes combine multiple primary attributes to describe landform characteristics.
Which factor has the greatest influence on spatial variation in incoming solar radiation when using a DEM based solar radiation model in GIS?
Terrain parameters such as slope, aspect, and topographic shading.
Slope, aspect, horizon angles, and terrain shadows strongly control how much direct and diffuse radiation reaches each location.
DEM uses …. that represents terrain as …. surfaces, while TIN uses …. to represent the surface, resulting in a more …. appearance.
DEM - grid of cells, continuous
TIN - discrete triangles, angular
In geological mapping, which scenario best illustrates an appropriate use of viewshed analysis in GIS?
Identifying which parts of a fault scarp are visible from a proposed field observation point.
Viewshed analysis is used to model line‑of‑sight visibility, making it valuable for planning field work to observe structural features such as fault scarps, bedding orientations, or volcanic vents.
A hydrologically correct DEM is…
A DEM void of depression or sinks.
A hydrologically correct DEM ensures that every cell has a valid downslope flow path to an outlet. This means the DEM has been processed so that artificial pits and sinks are removed or filled. Often it also mean checking that man-made barriers (e.g., roads, railways, embankments) are lowered. This ensures that flow paths follow realistic topography and watersheds, channels, and ridges can be derived without errors.
If a plateau is eroded by gullies, the remaining plateau would be a flat (planar) area bounded by an irregular, many-sided polygon. In the TIN model:
It would be represented by a number of triangles, each at the same elevation.
It would still be a flat, many‑sided area — but in a TIN it cannot remain a single planar polygon. A TIN has no true “flat surfaces”; it represents every area, even a perfectly level plateau, as a series of contiguous triangles.
On a flow accumulation raster layer, locations having high accumulation values correspond to…
Stream channels.
High values correspond to valleys, channels, and stream pathways, because cells with a high flow‑accumulation value receive runoff from many upslope cells. These are the points where water converges and begins to form drainage lines.
The flow direction tool in GIS calculates the direction water will flow:
Out from each cell.
The flow direction tool determines the immediate direction of runoff from each cell. This is the path water takes across the surface before accumulating into channels. It does not simulate water depth, velocity, infiltration, or time, only the direction of steepest descent.
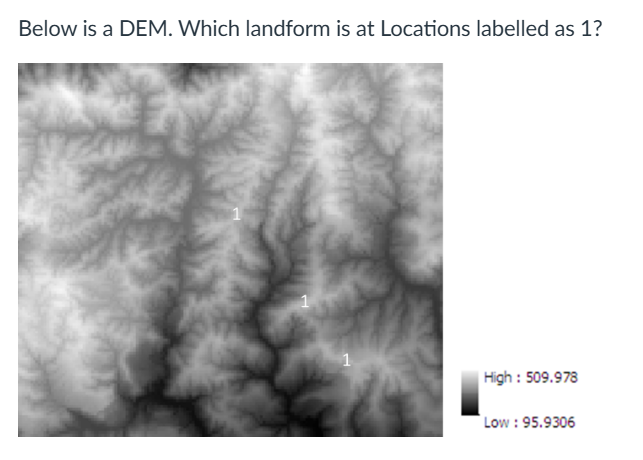
Ridges
Ridges appear as narrow, elongated high points (light = high elevation) relative to surrounding terrain with the ridge crest being typically the brightest part of the feature.
Which factor most strongly influences the accuracy of slope and aspect calculations derived from a DEM?
The spatial resolution of the DEM.
Higher resolution generally improves the derived accuracy but has the adverse effect of increasing the noise sensitivity.
Which terrain derivative is most useful for identifying convex and concave landforms such as crests and hollows?
Curvature
Curvature captures changes in slope direction and is key for geomorphic interpretation.
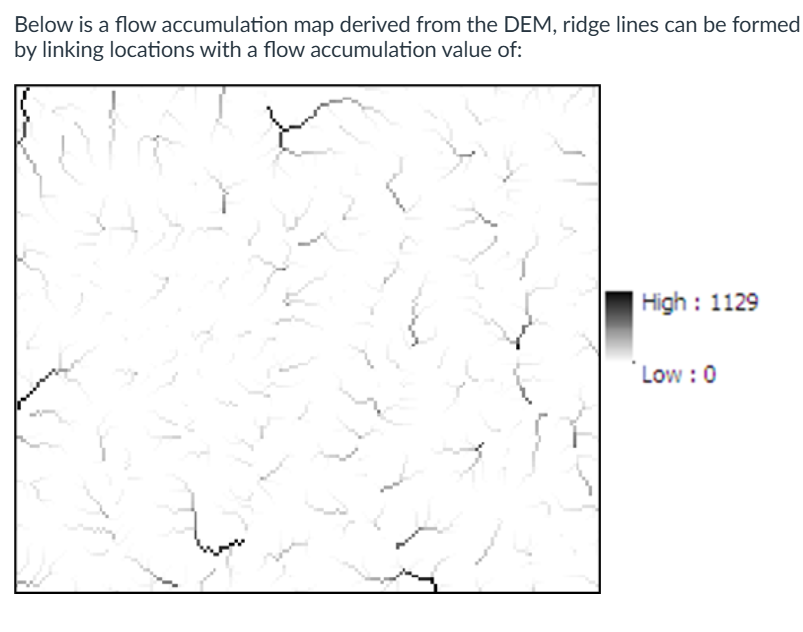
A ridge line corresponds to locations where no upslope area drains into the cell, so in a flow‑accumulation raster they are formed by linking cells with a flow accumulation value of 0 (or the minimum possible value in that dataset). This produces a continuous network of zero‑accumulation cells tracing the crest lines
TIN is more efficient than DEM at representing a surface?
True:
Actually it is not completely true that TIN is always more efficient then DEM. It depends on the terrain surface, a TIN is more efficient when the terrain is irregular, because it stores points only where detail is needed, however a DEM is more efficient when the terrain is smooth or uniform, because it uses a simple, fixed grid.