ECONOMICS UNIT 3AOS2 - domestic macroeconomic goals
1/106
There's no tags or description
Looks like no tags are added yet.
Name | Mastery | Learn | Test | Matching | Spaced | Call with Kai |
|---|
No analytics yet
Send a link to your students to track their progress
107 Terms
KK1: the difference between material and non-material living standards and factors that may affect living standards, including access to goods and services, environmental quality, physical and mental health, crime rates and literacy rates
Define living standards
the aggregate welfare of people in a country, made up of both material factors (such as access to goods and services) and non material factors (such as quality of life)
define material living standards
the ability of individuals to access goods and services.
define non-material living standards
the intangible quality-of-life factors that affect an individual's wellbeing and happiness but cannot be measured in dollar terms.
mls
in a market-oriented economy, this is heavily influenced by households purchasing power
access to goods and services can be altered by government intervention, which increases access for some but reduces for others
those who believe that increases in the consumption of goods and services leads to a more enjoyable and fulfilling life, therefore increasing mls.
nmls
inherent assumption in most economic models that wellbeing is improved if utility (satisfaction or wellbeing) and profits are maximised.
even with the existence of diminishing marginal utility (each additional unit of good or service that is consumed and generates less utility then the previous one), the assumption is that ‘more is better’.
the production of more goods and services is likely to boost real incomes and therefore purchasing power over time.
in reality, a persons quality of life is multi-faceted, and economists are increasingly working with experts in other professions to try and understand the factors, other than access to goods and services that might lead to higher quality of life.
a study of nmls will look at a wider range of the factors other than purchasing power that affect a person’s wellbeing/quality of life.
the factors that affect nmls are looked at in terms of the hard to measure concepts like happiness and satisfaction
increasingly, policy makers are paying more attention to broader quality of life indicators, beyond real gdp per capita, to guide policy making, such as HDI, GPI, ETC.
factors affecing ls
Access to goods and services
environmental quality
physical and mental health,
crime rates and literacy rates
access to goods and services (factors affecting ls)
GDP measures total production, but must use real GDP to remove price effects
↑ real GDP → more goods/services → ↑ income, spending, economic growth
Real GDP per capita = average access to goods/services per person
↑ real GDP per capita → ↑ average purchasing power
Limitations:
Doesn’t show income distribution (inequality)
Counts demerit goods (e.g. cigarettes) → may overstate living standards
Ignores negative externalities (harm to health/environment)
More consumption ≠ more wellbeing (hedonic treadmill/affluenza)
Excludes non-market activity (home production, black market, charity)
Overall:
Useful indicator, but incomplete → must consider distribution + type of goods/services
environmental quality (factors affecting ls)
Environment provides resources + supports all economic activity
Includes resource availability (renewable, non-renewable, common access)
Negative externalities (pollution, climate change) reduce living standards
Impacts:
Resource depletion → ↑ costs, ↓ future production + purchasing power
Pollution → harms ecosystems, health, and productivity
Climate change → ↓ future economic growth
Non-material:
Natural environments ↑ wellbeing
Pollution ↓ quality of life + enjoyment
Overall:
Crucial but hard to measure → affects both current + future living standards
physical and mental health (factors affecting ls)
Health affects productivity, income, and access to goods/services
Healthy population → ↑ work, innovation, economic growth
Poor health → ↓ workforce participation + reliance on government support
Impacts:
↑ healthcare spending → possible ↑ taxes → ↓ disposable income
Illness reduces ability to enjoy life (NMLS)
Mental health:
Isolation, stress ↓ wellbeing
Events like COVID-19 highlight importance
Overall:
Strong link between health, productivity, and quality of life
life expectancy (factors affecting ls)
Average years a person is expected to live
Used in United Nations HDI measure
Impacts:
↑ life expectancy → ↑ income earning potential
Ageing population → ↑ pensions + healthcare costs
Challenges:
Budget pressure → ↑ taxes or borrowing
Risk of age-related diseases (e.g. Alzheimer’s disease)
Non-material:
Longer life → more experiences, but not always better quality
Overall:
Improves living standards but creates economic pressures
crime rates (factors affecting ls)
Crime ↑ business costs (security, insurance, losses)
Costs passed on → ↑ prices → ↓ purchasing power
Impacts:
↓ material living standards
Victims suffer physical + emotional harm
↑ fear, anxiety, reduced safety
Government response:
More security → less freedom/privacy
Exception:
Some economic activity increases (e.g. replacing stolen goods)
Overall:
Mostly negative for both material + non-material living standards
literacy rates (factors affecting ls)
% of people who can read/write (age 15+)
Impacts:
↑ literacy → ↑ employment + income → ↑ access to goods/services
Low literacy → ↓ job opportunities → ↓ living standards
Macro effects:
Skilled workforce → ↑ productivity + global competitiveness
↑ GDP per capita
Non-material:
Improves communication, wellbeing, personal development
Enables participation in society + democracy
Overall:
Key driver of both economic growth and quality of life
KK2: the five-sector circular flow model of income, including the role of households, businesses, government, financial institutions and the external sector in an open contemporary macroeconomy
Five sector flow diagram
define the 5 sector flow model
a model that shows the flow of money, resources and goods and services in an economy.
about the 5 sector flow
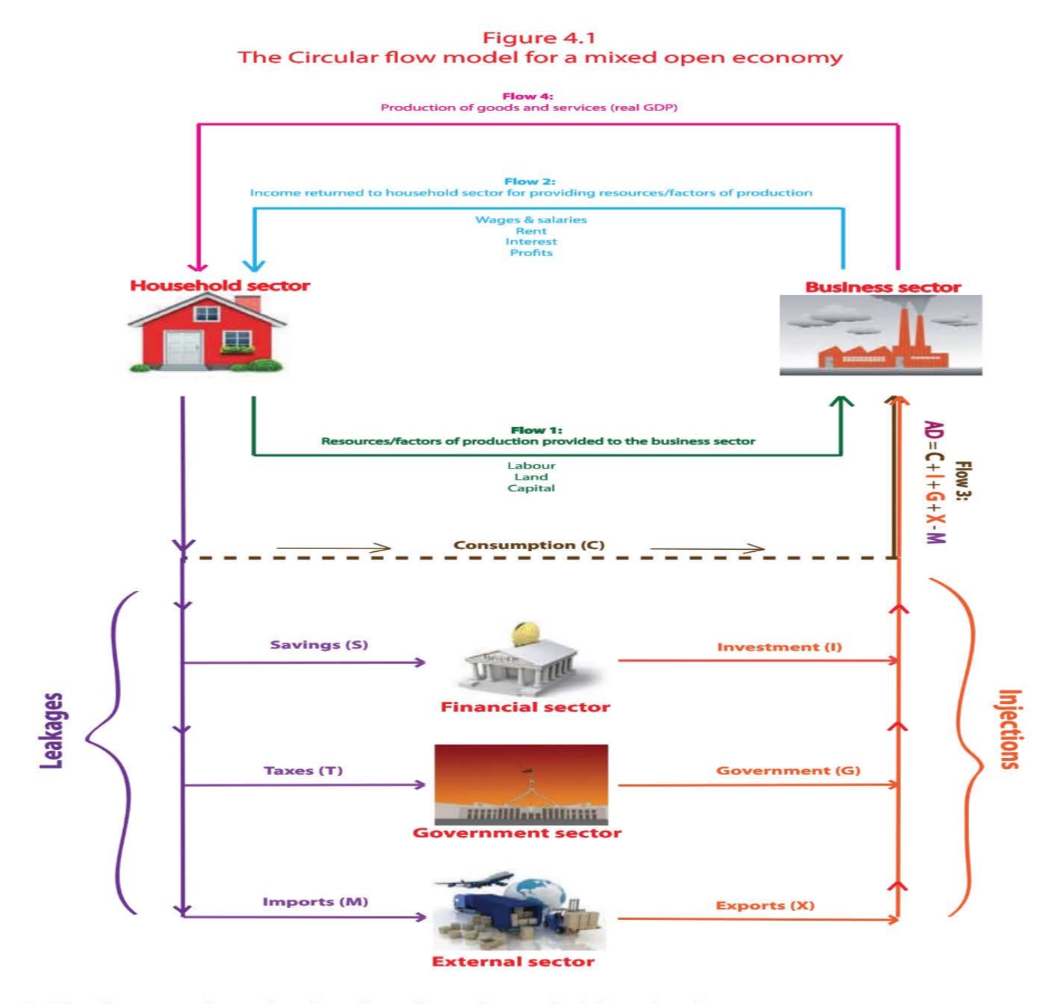
the five sector circular flow model is a model that shows the flow of money, resources and goods and services in an economy.
At the core of any circular flow model is the interaction between households and businesses in product and factor markets. These economic agents are the key decision makers in the economy and their actions have the most significant effect on the amount of income that is generated and that flows throughout the economy.
The model shows that there are four separate flows between households and businesses (which are continuous flows so it doesn't matter where the flow begins).
Two of the flows move from the households to the businesses while the other two movements are in the other direction. For each flow there is a corresponding movement of income - hence the name of the model.
FLOW 1: The factors of production flow from households to businesses
the three factors of production: Members of the households (i.e. the Household Sector in the model) provide natural resources, labour and capital to businesses.
People are obviously free to provide their labour to firms but households also own the other factors of production (in a market capitalist system, where resources are owned by private individuals) and these are provided as inputs in the production process.
Firms see these as part of their cost of production but their purchase is a necessity if businesses are to produce the goods and services to the market.
FLOW 2: The businesses pay income to those who provide the factors of production
The market capitalist economic system rewards those who provide firms with the factors of production. This becomes the income for households and may take the following forms: • From the provision of labour, households may receive wages, salaries, commissions, royalties etc. • From the provision of land the households may receive rent. • From the provision of capital the household may receive dividends, interest and profits.
This section of the circular flow model therefore highlights a wide range of incomes that are received in exchange for factors of production
FLOW 3: Demand for goods and services
Part of the income received by households in Flow 2 is then 'consumed' via the purchase of goods and services (i.e. Consumption), which forms part of Flow 3. However, part of the income earned by households does not immediately result in demand for Australian goods and services (i.e. Aggregate Demand) because the income is diverted through the Financial, Government and External sectors in the three ways described below.
The funds that are diverted away from Consumption are referred to as leakages in the model and are represented by the downward purple arrow on the left hand side.
An increase in leakages will tend to reduce the level of economic activity
what are the leakages (flow 3)?
savings S
Taxes T
Imports M
what are the injections (flow 3)?
investment I
government G
Exports X
define leakage
Income leaving the circular flow (reduces spending) → savings, taxes, imports
define injection
Income entering the circular flow (increases spending) → investment, government spending, exports
Savings (S)
It is unlikely that consumers will spend all of their income on goods and services in the market. In our model of the economy, it is assumed that savings will be redirected through the Financial Sector of the economy.
Households will make deposits with financial institutions such as banks.
When households do not spend their income but rather save it, the income is effectively removed from the core of the economy and will not boost Aggregate Demand (AD) until the funds are eventually injected back into the economy via Investment (injections).
Taxes (T)
Australia is considered a mixed economy because, although the market is the primary mechanism by which resources are allocated, the government intervenes in markets and alters not only the allocation of resources but also the total level of economic activity.
Households in Australia do not get to keep all of the income that they earn. They must legally pay part of it in taxes to the government Sector. They also pay tax when they purchase goods and services that have an indirect tax imposed upon them (e.g. the GST). Taxes are also seen as a leakage because they represent a reduction in the capacity of households and businesses to purchase goods and services.
imports (M)
Australia is also considered an open economy. This means that trade takes place between Australia and other countries. Spending on imports by Australians (the purchase by Australians of foreign made goods and services) is considered a leakage from the core of the economy. The spending effectively leaves the country through the External Sector and helps to boost economic activity in another nation.
The impact of these leakages on AD and economic activity will ultimately be offset by injections. These are instances where there is an increase in funds flowing back into the core of the economy. In the model, they are represented by the upward orange arrow on the right hand side. These injections result in an increase in the level of economic activity.
investment (I)
The funds that are saved become available to the firms in the Financial Sector. Firms are able to borrow money (or issue equity) to finance the purchase of new capital or land for example.
This spending is seen as Investment, as the productive capacity of the firm increases. This is an injection because the money flows back into the core economy because the purchase of machinery, for example, creates income for the manufacturer of the machinery.
government (G)
The government will eventually use the tax revenue it receives from the private sector. The funds are injected back into the economy through a number of Government spending initiatives.
The funds may be redistributed back to some households as transfer payments (thereby contributing to more activity in the core economy) or used to purchase goods and services that could be provided by the private (business) sector (which then helps to generate additional incomes for households).
exports (X)
In contrast to the leakage of the model in the form of imports, the income earned from the sale of exports (Australian made products that are purchased by foreigners) become an injection. While the income is generated from the spending of consumers overseas, it is injected into the Australian economy and therefore becomes another important component of AD.
Overall, the total demand for goods and services (Flow 3) is made up of Consumption demand, in addition to value of the injections that come through the Financial Sector (i.e. Investment demand), the Government Sector (i.e. Government demand) and the External Sector (i.e. Export demand). However, within this demand is a portion of spending on foreign goods and services (i.e. the leakage 'imports') that must be deducted in order to arrive at an accurate value for the demand placed on Australia's business sector.
FLOW 4: Production of goods and services (real GDP)
Total demand on Australia’s Business sector is AD (Aggregate Demand, Flow 3)
AD determines the total real value of production (real GDP, Flow 4)
The circular flow model is illustrative and helps understand influences on AD and economic activity
If Households increase Savings, AD growth may fall unless Businesses increase Investment
Low business confidence can prevent Investment even if interest rates fall
Government increasing Taxes without increased spending (budget surpluses) reduces AD
Lower international competitiveness reduces AD as imports rise and exports fall
When leakages exceed injections, economic growth slows
When injections exceed leakages, growth rises but may cause inflation
Example: COVID-19 stimulus increased government expenditure → injections > leakages → AD and real GDP grew
Government aims for optimal production, employment, and price growth
Policy tools adjust leakages and injections to manage the economy
The circular flow model helps understand how these policies affect AD and real GDP
define consumtion
the final purchase and use of goods and services by individuals and households to satisfy needs and wants
define resources
the essential inputs used to create goods and services
define land
natural resources used in production, including space, minerals, water, and forests, rather than just soil
defind labour
mental and physical effort exerted by humans in the production process.
define capital
Resources which have been made by combining labour and natural resources to create a more sophisticated input in the production process (e.g. machinery)
define gross domestic product (gdp)
The final market value of all goods and services produced in the Australian economy over a given period of time. It is the same as the total 'value added' during each stage of the production process and is calculated every quarter by the ABS.
define income
Money that is typically received on a regular or recurring basis (e.g. wages and salaries, investment returns, profit shares, royalties, or government pensions or allowances).
define households
places where unpaid production activities are carried out to satisfy the needs of the household members.
define businesses
An entity that provides a good or service for sales with the objective of making a profit.
define government
An organisation made up of people who represent the interests of society (or constituents) and govern a region (e.g. has responsibility for making and enforcing laws as well as the management of the economy).
define financial
the part of the economy that channels savings from households into Investment for businesses and government, acting as an intermediary in the 5-sector circular flow model.
define external
represents the part of the economy that interacts with foreign markets, including exports and imports, and influences AD through international trade in the 5-sector circular flow model.
define human development index (HDI)
A composite statistic, that measures performance in three key dimensions of development -economics, health and longevity, and education, and provides a superior measure of development to GDP or GDP per capita
KK3: the business cycle and its causes
the business cycle diagram
define the business cycle
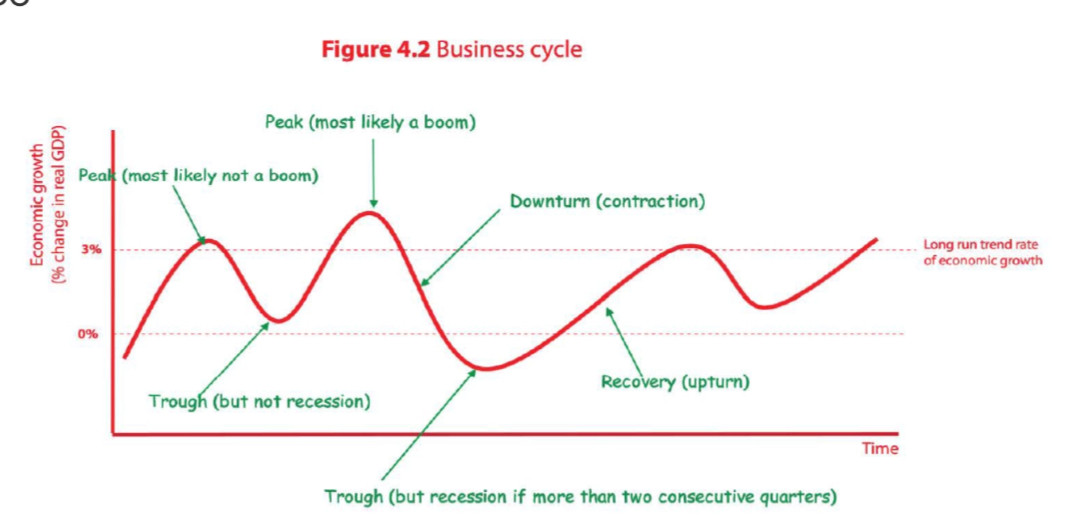
the pattern of fluctuations in economic activity over time, consisting of periods of expansion (growth) and contraction (slowdown or negative growth) in output and economic growth.
about the business cycle
Over time, economic activity and economic growth fluctuate
These fluctuations follow a cyclical movement called the business cycle (or trade/economic cycle)
The cycle includes peaks, troughs, recoveries, and downturns
Booms are periods of very high growth, but not all peaks are booms
Troughs are periods of very low growth, but not all troughs are recessions
A technical recession is defined as two successive quarters of negative growth
Business cycles show patterns of expansion (positive growth) and contraction (slower or negative growth)
No two business cycles are identical, and the length of each phase varies
Australia had long positive growth from 1991–2019 before the COVID-19 technical recession in 2020
stage 1: peak/boom
During a peak, the economy experiences strong economic growth
Consumer and business confidence is high, increasing spending and reducing savings
Firms expand production, raising the derived demand for labour
In the circular flow model, leakages fall relative to injections, boosting economic activity
If the peak is a boom, growth becomes excessive and unsustainable
Inflationary pressures rise as AD exceeds productive capacity
Product shortages lead businesses to increase prices of goods and services
Labour demand rises, wages increase, adding to inflation
Prices of other assets, like interest rates, shares, and property, also increase
Booms are generally not sustainable and the economy moves to the next business cyc
stage 2: contraction or downturn
During a boom, high inflation and capacity constraints make increasing production difficult
High interest rates and asset bubbles create overvalued assets (shares, property)
Market corrections reduce private consumption and Investment as households save and deleverage
In the circular flow model, injections fall relative to leakages, slowing economic activity
Economic growth slows, some resources become unemployed
Confidence deteriorates and inflation falls to sustainable levels
stage 3: trough/recession
A trough is the minimum point of economic activity in the business cycle
A technical recession is defined as two consecutive quarters of negative economic growth
Australia experienced a technical recession in 2020 due to an economic shock (COVID-19 pandemic), not a normal business cycle downturn
A prolonged recession is called a depression, which Australia hasn’t experienced since the 1930s
Low or negative growth means firms require fewer factors of production and unemployment rises
In the circular flow model, leakages exceed injections, reducing economic activity
Official unemployment in 2020 rose from ~5% to ~8%, but the effective rate, including hidden unemployed, approached 15%
Recessions/troughs are accompanied by disinflation or deflation
Excess supply in product, labour, and financial markets reduces prices, wages, and interest rates
During the 2020 recession, excess capacity caused deflation in the June quart
stage 4: recovery/expansion
During a trough or recession, low inflation (or deflation), lower labour costs, and lower interest rates can trigger economic recovery
Consumption, Investment, and Net Exports increase, boosting production, employment, income, and expenditure
In the circular flow model, injections rise relative to leakages, increasing economic activity
Economies tend to be self-correcting over time, but adjustment can be slow
Governments use macroeconomic demand management policies to support demand during troughs or constrain growth during peaks
During 2020–21, government policies prevented a more severe and prolonged economic decline
Booms usually involve high production, high inflation, and low unemployment; recessions involve weak production, low inflation, and high unemployment
Stagflation occurs when there is low growth, high unemployment, and high inflation
Australia experienced stagflation between 1973–1983 (unemployment 10.2%, inflation 11.6% p.a.)
Global supply shocks since 2022 (e.g., Ukraine war, COVID-19 disruptions) risk stagflation, raising production costs and inflation
Policy responses will determine if Australia faces slow growth with excessive inflation over 2022–23
KK4: The meaning and importance of aggregate demand and the factors that may affect the level of aggregate demand in the economy, including disposable income, interest rates, consumer confidence, business confidence, the exchange rate and rates of economic growth overseas
define aggregate demand
The total expenditure on new final Australian made-goods and services
what does ad influence?
the level of economic activity because it provides the incentives for firms to increase production levels, thereby requiring the increased use of factors of production and generating income growth in the country.
about AD
The focus is on final goods and services because there will be many transactions that take place in the economy that involve intermediate products (goods that are used to make other goods and services).
If the intermediate products were to be included in our calculation of AD, then the same goods and services would be counted twice.
For example, if a new car is purchased, the final amount paid represents all of the value added. If the tyres were also included (the car manufacturer will have purchased these from another supplier), then this item would be counted twice, giving an inaccurate picture of total economic activity or production.
We also emphasise that the goods being sold are new so that we don't include the value of goods that have been included in previous calculations of AD and GDP (when they were first purchased). The sale of second-hand goods can contribute something to AD (such as the 'service' provider by the seller) but they generally do not involve new production.
Changes in AD strongly influence the phases of the business cycle
After the Great Depression, economists focused on aggregate demand theories and the government’s role in stabilising economic activity
John Maynard Keynes argued that fluctuations in AD are the main cause of changes in economic activity
Low AD is linked to higher unemployment, while rapid increases in AD can cause excessive inflation
Keynes suggested AD could remain low for long periods, causing significant economic suffering
Understanding AD requires examining its key components reported by the ABS to identify strong or weak growth in different sectors
AD equation
AD = C + I + G + X - M
C = private consumption expenditure
the total value of all expenditures on individual and collective consumption goods incurred by resident households and non-profit institutions serving households.
The outlays covered include: • Expenditure on consumer durables such as cars, furniture and high-value, long-lasting household appliances (but excluding dwellings, which are regarded as the fixed assets of an 'industry') • Consumer semi-durables such as clothing and footwear • Single-use goods such as food, cigarettes and tobacco, and alcoholic drinks • Services of all kinds such as hairdressing, dry cleaning and public transport
Consumption expenditure usually comprises approximately 60% of AD in Australia.
I = private investment expenditure
the purchase of new equipment and plant, buildings and vehicles. The purpose of investment expenditure is to expand the productive capacity and productivity of the business sector.
The addition to inventories over the accounting period also represents a form of investment.
The spending by households on new housing is included in this subsection.
Investment spending is usually undertaken with the purpose of generating additional goods and services in the future.
its volatile component of AD as businesses are continually changing their forecasts about future profitability. It comprises approximately 15% to 20% of AD.
G = government expenditure
G1:
is Government current (consumption) expenditure on goods and services that are not capital in nature. This includes collective goods and services for current use necessary to run the government.
Much of the spending goes towards the provision of government services such as health, education and defence. It also includes spending for government departments on stationery, salaries and rent. It is a relatively stable component of AD.
G2:
is Government Investment Expenditure on goods that are of a capital nature.
This includes spending on new buildings and infrastructure.
Spending in this area is deemed to be important, like private Investment, because it adds to the productive capacity of the economy.
Infrastructure spending on hospitals, schools, roads, ports and railways may help to reduce costs of production for private firms and may help to boost Australia's international competitiveness
X= exports
spending on exports
Exports are Australian-made goods and services that have been purchased by foreign households, businesses, governments and other organisations.
M = imports
is spending on imports.
Imports are foreign-made goods and services that have been purchased by Australian households, businesses, governments or other organisations.
'Net exports' is sometimes referred to as the Balance on Goods and Services (or the Balance of Trade) and exports and imports each comprise approximately 20% to 24% of AD.
They are both highly volatile components of AD and the factors influencing them will be discussed in Chapter 7.
factors that influence the level of ad
General price level = average price of goods/services (measures inflation)
↑ prices → ↓ purchasing power → ↓ spending → ↓ AD
↓ prices → ↑ purchasing power → ↑ spending → ↑ AD
↑ domestic prices → ↓ international competitiveness
↓ exports, ↑ imports → ↑ leakages, ↓ injections → ↓ AD
↓ prices → ↑ competitiveness → ↑ AD
Price changes → movement along AD curve
Non-price factors → shift AD curve
disposable income (factors affecting ad)
Disposable income = income households have to spend/save (income + transfers − tax)
↑ disposable income → ↑ spending → ↑ consumption → ↑ AD
↓ disposable income → ↓ spending → ↓ AD
Increases from:
Wage rises
Tax cuts
Dividends/capital gains
Government transfers
Example:
During the 2020 recession in Australia, the government boosted income through payments (e.g. JobSeeker) → ↑ consumption → ↑ AD
Overall:
Key driver of consumption and aggregate demand
interest rates (factors affecting AD)
Interest rates affect household consumption + business investment
When interest rates rise:
↓ discretionary income (higher loan repayments)
↓ spending on goods/services → ↓ AD
↓ borrowing (houses, cars)
↑ opportunity cost of spending (more saving)
Businesses: ↑ costs, ↓ profits → ↓ investment → ↓ AD
When interest rates fall:
↑ disposable income → ↑ spending
↑ borrowing + investment → ↑ AD
Role of policy:
Set via cash rate by Reserve Bank of Australia
↑ rates to reduce inflation (slow AD)
↓ rates to boost spending + employment (increase AD)
Overall:
Key tool influencing consumption, investment, and aggregate demand
consumer confidence (factors affecting AD)
Consumer confidence = level of optimism/pessimism about the economy
Measured by an index: 100 = average, >100 optimistic, <100 pessimistic
High confidence:
Expect ↑ income + employment
↓ saving, ↑ borrowing
↑ spending → ↑ AD
Low confidence:
↑ saving, ↓ spending
↓ marginal propensity to consume → ↓ AD
Influences:
Employment prospects
Media reports
Geopolitical events (e.g. Russian invasion of Ukraine)
Climate conditions
Changes in government/leadership
Overall:
Higher confidence → ↑ spending → ↑ aggregate demand
business confidence (factors affecting ad)
Business confidence = firms’ optimism/pessimism about the economy
High confidence:
↑ expected demand + profits
↑ investment (plant & equipment) → ↑ AD
Low confidence:
↓ investment due to uncertainty → ↓ AD
Influences:
Economic outlook
Expected demand
Production costs + input availability
Competition
Inflation expectations
Government policy/uncertainty
Key point:
Investment is the most volatile component of AD (sensitive to small changes)
Overall:
Higher business confidence → ↑ investment → ↑ aggregate demand
exchange rate (factors affecting ad)
Exchange rate = value of one currency against another
Example: AUD compared to USD
Measured by the Trade Weighted Index
When AUD depreciates (falls in value):
Exports become cheaper for overseas buyers → ↑ demand for Australian goods/services
Export revenue increases → ↑ injections → ↑ AD
Imports become more expensive → ↓ imports → ↓ leakages → ↑ AD
Domestic firms become more competitive vs imports
When AUD appreciates (rises in value):
Exports become more expensive → ↓ demand
Imports become cheaper → ↑ imports → ↑ leakages → ↓ AD
Overall:
Depreciation → ↑ net exports → ↑ aggregate demand
Appreciation → ↓ net exports → ↓ aggregate demand
Rates of economic growth in overseas economies - factors affecting AD
Economic growth = % increase in the production of goods and services over time
↑ economic growth → ↑ incomes + ↑ demand for inputs → ↑ spending → ↑ AD
International effects:
Strong growth in other countries → ↑ their incomes → ↑ demand for Australian exports
Benefits Australia through exports like coal, education, and tourism
Global demand increases → ↑ injections → ↑ AD
Example:
Growth in countries like China increases demand for Australian resources and services
COVID-19 impact:
Pandemic reduced global trade and travel → ↓ export demand → ↓ AD
Recovery:
Reopening borders restored trade + tourism links from 2022 onwards
Growth in major economies like India supports Australian exports and AD
Overall:
Global economic growth → ↑ exports → ↑ aggregate demand in Australia
KK5:the meaning and importance of aggregate supply and the factors that may affect the level of aggregate supply in the economy, including quantity and quality of the factors of production, costs of production, technological change, productivity growth, exchange rates and climatic conditions, and other events including government regulations and disruptions to international supply chains
define aggregate supply
represents the total volume of goods and services that all suppliers have produced and supplied over a period of time. It measures the economy’s ability to make available goods and services to meet demand.
about as
In a mixed economy, both firms and government produce goods and services
Total output is limited by the economy’s productive capacity (linked to the production possibility frontier)
Productive capacity:
When fully utilised, all factors of production are employed
Productivity is at maximum output level
Implications:
If the economy is at capacity, output cannot easily increase
AD may rise, but AS cannot keep up → risk of stalled growth or inflationary pressure
Role of government:
Manage AD and improve AS (through productivity and supply-side policies)
Aim to ensure rising demand is matched by rising production
Overall:
Long-term growth depends on expanding productive capacity so AS can meet AD increases
factors that may affect the level of aggregate supply in the economy
quantity and quality of the factors of production, costs of production, technological change, productivity growth, exchange rates and climatic conditions, and other events including government regulations and disruptions to international supply chains
the quanitity of factors of production (factors as)
Firms use resources as inputs to produce goods and services.
Natural resources are required for all production, either directly or indirectly.
The discovery of oil can increase supply by supporting mechanisation, fertilisers, pesticides, and access to overseas resources, while a drought reduces supply by limiting access to water.
Immigration increases the pool of skilled labour, helping address ageing populations and skills shortages, which can affect AS.
Investment in technology and capital equipment increases the availability of capital resources, boosting productive capacity and AS.
Government spending (G2) on infrastructure also enhances capital resources, facilitating economic expansion.
the qualitity of factors of production (factors as)
The ability of firms to maintain and increase supply depends not only on the volume of resources but also on the quality of those resources.
Unsustainable use of land (e.g., overuse of fertilisers/pesticides) can reduce long-term AS by degrading soil quality.
Labour quality is linked to education and health; a more skilled and healthier workforce increases productivity, encourages innovation, and supports the production of higher-value goods.
Capital quality affects capital productivity; better technology, faster broadband, and artificial intelligence can increase efficiency and expand the supply of goods and services previously unavailable.
the costs of production (factors of as)
Costs of production directly influence a firm’s ability and willingness to supply, and all factors affecting AS ultimately impact these costs.
Improvements in labour quality raise productivity, lowering average production costs, while better capital/equipment also increases capital productivity, reducing costs.
Falling oil prices lower production costs for industries using oil directly (e.g., transportation, plastics) and indirectly for industries relying on these inputs, increasing AS.
Slower wage growth reduces real unit labour costs, allowing firms to hire more workers and increase AS, while excessive wage claims raise costs and can reduce supply.
Falling technology prices (e.g., cheaper computers or Internet access) lower production costs, enhancing a firm’s ability to supply and increasing AS.
tech change (factors of as)
Technology is a key factor influencing the quality of resources, productivity growth, and costs of production, thereby affecting AS.
The rise of the digital economy (e.g., comparison websites for insurance) reduces the need for labour, lowers production costs, and increases the ability to supply.
Mechanisation of labour-intensive industries (e.g., farm machinery, energy extraction) allows firms to produce more with fewer workers, increasing AS.
Advanced mining technologies (driverless trucks/trains) reduce labour costs, cut accidents, and raise productivity, saving money and improving the firm’s ability to supply.
productivity growth (factors as)
Productivity measures output per unit of input and shows how efficiently resources are used to produce goods and services.
Labour productivity is total output (GDP) divided by total hours worked; alternative measures include capital productivity and multifactor productivity.
Productivity growth increases AS because more goods and services can be produced from the same or fewer inputs, raising productive capacity and lowering unit costs
exchange rates (factors of as)
Exchange rate affects cost of production → a key supply factor
Depreciation of AUD ↑ input costs → reduces ability to supply → lowers AS
Appreciation of AUD ↓ input costs → increases supply → raises AS
Depreciation boosts AD but reduces AS
AS = total goods and services all suppliers are willing and able to produce
government regulations (factors of as)
Government regulations affect business costs → influence willingness and capacity to supply
Types of regulations:
Environmental (e.g., pollution taxes/charges)
Worker protection (e.g., workplace safety laws)
Consumer protection (e.g., product safety laws)
Regulations generally ↑ cost of doing business → tighter regulations → ↓ AS
Climatic conditions and other disruptions ('supply shocks') to AS (factors of as)
Favourable weather → ↑ availability of resources, ↓ input costs → ↑ AS
Erratic/extreme weather (droughts, floods, storms, bushfires) → disrupts production → ↓ AS
Example: 2022 eastern Australia floods → ↓ agricultural supply
COVID-19 pandemic → supply shock:
Restricted inputs from China and other countries (supply chain disruptions)
Reduced labour supply due to lockdowns and social distancing
Many businesses unable to operate → ↓ AS and AD → recession
Human actions (war, destruction, negligence) → destroy infrastructure and restrict supply → ↓ AS
Example: War in Ukraine → global supply shock, reduced exports of grain, gas, oil due to trade sanctions and blockades
KK6: the meaning of the goal of strong and sustainable economic growth
goal #1 strong and sustainable economic growth
economic growth meaning: increase in national production over time.
Government aims for sustained/sustainable economic growth to avoid slow/negative growth (e.g., 2020 recession).
Sustainable growth considerations (upper limits to growth rate):
Avoid unacceptable inflation (RBA target: 2–3% over cycle)
Prevent excessive external pressures (current account deficit, net foreign debt)
Avoid overuse of natural resources → protect future generations
Goal: highest growth rate possible with strong employment, without inflation, external, or environmental problems.
Sustainable rate → ~3–3.5% per annum (RBA, Glenn Stevens 2008).
Growth above trend can use spare capacity but must slow to medium-term potential (~3%).
Variation over time:
Strong productivity growth → >4% may be sustainable
Slow productivity growth → <3% may still be sustainable if unemployment falls and skills shortages exist
International context matters → Australia’s <3% growth (2009–2020) was strong compared to advanced economies like Japan, USA, and Europe.
KK7: measurement of the rate of economic growth using growth in real Gross Domestic Product (GDP)
GDP / economic growth
GDP = total final market value of all goods and services produced in a country over a period
Measured by the Australian Bureau of Statistics each quarter
Includes value added at each stage of production
Types of GDP:
Nominal GDP = value of output at current prices (includes inflation)
Real GDP = adjusted for inflation (uses previous prices) → measures actual changes in output
Economic growth:
↑ real GDP → ↑ production → ↑ incomes → ↑ living standards
↓ real GDP → ↓ production → negative economic growth
Two consecutive quarters of negative growth = recession
Example:
In 2020, Australia experienced a major fall in real GDP (COVID-19 shock), leading to a recession
Overall:
Real GDP is the best measure of economic performance and material living standards
interpreting gdp statistics
The Australian Bureau of Statistics (ABS) releases quarterly real GDP (chain volume) data
Reported in $ terms, shown as original + seasonally adjusted
Adjusted from original data to better reflect true economic activity
Removes seasonal effects → clearer trends
Used by economists & media
December quarter → higher GDP (Christmas spending)
March quarter → lower GDP
Adjustment “smooths” data by removing regular seasonal rises/falls
Measuring Economic Growth (GDP reporting)
GDP figures are usually seasonally adjusted unless stated otherwise
Economic growth is reported in percentage change, not dollar values
Example: real GDP growth of 0.9% means output increased by 0.9% over the quarter
Calculating growth:
Quarterly growth = change in real GDP from one quarter to the next (seasonally adjusted)
This shows short-term changes in production volume
Annual growth (two methods):
Year-on-year growth = compare GDP to same quarter last year
Gives a more stable, longer-term view of economic performance
Annualised growth = quarterly growth × 4
Shows what full-year growth would be if the quarter continued
Key point:
Annualised and year-on-year growth often differ due to short-term fluctuations
Overall:
Growth is best measured in percentage terms of real GDP to understand changes in production and economic performance over time
KK8: consequences of not achieving the goal of strong and sustainable economic growth and its effect on living standards, including environmental degradation, external pressures, high inflation if growth is too high, and high unemployment if growth is too low
why is economic growth was pursued?
All governments pursue economic growth as it is the primary means by which nations can maintain and/or improve living standards over time.
economic growth and material ls
Growth in production usually increases incomes from wages, interest, and dividends, allowing people to buy more goods and services, improving material living standards.
economic growth and non-material ls
Higher incomes can also enhance non-material aspects of life, such as happiness, freedom, self-esteem, and the ability to contribute to others’ well-being, improving overall quality of life.
lowering the unemployment rate
Economic growth can boost employment by increasing the derived demand for labour when production grows faster than productivity. If growth absorbs labour force expansion, unemployment falls, improving both material and non-material living standards. Higher employment also spreads income gains more widely, further enhancing welfare.
INCREASED ABILITY OF GOVERNMENT TO PROVIDE ESSENTIAL SERVICES
Economic growth raises government tax revenue, enabling more spending on hospitals, schools, infrastructure, and welfare. This improves material living standards, supports disadvantaged groups, and helps address social issues like poverty, crime, and health inequalities.
whats our target growth rate?
APPROXIMATELY 3-3.50%
consequences if economic growth is too low
Australia aims for strong economic growth to exceed productivity growth and avoid “jobless growth.”
If growth is too low relative to productivity, employment falls and unemployment rises.
Weak growth (<3%) correlates with higher unemployment; strong growth (>3%) correlates with lower unemployment.
Economic growth must exceed population growth (~1.4% annually) to maintain or improve GDP per capita.
Real GDP per capita rose 10.6% from 2008–2019, showing improved material living standards.
Slow growth before the 2020 recession limited improvements in living standards
Real GDP per capita generally falls when quarterly economic growth is negative (e.g., 2008, 2011).
Some periods of positive economic growth (2009, 2015–2018) still saw falls in real GDP per capita due to population growth outpacing economic growth.
Overall, real GDP per capita increased between 2008 and 2019, despite occasional declines.
The COVID-19 pandemic caused a 7% drop in real GDP in June 2020, the largest quarterly fall in material living standards since the 1930s.
Economic recovery after 2020 raised real GDP per capita to $20,525, despite a dip in mid-2021.
CONSEQUENCES IF ECONOMIC GROWTH IS TOO HIGH
Excessive economic growth can harm the environment through resource depletion and pollution if not matched by technological or productivity improvements.
Growth beyond ~4% can worsen Australia’s balance of payments, increasing net foreign debt and future financial burdens.
Very strong growth can lead to high inflation if demand outstrips the economy’s capacity to supply goods and services.
Inflation above 3% is considered excessive in Australia and creates economic problems.
KK9: the meaning of the goal of full employment, including the NAIRU (natural rate of unemployment)
define employment
The provision of labour resources to the business, government and/or not for profit sectors.
define unemployment
the situation where individuals who are actively seeking work and available for employment are unable to find jobs THE RATE OF UNEMPLOYMENT IS CALCULATED BY: dividing the number of unemployed by the total labour force.
Employment & Labour Force Definitions
Households supply labour to businesses, government, and not-for-profit sectors in exchange for income
Employment is a key driver of economic activity, growth, and living standards
Employment (ABS definition):
Aged 15+
Works 1+ hour per week
Receives pay or measurable income (e.g. wages)
Unemployment (ABS definition):
Aged 15+
Not working or working <1 hour per week
Actively looking for work
Important notes:
Some people who think they are “employed” (e.g. volunteers seeking paid work) may be classified as unemployed
Some valuable contributors (e.g. carers, stay-at-home parents) are counted as not in the labour force
Overall:
Employment supports income generation, economic growth, and improved living standards, but official definitions may not capture all useful work