4.1.4 Production, costs and revenue
1/128
Earn XP
Description and Tags
Name | Mastery | Learn | Test | Matching | Spaced | Call with Kai |
|---|
No analytics yet
Send a link to your students to track their progress
129 Terms
what is production?
converts inputs, or the services of factors of production such as capital and labour, into final output
(or the total output of g + s produced by an individual, firm or country)
define productivity?
a measurement of the rate of production by one or FOPs
what is the formula for productivity?
total output per period of time / no. of units of FOP
what is labour productivity?
output per worker per period of time
what’s the formula for labour productivity?
total output per period of time / no. of units of labour
how do you improve labour productitvity?
more + better education and training
advances in technology
what is specialisation?
where an individual worker, firm, region or country produces a limited range of goods or services
(e.g. an individual firm specialising in in accountancy, e.g. PwC)
what’s the division of labour
breaking down a production process into smaller tasks, with each worker specialising in one
what’s the division of labour?
a type of specialisation where production is split into different tasks and specific people are allocated to each task
why do specialisation and division require an efficient exchange system?
specialists only produce one thing
they need exchange to get everything else they need
(e.g. a tax accountant exchange their services for payment, then uses that money to buy food and pay rent)
what is a barter?
the exchange of goods and services for other goods and services
what’s the key problem with barter?
it requires a double coincidence of wants - both parties must want exactly what the other offers
what’s an advantage of money over barter?
money is easily divisible unlike physical goods
what are the four functions of money?
medium of exchange - removes the need for barter acting as an accepted intermediary in transactions
measure of value - provides a common standard to value g + s
store of value - preserves purchasing power over time, allowing saving + future consumption
standard of deferred payment - money can be paid at a later date for something that’s consumed now (borrowing)
what are the advantages of specialisation?
higher productivity - workers + firms become more efficient by mastering specific task
increased output - more goods + services to be produced using the same resources
improved quality - increased skill + aptitude due to repetition
time efficiency - time wasted switching between tasks is reduced
what are the disadvantages of specialisation?
repetitive tasks - lead to boredom
countries become less self sufficient → problem if trade is disrupted
can lead to a lack of flexibility
what’s the difference between the short run and the long run?
short run - at least one factor of production is fixed (e.g. quantity of labour might be flexible, whilst quantity of capital is fixed)
long run - all factors of production can be varied
what are fixed costs?
costs of production that don’t vary with the level of output in the short run
(e.g. rents on business premises)
what are average fixed costs (AFC)?
total fixed costs / output
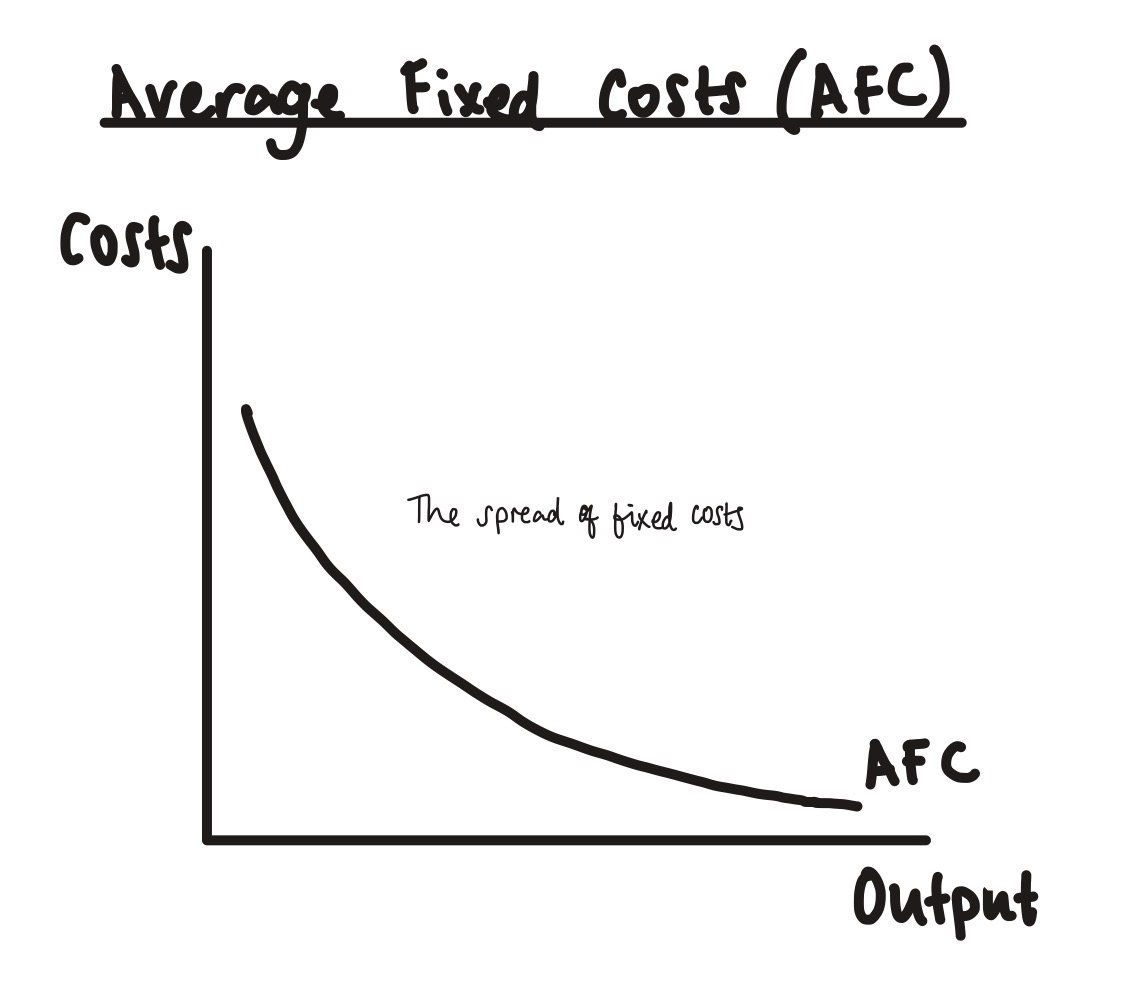
why does AFC fall as output increases?
the firm is able to spread the fixed costs over an increasing volume of output
(key incentive for firms to increase their output)
what are variable costs?
costs of production that vary with the level of output (e.g. raw materials)

what are average variable costs (AVC)?
total variable costs / output
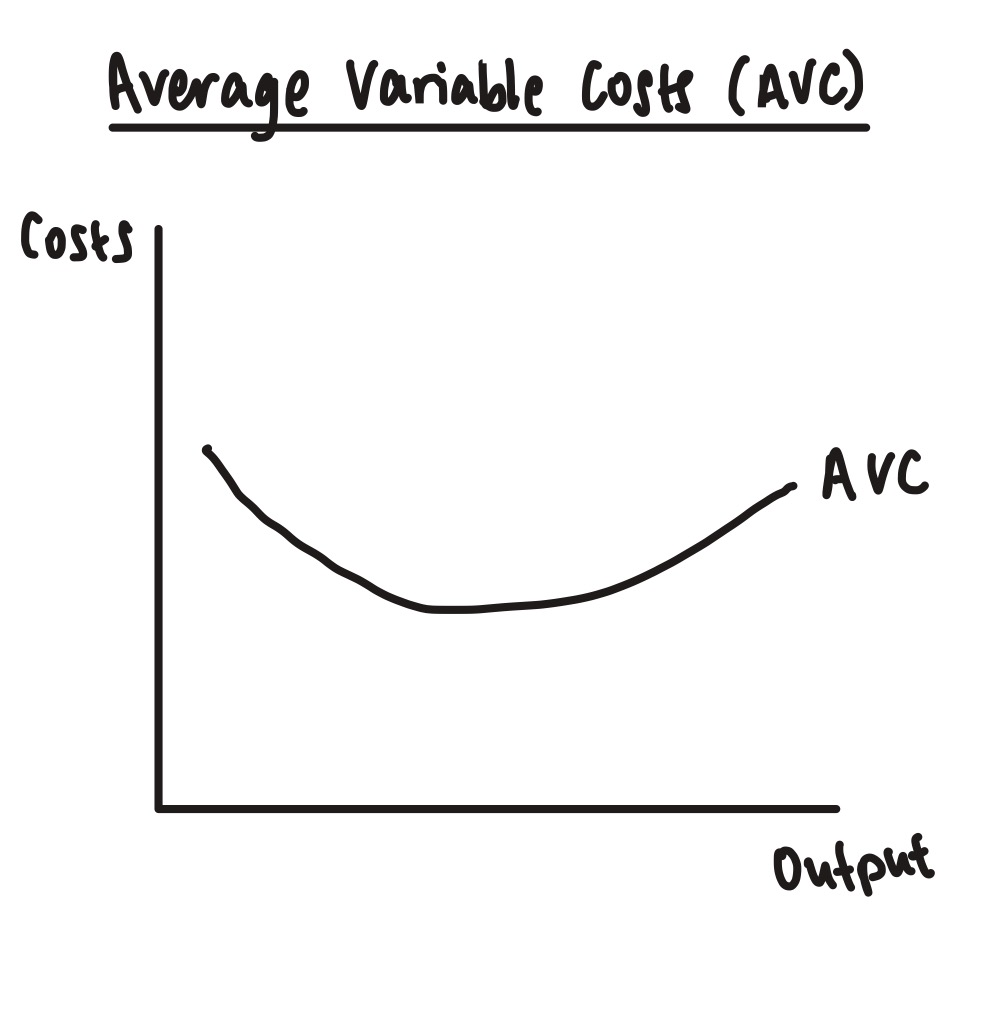
why is the AVC curve u-shaped?
at low output, adding variable inputs (e.g. workers) raises productivity
→ each unit costs less to produce → AVC falls
diminishing returns set in
→ each extra unit of output costs more to produce → AVC rises
what are total costs (TC)?
the total fixed costs (TFC) + the total variable costs (TVC) at a given level of output
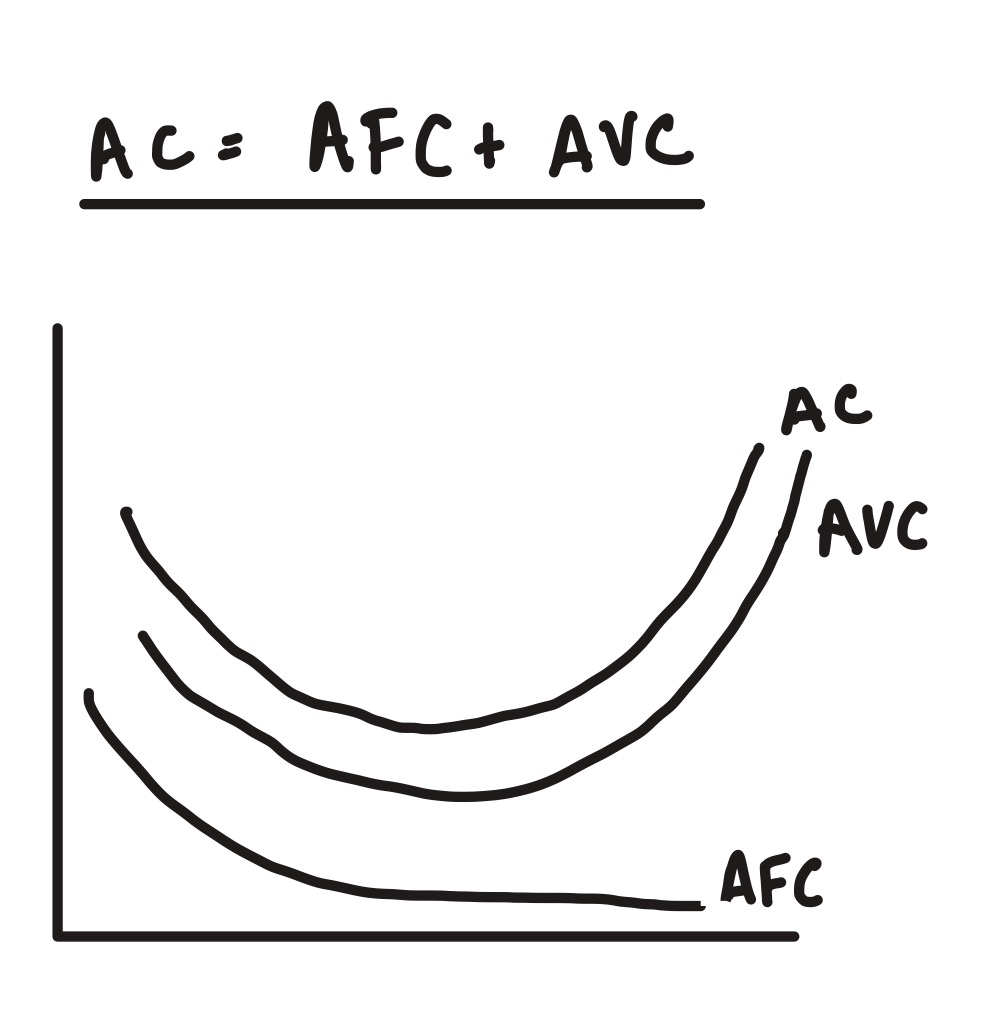
what is the average total cost (ATC)/average cost (AC)?
TC / output
or
AFC + AVC

what’s the marginal cost (MC)?
the addition to a firm’s total cost from making an additional unit of output

why is the MC curve always u-shaped?
law of diminishing returns
why does MC rise after it falls?
result of the law of diminishing returns
as the levels of factor inputs that are variable in the short run increases
→ firm is getting less additional output from each unit of input
→ cost per unit of that output will be greater

what happens to AC when MC is below it?
AC falls - when each extra unit costs less than the current average, it pulls the average down
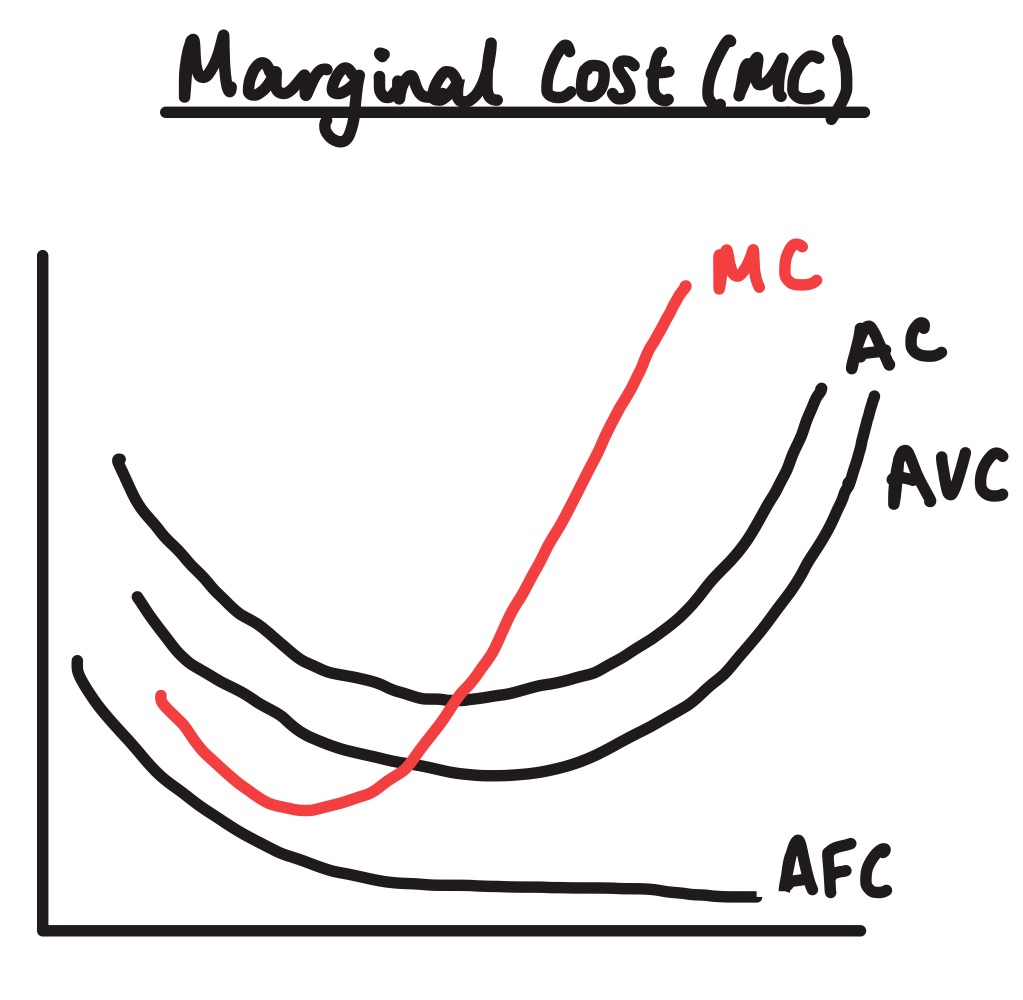
what happens to AC when MC is above it?
AC rises
when each extra unit costs more than the current average, it pushes the average up
(as long as MC > AC, AC is increasing)

at what point is AC at its lowest?
when MC = AC (MC curve crosses AC curve at its minimum point)
also the point of productive efficiency (firm is producing at the lowest possible cost per unit)

why does the MC curve also cross the AVC curve at the minimum?
marginal cost is made up of variable costs
MC curve raises and lowers AVC in the same way as AC
what is the law of diminishing returns?
if one variable factor is increased while all others stay fixed, eventually the marginal returns from the variable factor will begin to decrease
when does the law of diminishing returns apply, and why?
only in the short run because it requires at least one FOP to be fixed
in the long run, all factors can vary

what is marginal product (MP) / marginal returns?
the extra output produced by adding one more unit of a variable input, while all other inputs stay fixed

why does MP initially rise as more input is added?
more specialisation becomes possible
(e.g. as more workers are hired, they can each focus on specific tasks, boosting productivity)
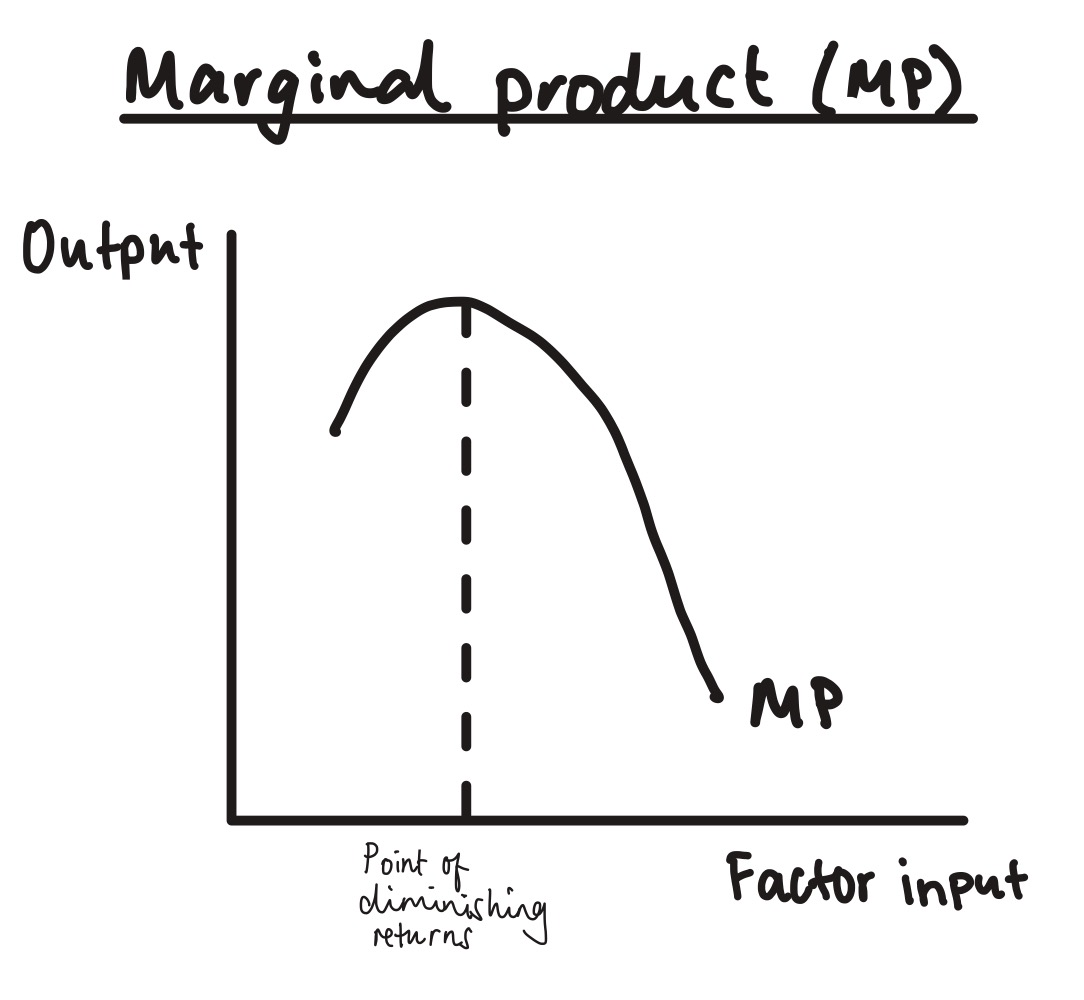
why does MP eventually fall
fixed factors become a bottleneck, output is limited
(e.g. with 5 sewing machines, 6th worker adds less output than 5th)
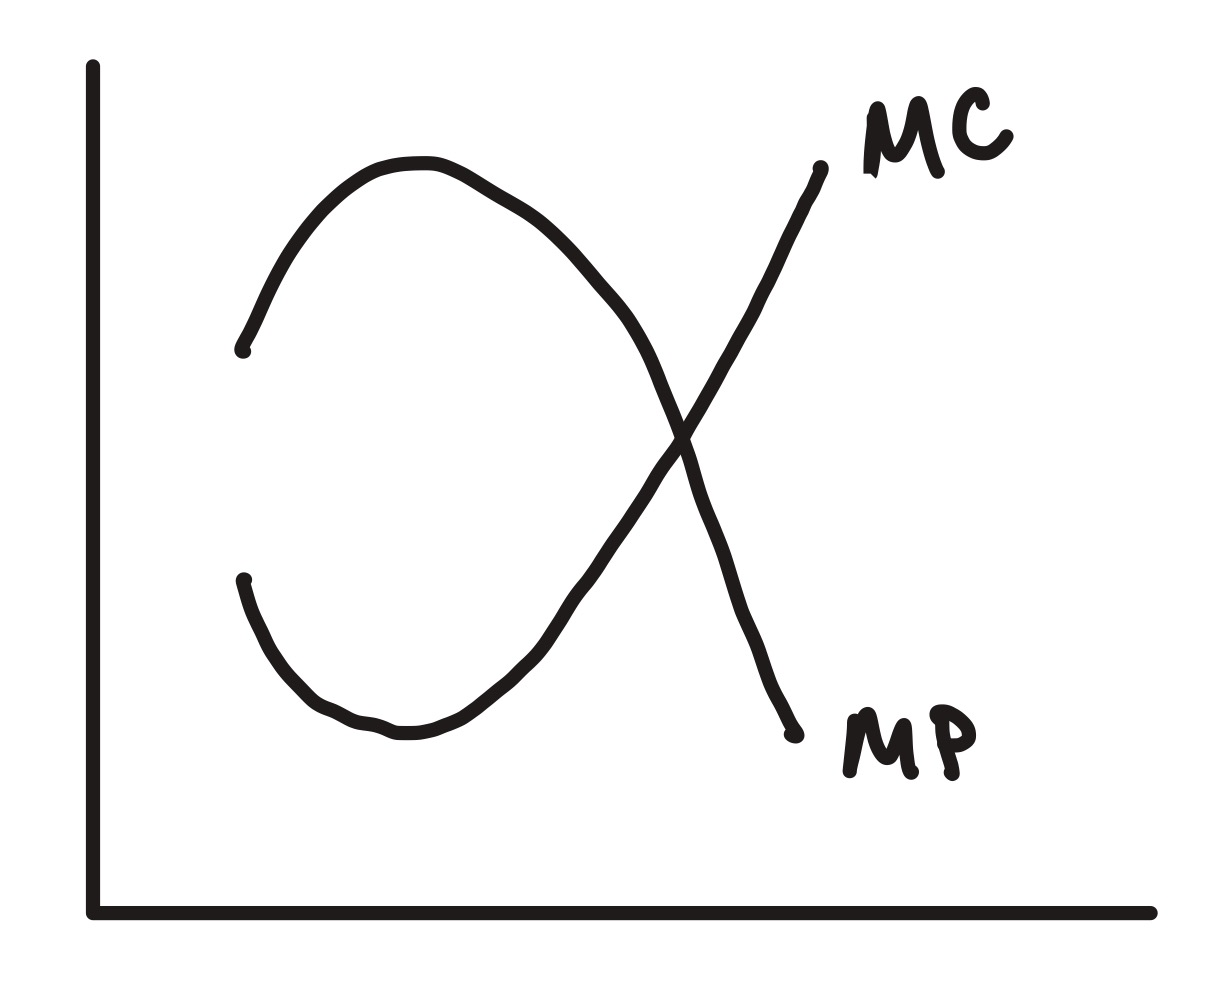
what is the relationship between MP and MC?
they move in opposite directions
when MP rises, MC falls (vice versa)
(mirror image of each other)

why does MC rise when MP falls?
you’re getting less extra output from each unit of input
→ the cost per unit of that output increases

what average product (AP)?
output per unit of factor input
(e.g. if variable factor = labour, AP = average output per worker)

what is the relationship between the MP and AP curves?
the MP curve crosses the AP curve at AP’s max point
once MP falls below AP, it pulls the average down → AP starts to fall
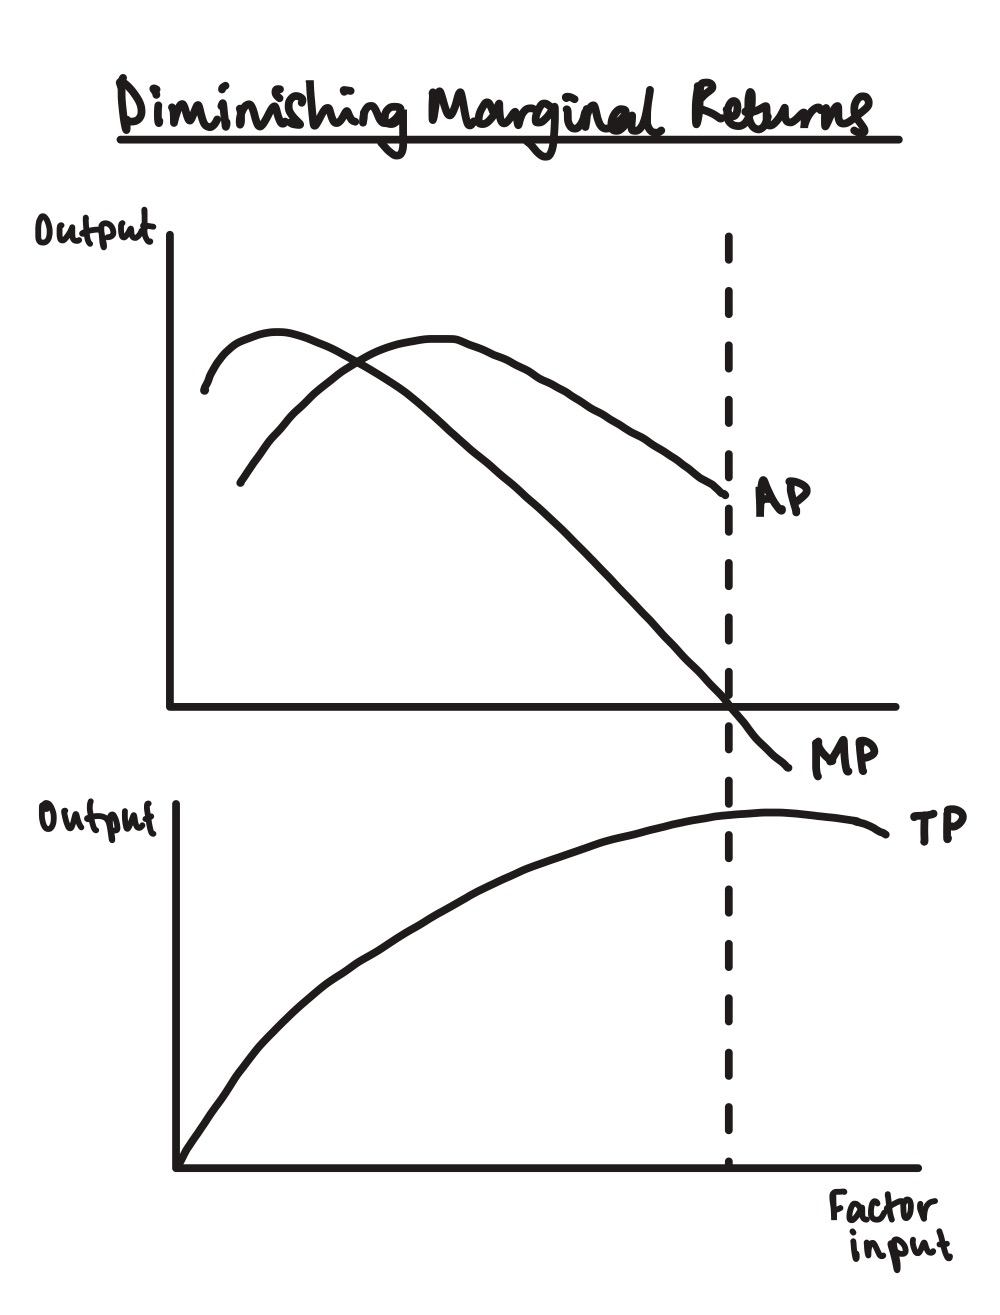
what is total product (TP)?
the total output produced using a particular combination of factor inputs?

what causes TP to fall?
when MP becomes negative - adding more of the variable factor reduces output (e.g. too many workers getting in each other’s wat)
what are economies of scale?
the reduced average total costs that firms experience by increasing output in the long run
what are the two types of economics of scale?
internal
external
what are internal economics of scale?
reductions in long-run average total costs arising from growth of the firm
what are the different types of internal economies of scale?
(Really Fun Mums Try Making Pies) + network
risk-bearing
financial
managerial
technical
marketing
purchasing
networks
what are risk-bearing economies of scale?
large firms diversify across products and markets
→ more predictable overall demand (if D for 1 product in 1 country falls, there’s likely to be a different product whose D somewhere increases)
firms more able to take risks
they can absorb the cost of a failed product more easily
what are financial economies of scale?
larger firms borrow at low interest rates because banks consider them less risky to lend to
what are managerial economies of scale?
large firms employ specialist managers for each area of the business
→ better decision making in those areas
reduces management costs (they don’t rise in proportion to output)
what are technical economies of scale?
large firms can afford to invest in more advanced and productive and capital, reducing average costs
what are marketing economies of scale?
larger firms can divide their marketing budgets across larger outputs, so the average cost of advertising per unit is less
what are purchasing economies of scale?
large firms buy inputs in bulk, giving them bargaining power to negotiate lower prices from suppliers
what are network economies of scale?
the more users a network has, the more valuable it becomes, attracting even more users
average costs fall as the network grows
(e.g. ebay)
what are external economies of scale?
reductions in long-run average total costs arising from growth of the industry in which a firm operates
what are diseconomies of scale?
increases in average total costs that firms may experience by increasing output in the long run
what are internal diseconomies of scale?
as a firm grows too large, average costs rise due to:
poor communication and low staff morale
managers losing control and coordination becoming harder
more wastage as resources seem plentiful
less cooperation + efficiency - workers may put department’s interests before the company’s
what are external diseconomies of scale?
as an industry grows too large, average costs rise due to:
higher raw material prices as demand increases
bulk-buying loses its advantage - local supplies run out, more expensive materials must be sourced from further away
how does a firm increase output in the short run?
by increasing variable factors of production
it moves along its existing short run average cost (SRAC) curve
what happens in the long run when a firm changes all its factors of production?
it moves onto a new SRAC curve
it’s no longer constrained by any fixed factors
what does the long run average cost curve show (LRAC)?
the minimum possible average cost at each level of output
what’s the relationship between SRAC curves and the LRAC curve?
SRAC curves can touch the LRAC curve but never go below it
the LRAC is always the lowest achievable average cost
when does a firm operate on its LRAC curve?
only when it’s using the most appropriate mix of all FOP for that level of output
why can a firm not always reduce costs to the LRAC level in the short run?
some factors are fixed, so the firm cannot adjust all inputs to their optimal levels
what determines the shape of the LRAC curve?
internal economies and diseconomies of scale
LRAC falls when economies of scale dominate and rise when diseconomies dominate
what happens to average cost when a firm experiences internal economies of scale?
it falls as output increases
what happens to average cost when a firm experiences internal diseconomies of scale?
it rises as output increases
can economies and diseconomies of scale occur at the same output level?
yes
whether costs rise of fall overall depends on which effect is greater at that level of output
what effect do external economies of scale have on the LRAC curve?
shift it downwards
average costs fall at all output levels
what effect to external diseconomies of scale have on the LRAC curve?
shift it upwards
average costs rise at all output levels
what can cause the LRAC curve to shift?
change in taxation
new technology
what is the L-shaped LRAC curve?
some economists argue that the LRAC is L-shaped
average costs fall sharply as output increases
→ then continue to fall or level off
why doesn’t the L-shaped curve turn upwards?
any internal diseconomies of scale are offset by continued cost reductions economies of scale
what are returns to scale?
the change in output when all inputs are increased proportionately (in the long run)
what are increasing returns to scale?
an increase in all factor inputs leads to a more than proportionate increase in output
what are constant returns to scale?
an increase in all factor inputs leads to a proportionately identical change in output
what are decreasing returns to scale?
an increase in all factor inputs leads to a less than proportional increase in output
what’s the difference between returns to scale and economies of scale?
returns to scale describe how output changes as all inputs increase
eos describe reductions in average cost as output increases
how do returns to scale link to economies of scale and diseconomies of scale
increasing returns to scale contribute to eos
decreasing returns to scale contribute to dis eos
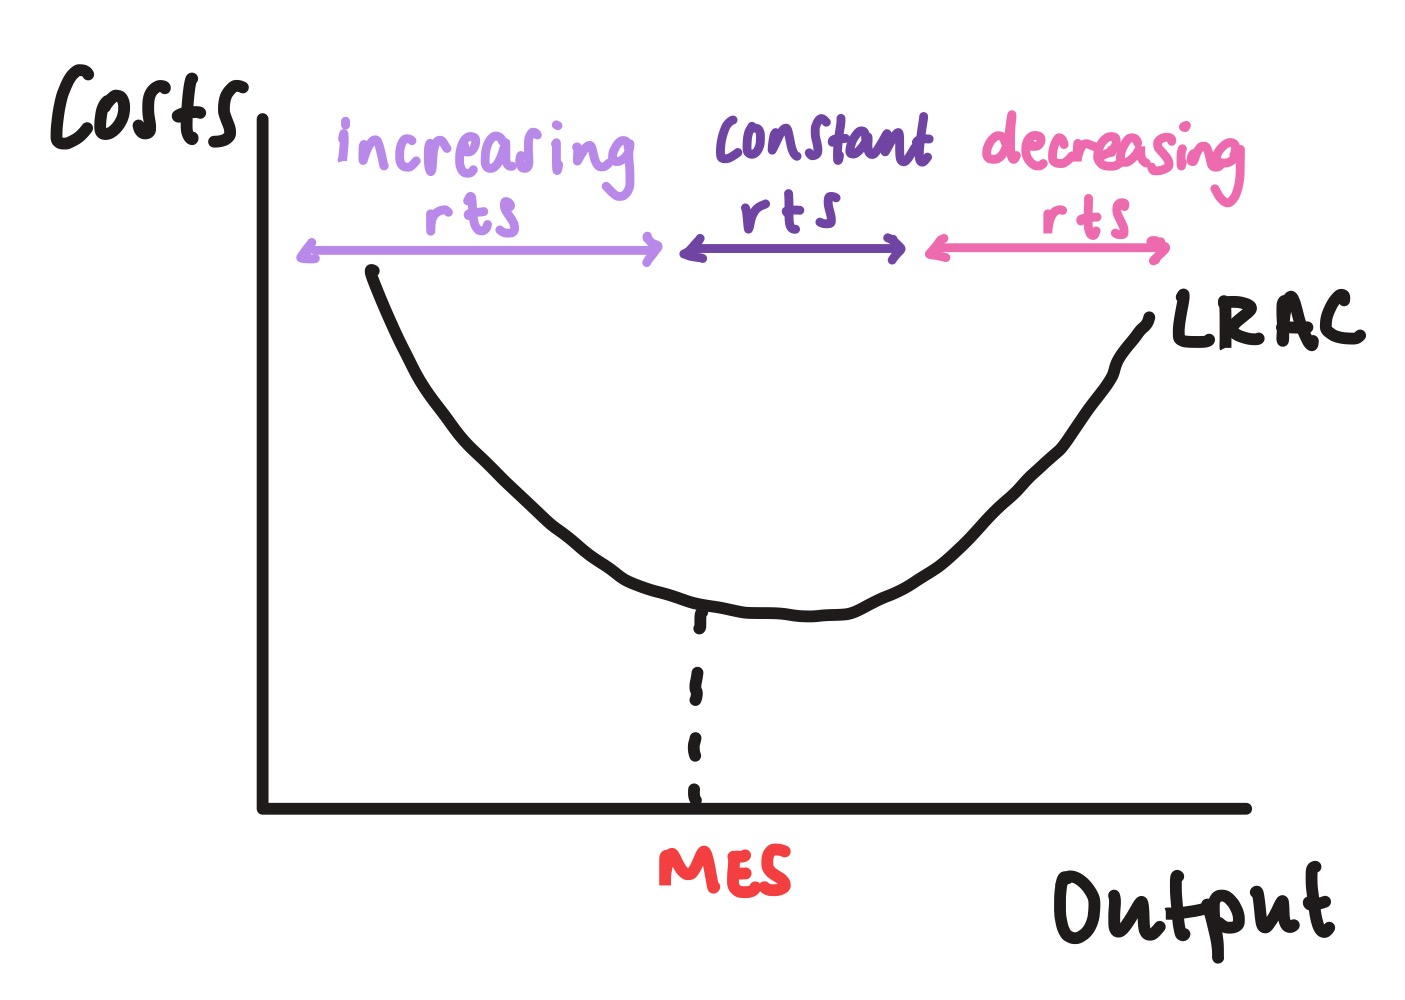
what happens to LRAC during increasing returns to scale?
LRAC falls
each unit of input produces more than a proportional increase in output so cost per unit decreases

what happens to LRAC during constant returns to scale?
LRAC stays the same
costs increase proportionally to output, so average cost is unchanged

what happens to LRAC during decreasing returns to scale?
LRAC rises
less output is being produced per unit of input, so average cost increases

what’s the minimum efficient scale (MES)?
the lowest level of output at which the minimum possible average cost is achieved
the first point at which the LRAC curve reaches its minimum (optimal level of production)
what’s the significance of the MES?
industries with a very high MES favour large firms
only large firms can produce at the minimum average cost
how can the MES act as a barrier to entry?
once existing firms achieve the MES, new entrants struggle to compete
→ they can’t yet produce at the same low average costs, putting them a significant cost disadvantage
(leading to dominance)
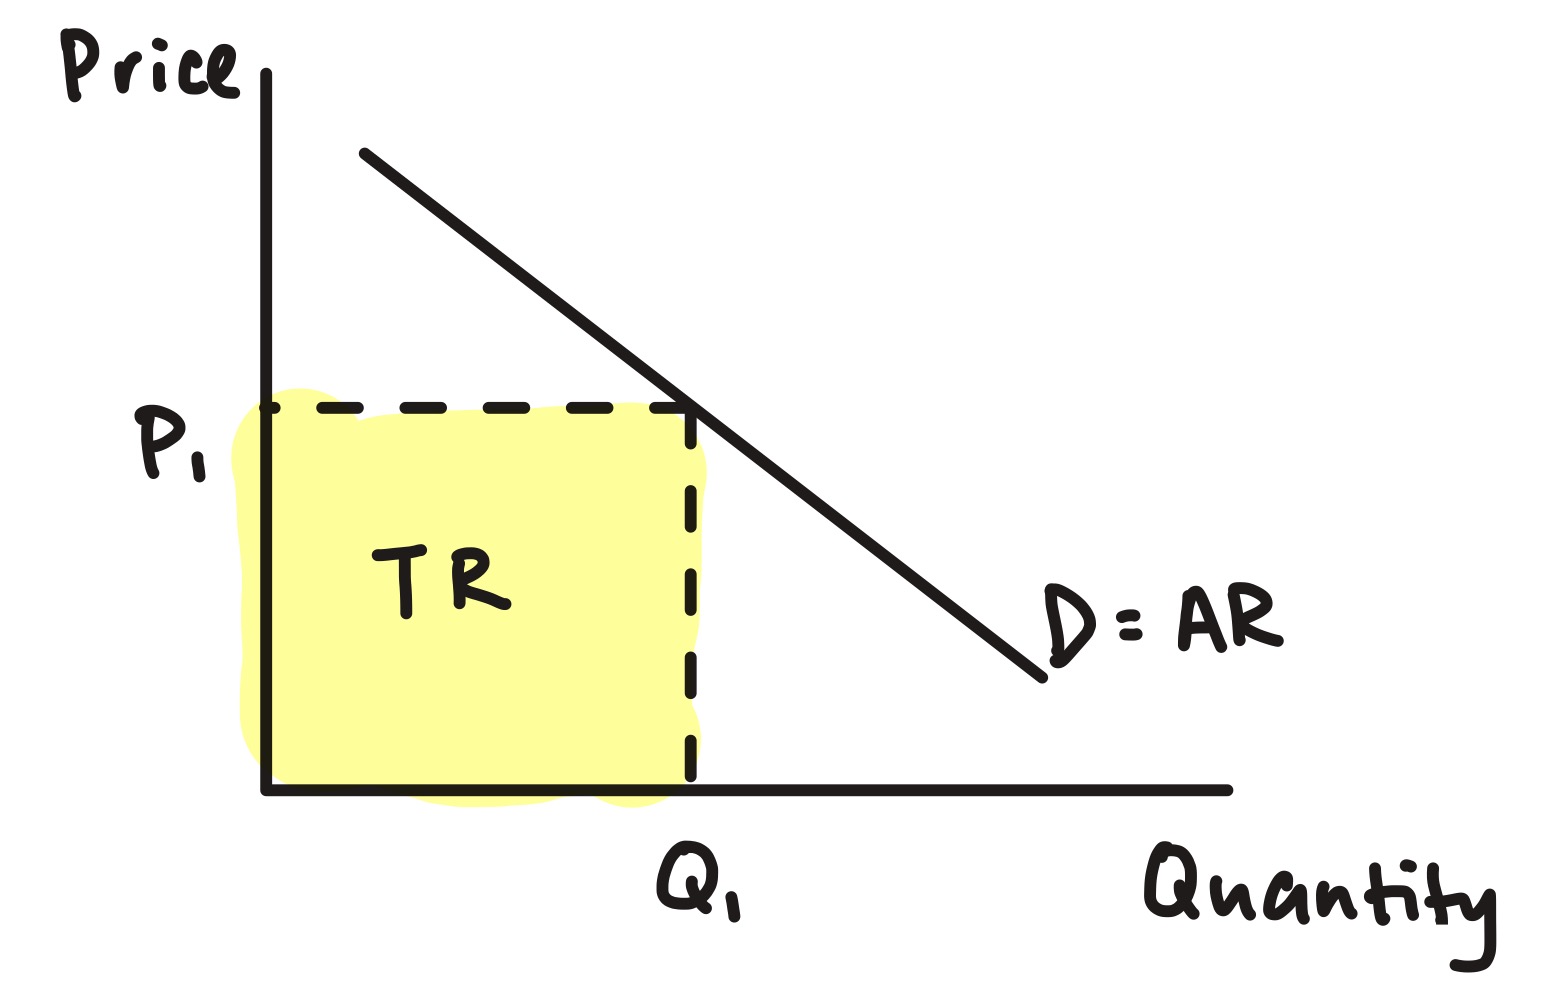
what is total revenue (TR)?
the money a firm receives from selling its output
TR = P x Q
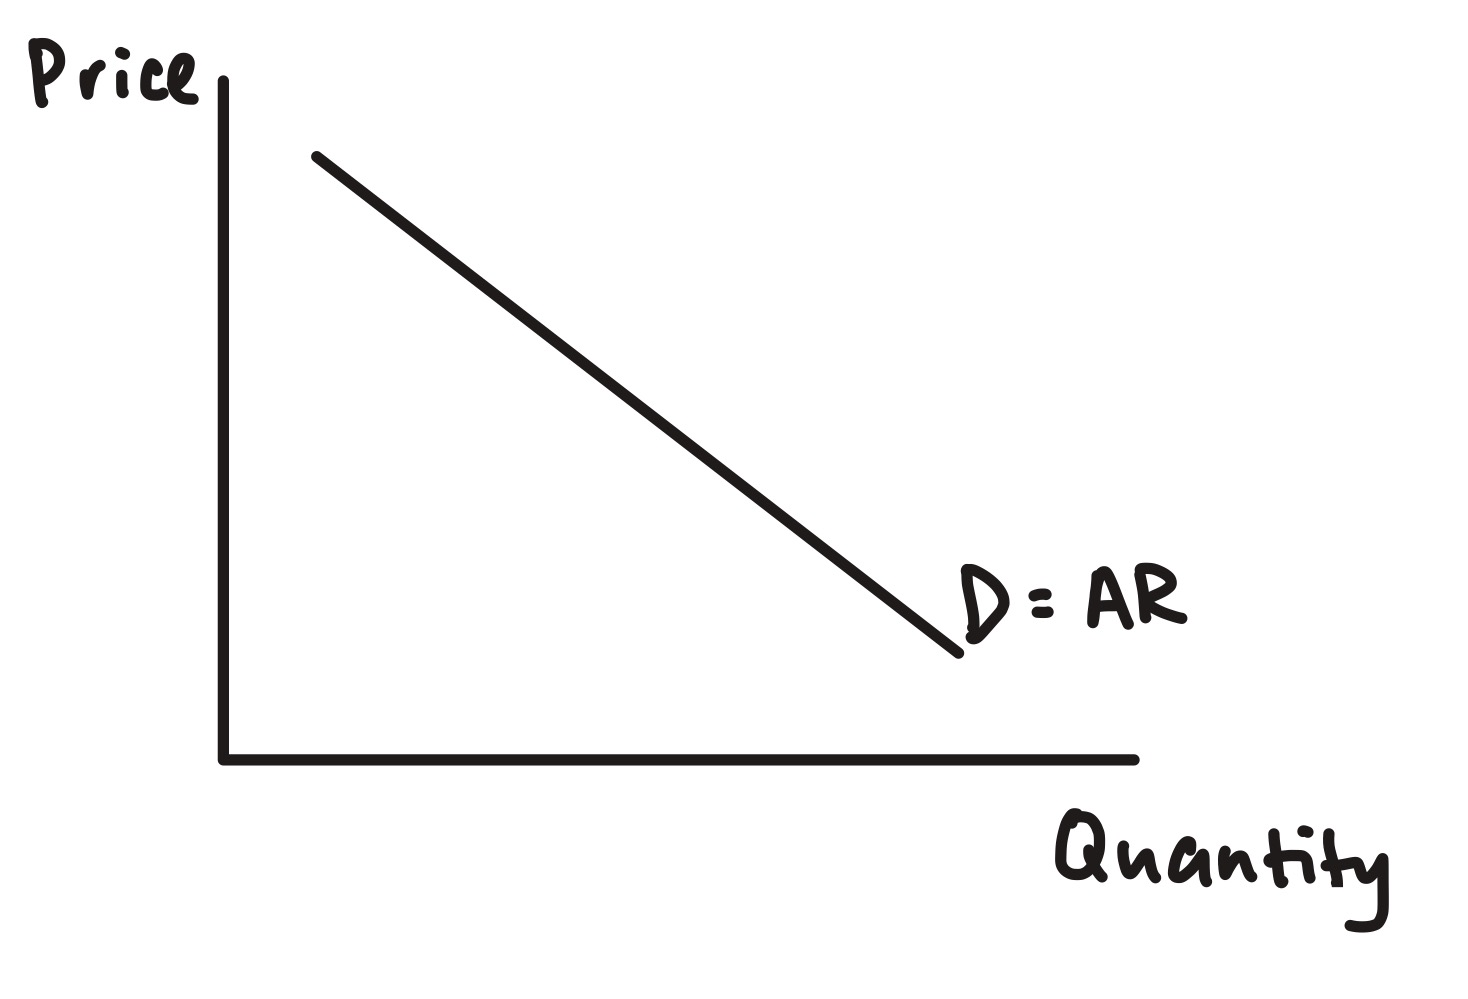
what is average revenue (AR)?
revenue per unit sold
AR = TR / Q
(AR = price)
what is marginal revenue?
the extra revenue receives as a result of selling the an additional unit of output
MR = change in TR / change in output
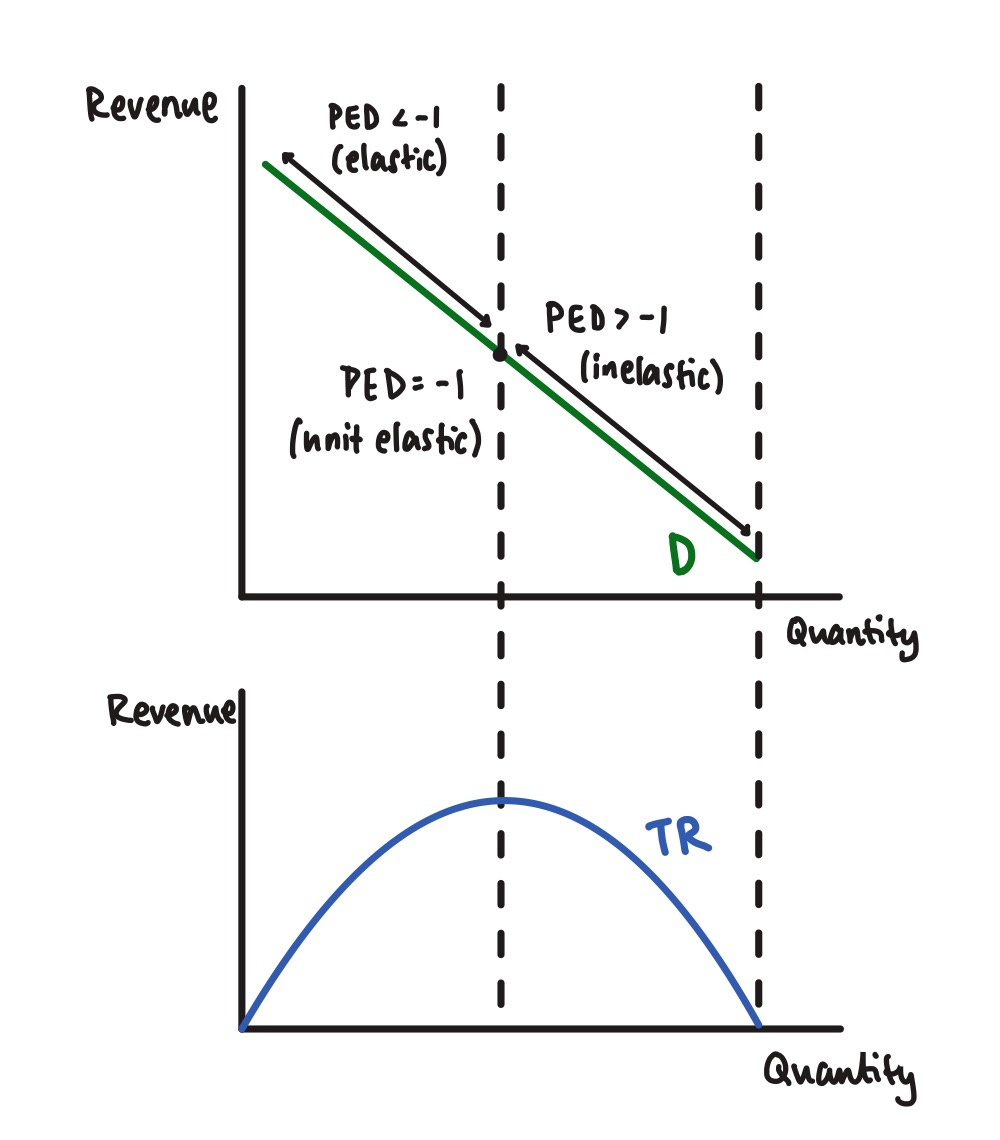
if AR = price, what can the demand curve also be labelled as?
the AR curve
how would you represent total revenue on the demand curve?
tr = p x q
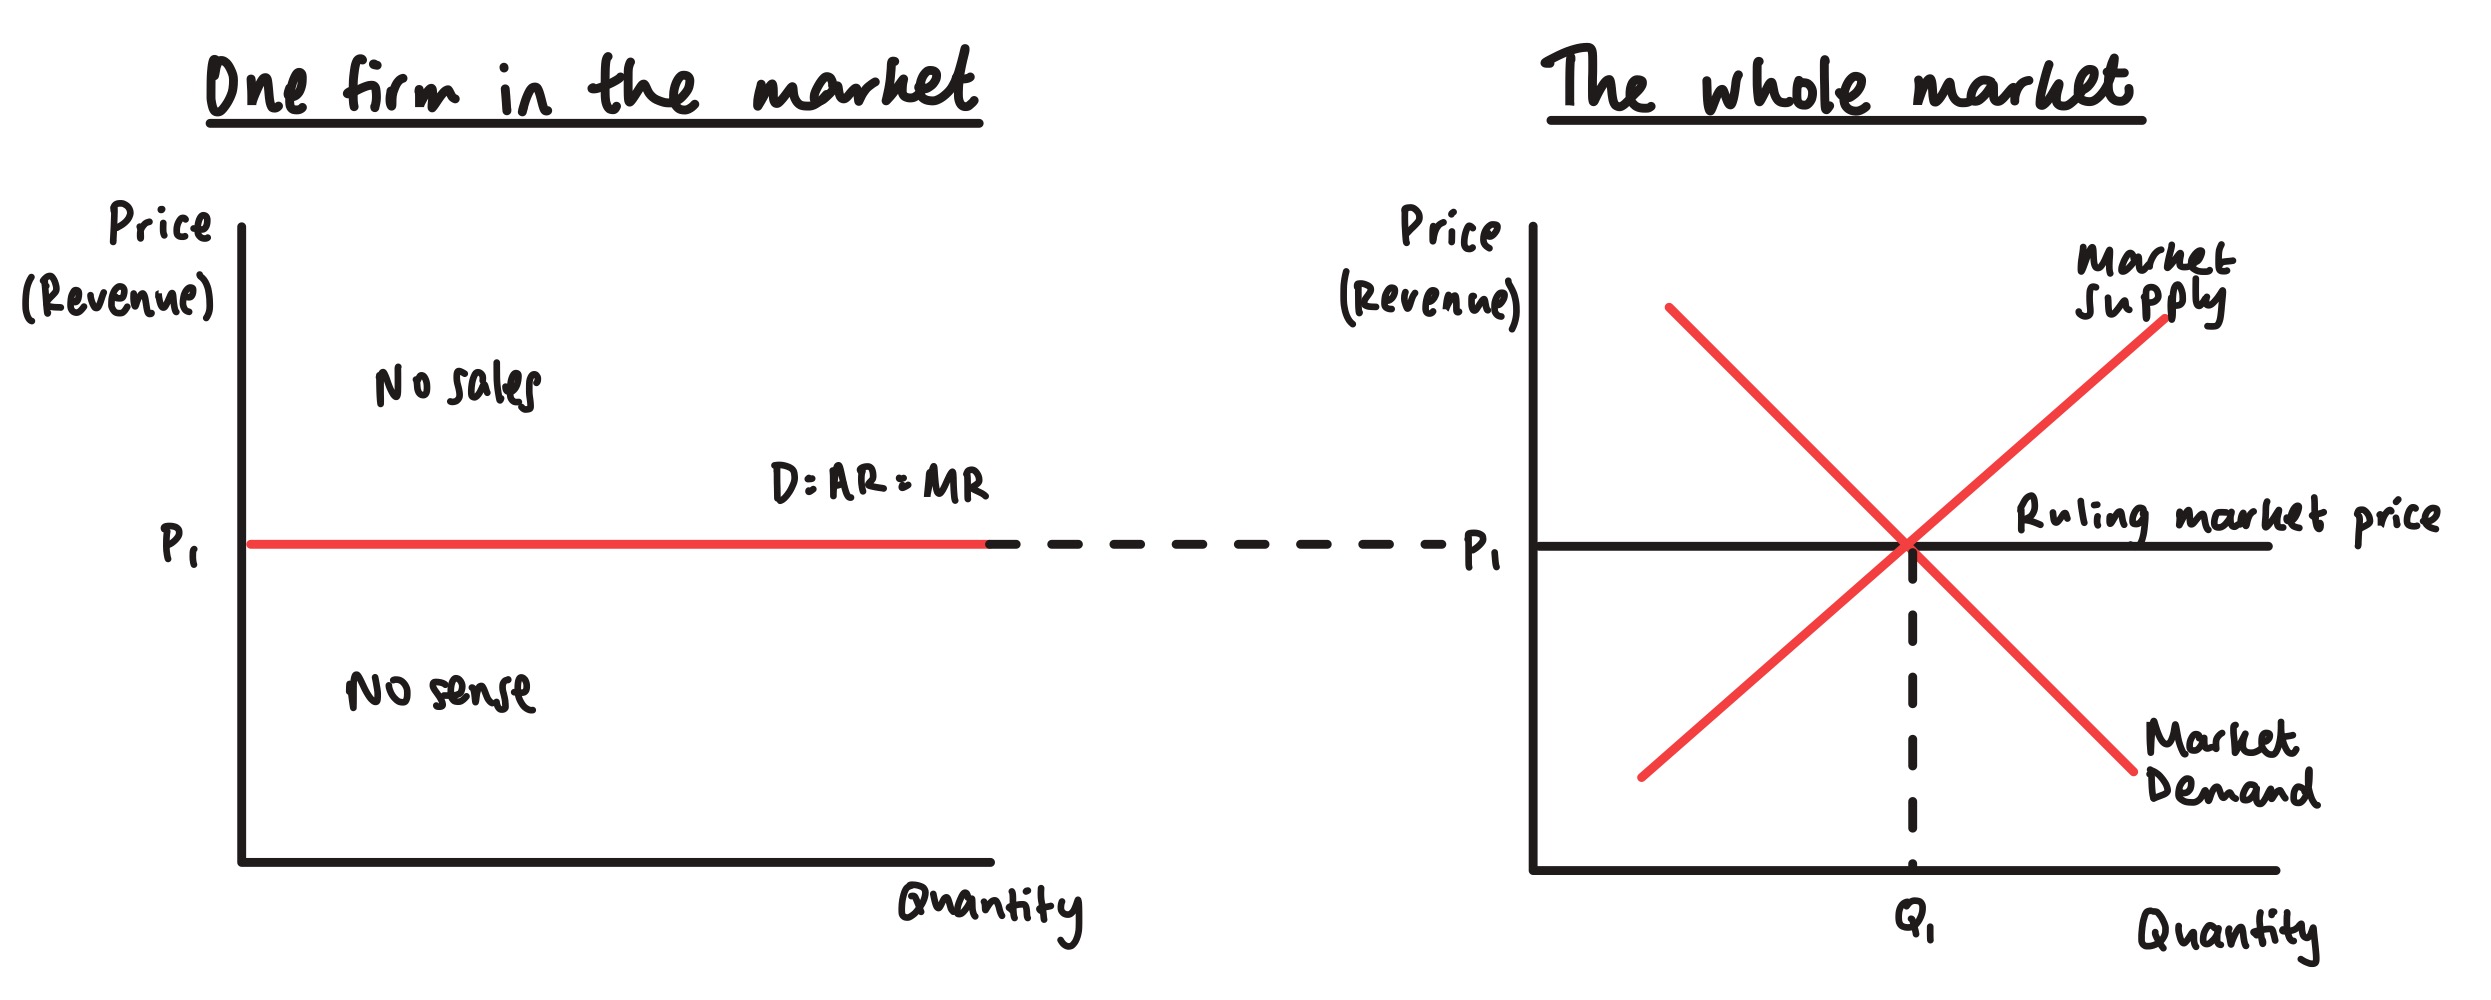
what’s a price taker?
a firm with no power to set its own price
it must accept the price set by the market
(perfectly competitive firm)
what’s the elasticity of the demand curve of a price taker?
perfectly elastic (horizontal)
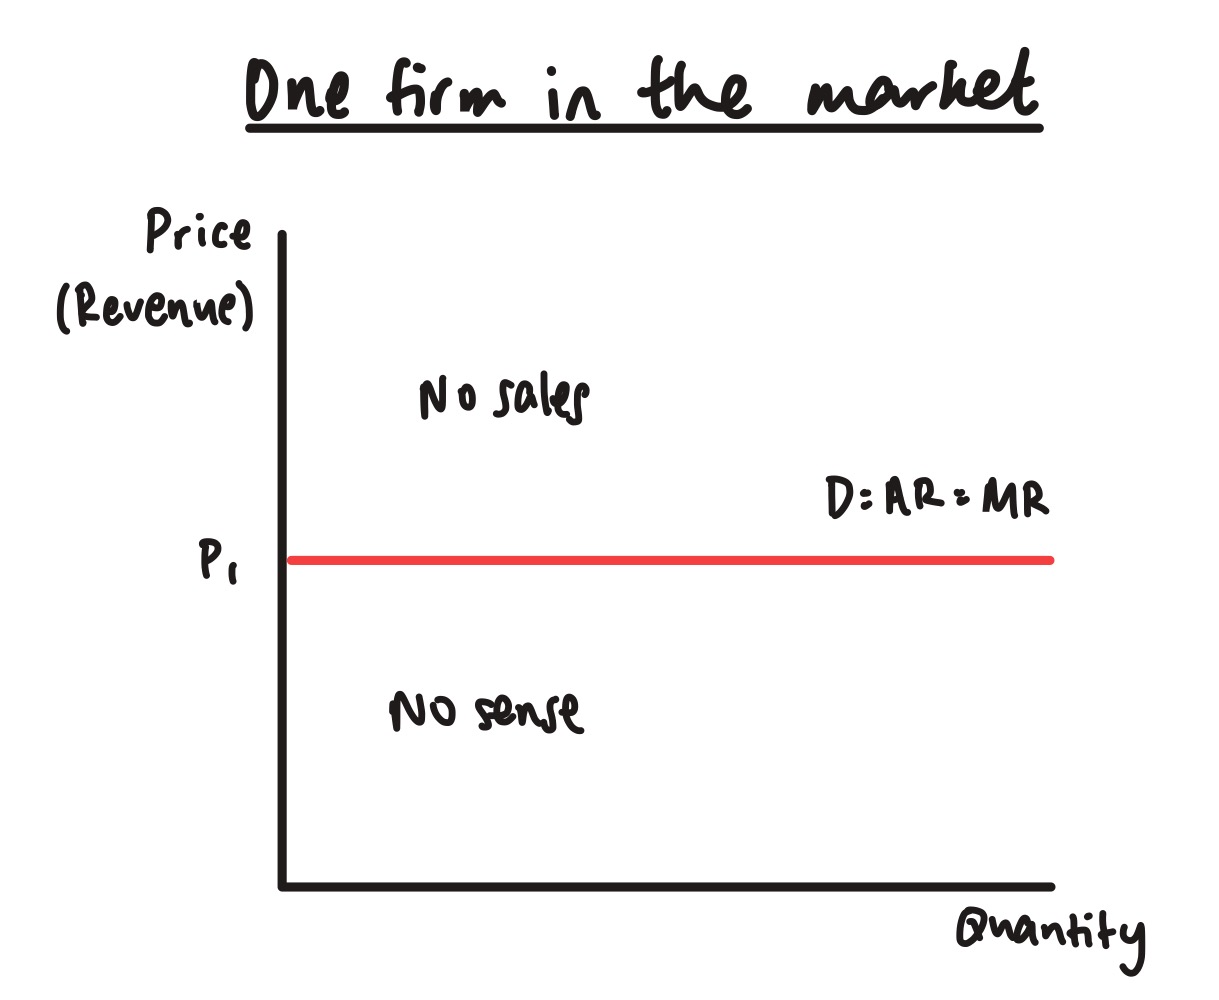

why is a price taker’s demand curve perfectly elastic?
raising the price means selling nothing
no reason to lower it → same Q sells at higher price
what’s the relationship between AR and MR when D is perfectly elastic?
MR = AR
price is the same at every output level
each extra unit sold brings in the same revenue as the last

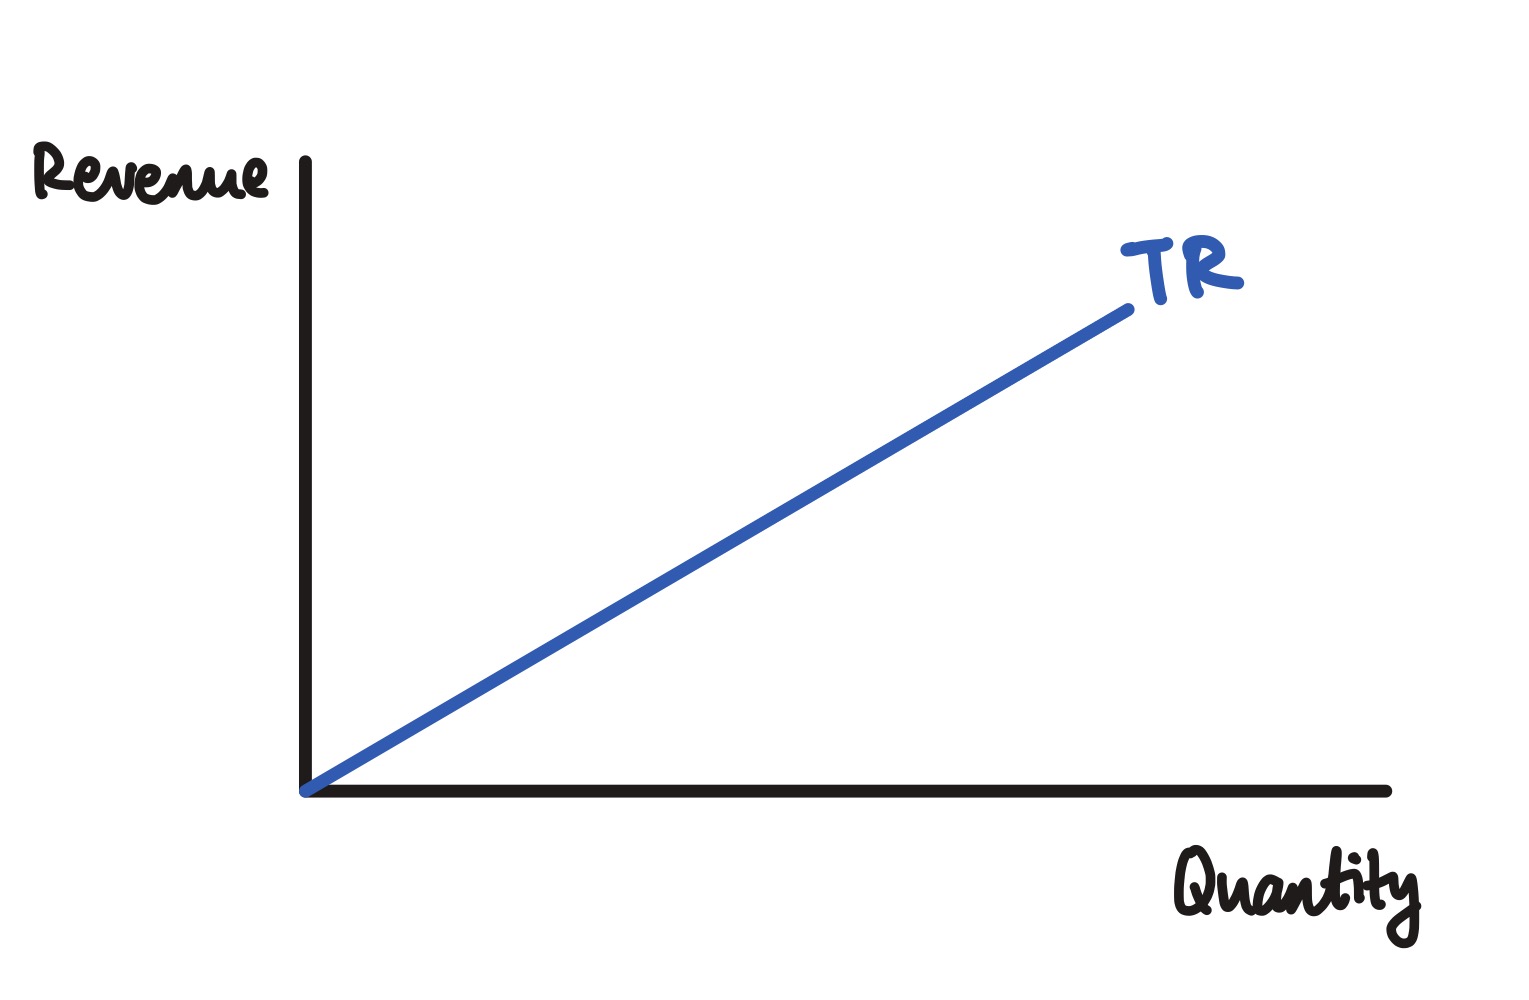
what happens to TR as a price taker sells more?
increases proportionally
price (AR) is constant → TR rises in a straight line as Q increases
show the relationship between the market and the individual firm in perfect competition
what is a price maker?
a firm with some power to set its own price (e.g. a monopolist)

why does the monopolist’s demand curve slope downwards?
it is effectively the entire market demand curve
to increase sales the firm must reduce the price
where on a downward sloping demand curve is demand elastic?
left of midpoint
decreasing the product’s price towards the midpoint will cause a more than proportionate increase in sales
→ TR will increase
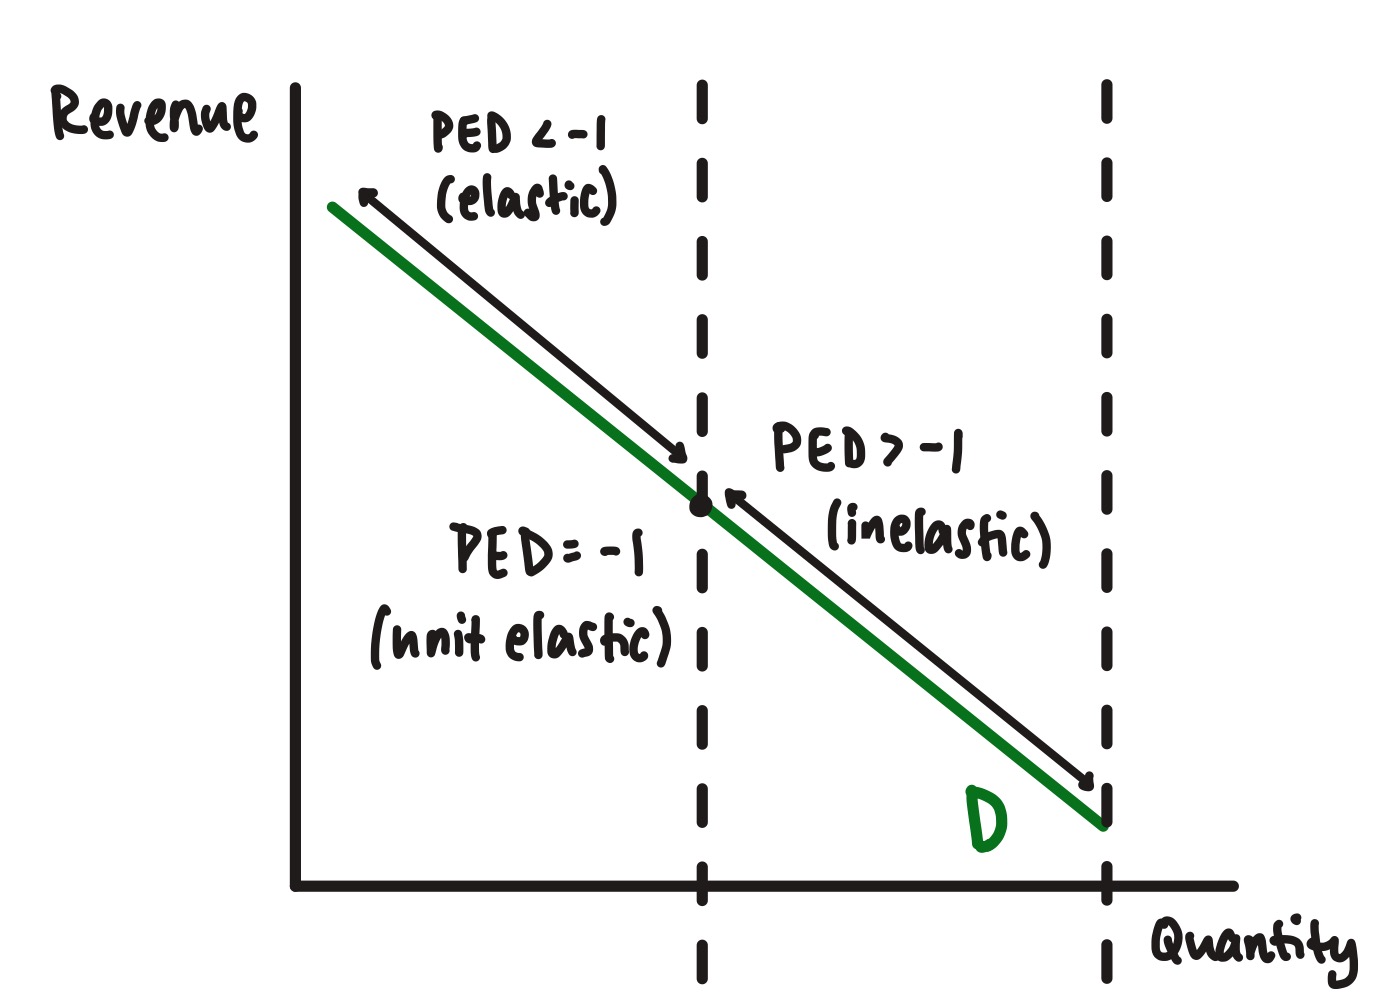
what happens to TR when a firm cuts price in the elastic section of its demand curve?
TR increases
the proportionate rise in sales is greater than the proportional fall in price