COL 1 Study Guide Updated
1/48
There's no tags or description
Looks like no tags are added yet.
Name | Mastery | Learn | Test | Matching | Spaced | Call with Kai |
|---|
No analytics yet
Send a link to your students to track their progress
49 Terms
When to use OTSeeker
EBP research
Characteristics:
trials
Systematic reviews
CINAHL stands for
Simulating index to Nursing and Allied Health Literature
CINHAUL has what type of data
OS/OT literature
CharacteristicsÑ:
research on health promotion, adaptation, ccc
What database is used for strategies and interventions of occupational balance
PubMed and CINAHL
what database can be used to find studies for occupational identity and well-being
ERIC and SCOPUS
When looking for resources on occupational justice, inclusion, and equitable access use:
OTDBase and CoChrane Library
Databases that provide insight into adaptation strategies and case studies use which two databases
OTSeeker and CINAHL

Provided the Table, what is the sample size?
32
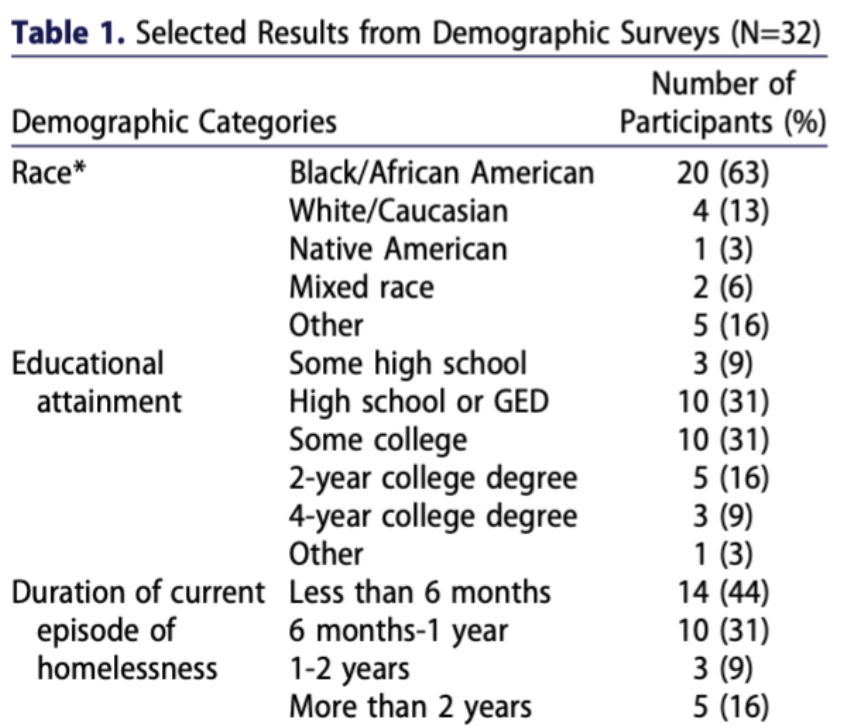
Provided the table, what is the percentage of participants that have a 2 year college degree?
16%
Using the following quote from the Boden Article on Menstrual Hygiene, “Demographic survey results indicated that all 32 individuals identified their gender as women, with 31 identifying their sex as female and one as intersex” this specific part of the data collected is called?
categorical
Time, measurements, speed, weight/height, are what kind of data points?
continuous
what are the measures of central tendency
mean, median, mode
mean
average
median
middle score, resistant to outliers
mode
most frequent score
what are the measures of variability
standard deviation and variance
what is variance used for
find the average spread of scores
What is the purpose of distribution curves
to show frequency of scores
What is the shape of a normal distribution
bell-shape
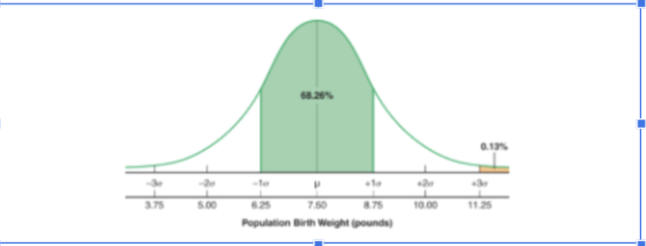
Provided this chart from Chapter 23 of the textbook, what is the mean?
7.50

What is the interpretation of the mean?
the average population birth weight was 7.5 lbs
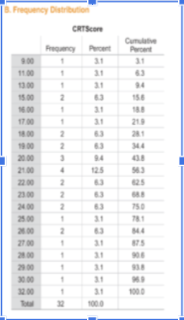
Provided the table below chart from Chapter 22 of the textbook, what is the mode?
21 or 22
What is statistical inference used for?
used to determine whether observed patterns are meaningful or due to chance
What is statistical significance?
meaningful patterns observed in treatments relationships, causes and effects
p < .05 —> If the p value of statistic calculated is less than 0.05, what can we say about the study
that the findings of the study were statistically significant
p ≥ .05 —> If the p value of statistic calculated is greater than 0.05, what can we say about the study:
that the findings of the study were NOT statistically significant
How would you interpret a 95% confidence interval
there is a 95% chance that the confidence interval captures the population mean
If you wanted greater assurance that results are more reliable than 0.05 what level would you use?
0.01
when should you use a one-tailed test
when the direction of relationship is known
when should you use a two tailed test
when the direction of the relationship is unknown
what is non-parametric data used for?
when data data collected is extremely skewed
what does parametric data examine?
focuses on median, frequency, rankings and counts of CAtEGORICAL or ORDINAl data
when would you use the Wilcoxon Signed Rank Test
when you cannot use a paired t-test since the data does not follow a typical distribution
In a coffeeshop, the manager wants to see if jazz music is relaxing. So she asks 8 customers to rank how they feel on a scale of 1-10 when pop music is playing and then again when jazz music is playing.
What statistical test would you use?
Wilcoxon Signed Rank Test
In a coffeeshop, the manager wants to see if jazz music is relaxing. So she asks 8 customers to rank how they feel on a scale of 1-10 when pop music is playing and then again when jazz music is playing.
If the p = 0.048 in this word problem, what can we say about jazz music and its effect on mood?
It is statistically significant that the customers find jazz music more relaxing than pop music
what is correlation used for?
to examine the relationship between x and y in exploratory studies
what is the purpose of correlation coefficients
measure direction and strength of a relationship
if the correlation coefficient of a study is measured at -0.87 , what can we say about the relationship
the relationship between the variables is negatively strong
why use scatterplots
to visually represent relationships
Why did the Stav Study use a chi-square test
because the researchers wanted to test associations between categorical data points and see if sample distribution matched population distribution
What is the purpose of a paired t-test
to use in cases of repeated measures
what is the definition of a t-test?
statistical ratio used to compare two means from either two independent samples or one sample with repeated measures
what is the purpose of a t-test
to observe if intervention had a significant difference or was just chance
what is an example of a “matched value” in a paired t-test
the before and after scores of the same participant , or two participants that share a similarity that can be compared (like same starting point)
what is the perk to paired t-tests
reduce variance and increase power because extraneous factors are the same for both measures

Provided this section from the table from the Benham 2020 article on paired t-tests where the participants are asked whether or not technology program TAM would improve different areas of job performance before and after use of it, what can be interpreted about the perceived usefulness and why?
after using TAM, participants had an increase in the perceived usefulness of 3D printers improving job quality for occupational therapists
we know this because the p-value provided is 0.005 which is <0.05
Pulling from the Benham article for Paired-T Tests, pick which of the underlined would best fill in the parenthesis and why:
“From pre- to posttest over 12 wk, (NON SIGNIFICANT OR SIGNIFICANT) differences were obtained for perceived usefulness, t(57) = −3.431, p = .001, d = 0.451; perceived ease of use, t(57) = −8.583, p < .001, d = 1.136; attitude toward using, t(57) = −2.545, p = .014, d = 0.334; and intention to use, t(57) = −5.024, p < .001, d = 0.660.
SIGNIFICANT, because the p-values calculated are less than 0.05
What is the definition of t-value
effect size / variability of data
what does it mean if the t-value is negative in a paired t-test study on pre and post test scores?
that the post test scores were higher than the pre-test scores