FSCI 4600 Exam 2
1/109
Earn XP
Description and Tags
DNA Analysis
Name | Mastery | Learn | Test | Matching | Spaced | Call with Kai |
|---|
No analytics yet
Send a link to your students to track their progress
110 Terms
PCR Benefits
PCR enabling scientists to work with biological evidence that was previously considered insufficient for testing.
Sensitivity: Amplify DNA from a single cell
Speed: a few hours
Specificity: Target specific loci of interest
PCR Process Brief
PCR is an Enzymatic process that replicate specific region of DNA over and over again. Process involves heating and cooling samples over about 30 cycles.
Three main phases of PCR (Temperature dependent steps)
Denaturation (94 °C) separate the DNA double strands
Annealing (54-60°C) Primer binding
Extension (72°C) DNA polymerase extends
PCR process Detailed
32 cycles make approximately 1 billion copies of DNA. It is in exponential growth
Early cycle (1-15) Amplification is largely exponential. Product is difficult to detect because the cope numbers are still low. Highest reaction efficiency.
Mid cycle (15-25) Product is detectable. Amplification remains efficient, copies are in millions
Late cycle (25-32+) Reagent depletion, product inhibition and enzyme degradation cause the reaction to plateau. Add more run will introduce artifacts.
PCR Components
DNA Template: The sample containing the target region to be amplified
Primer: Short 18-30 bases that flank target region and provide a starter point for DNA synthesis (forward and reverse)
dNTPs: Individual building blocks used by polymerase to construct new DNA strands
DNA Polymerase: A thermostable enzyme that synthesizes new DNA strands complementary to the template
Buffer and MgCl2: Provides optimal PH and ionic conditions; mag ion serves as a cofactor essential for polymerase activity.
PCR Primers
It determine which region of the genome will be amplified and flank the target region
Forward primer binds to 3’ end of the sense (coding) strand
Reverse Primer binds to 5’ end for the antisense strand
In forensic DNA typing, primers are designed to amplify specific STR loci used for human identification.
dNTP and Plymerase
dNTP- the binding blocks of 4 bases. An equal concentration of all 4 dNTP (about 200 µM each) is important to avoid disincorporation
DNA Polymerase- the engine. Taq Polymerase is isolated from the thermophilic bacteria. It is stable at high temperature around 94 °C. It synthesizes new DNA rate of 1000 bases per min at 72 °C
Component proportions
DNA Template: 0.5-2.5 (ng)
Forward and reverse primers: 0.1-1 µM each
dNTP: 200 µM each
Tag Polymerase: 1-2.5 units per reaction
MgCl2: 1.5-3 mM
PCR Buffer 1
Nuclease- Free Water: to final volume (25 µL)
Too much MgCl2 will cause non-specific amplification and spurious products
Too little templet DNA introduce stochastic effect.
Commercial Multiplex STR kits pre-optimize these concentrations.
Master Mix
Set of samples that contain the same primers and reaction components. Add equal amount of master mix to each sample. This procedure helps ensure relative homogeneity among samples.
Combine stared reagents
Aliquot Equally: improving the accuracy and producibility of each reaction
Add Template Last: Ensure any differences are coming from the DNA temple itself
Never introduce variability in the reaction components and method
Mister Mix Set Up
Global Filer kit: Master mix 7.5 µL and primer set 2.5µL
Multiples PCR in Forensic STR Analysis
Simultaneous amplification of multiple STR loci in a single reaction.
This approach maximizes the information obtained from limited forensic specimens while minimizing sample consumption.
Control used to monitor PCR
Controls are required by accreditation standards
Controls serve as internal benchmarks that verify the reaction worked correctly and that no contamination has occurred.
Negative Control (reagent blank or non-template control)
Purpose: Detects contamination in the PCR reagents, lab environment, or consumables.
Failure response: If a negative control shows amplification, the entire batch of results is considered compromised. Lab mast investigate the source of contamination and discard reagents.
Best Practices: Always prepare and handle the negative control first to prevent cross contamination.
Positive Control
It serves as a valuable indicator of whether any of the PCR components have hailed or not added.
Known DNA Temple: standard good quality DNA should be used. Commercially supplied control
Same Reaction Conditions: it must be amplified with the same PCR primers
Confidence Builder: ensure confidence that the reaction components and thermal cycling parameters are working properly for amplifying a specific region of DNA. Positive control fails, all results from that run are invalid.
Interpreting control results
Positive: Alleles present at all loci
Negative: No amplification product detected
Only when both controls pass can the forensic analyst proceed to interpret the evidence samples. dual control system forms the backbone of defensible forensic DNA results.
Stochastic Effects from low levels of DNA sample
Very low levels of DNA can cause stochastic fluctuation.
Definition: Unequal sampling of the two alleles present from a heterozygous individual.
Allele Dropout: in severe cases, stochastic effects can create false homozygosity results. When one or two alleles fails to be detected entirely, it is called allele dropout.
Mitigation Strategies: Increasing the PCR amplification cycles, replicate testing or using enhanced detection kits.
PCR Thermal cycling
Different primer sequences have different hybridization properties so need different cycling protocols.
Initial Denaturation: 95 °C for 11 min to activates hot-start polymerase and ensures complete denaturation
Denature 94°C for 20 sec Repeated each cycle to fully separate double strands
Annealing 59°C for 2 min. primer bind, too high reduces binding and too low permits non-specific annealing
Extension 72°C for 1 min
Final Extension 60°C for 25 min Ensure complete adenylation (+A) of all amplicons for consistent genotyping with size standards.
Thermal Cycler
The instrument that heats and cools a DNA sample in order to perform the PCR.
Peltier- Based system
Verification and Calibration ± 0.5 °C
Rapid cyclers can complete 28 cycles under 30 min
AmpliTaq Gold DNA Polymerase
AmpliTaq Gold is a chemically modified, hot-start DNA polymerase. Require activation step- 95 °C for 10-11 min before begins synthesis.
Hot-Start Advantage: Prevents nonspecific amplification and primer-dimer
Thermal Activation: Chemical modification block polymerase activity until heat removes the blocking groups. Ensure controlled initiation
Used in Forensic STR kits
PCR Primer Design and How primer work
PCR primers are short, single-stranded oligonucleotides (18-24 bases) that flank the targeted DNA region to amplify.
Each PCR reaction requires a forward and a reverse primer during the annealing step, primers hybridize to complementary sequences on opposite strands of the denatured template DNA. DNA polymerase extends from the 3’ end of each primer.
PCR primer design key terms
Tm-Melting temperature at which 50% of primer-template duplexes dissociate
GC Content- Percentage of guanine and cytosine bases (40-60%)
Amplicon-The PCR product defined by the primer pair
Calculating Annealing Temperature
The annealing Temp is typically 3-5 °C below the lowest Tm of the primer pair.
Common Primer Problems
Primer Dimers: Primers bind to each other instead of target templet and producing artefactual low molecular weight bands.
Hairpin Loops: A primer folds back on itself dur to internal complementary, reducing the amount of functional primer activity
Non-Specific Binding: Primers anneal to unintended genomic regions generating extra products.
NCBI Primer-Blast: Free tool to design primers
Multiplex PCR
amplification of multiple genetic loci.
Fluorescent Dye Labeling distinguish different region
Careful Optimization: Primer concentration (equalize peak heights), annealing temp (fine-tuned to accommodate all primer pairs), buffer conditions and MgCl2 concentration must be meticulously balanced
PCR Inhibition
Inhibitors are the substances that co-extracted with DNA from evidence.
Cell Lysis Interference: Some inhibitors disrupt the lysis step during DNA extraction
Nucleic Acid Degradation or Capture
Polymerase Activity Inhibition like humic acid, hemation block DNA polymerase.
Common Solution for PCR Inhibition
DNA purification during extraction
Diluting the template DNA
Use BSA (bovine serum albumin) or specialized polymerase
Prevent Contamination
Physical separation: Pre and post PCR in separate rooms
Personal Protection Equipment: Wear disposable gloves, Change and bleach gloves frequently
Laminar Flow Hoods for pre-PCR
Aerosol-Resistant Tips: Filtered pipette tips must be used and changed between each sample
Rigorous decontamination: clean with 10% bleach, followed by ethanol and UV irradiation
Genetic Markers and Repeated DNA Sequences
Genetic markers are specific known locations on chromosomes.
Focus on markers in Non-coding regions of DNA
Most genetic markers are repeated DNA sequencing where highly polymorphic for distinguishing one person from another.
Understanding Repeated DNA Sequencing (Classified by length)
Satellite DNA: Very long arrays of tandem repeats. Not typically used in forensic analysis due to their size and complexity
Minisatellites (VNTRs): Repeats units of 6-50 base pairs. Used in early DNA fingerprinting but largely replaced by STRs due to the need for large DNA quantities and difficulties with degraded samples.
Microsatellites (STRs): Repeat units of 2-6 base pairs. The Gold standard in modern DNA typing
Types of STR Markers- named by the length of the repeat unit
Dinucleotide: 2bp repeats common but prone to stutter artifacts
Trinucleotide: 3bp repeats, relevant in medical genetic.
Tetranucleotide: 4bp repeats Preferred in forensic- low stutter rates and cleaner profiles
Pentanucleotide: 5 bp repeat used in some expanded kits
Categories for STR Markers
Simple repeats- units of identical length and sequence
Simple repeats with non-consensus alleles
Compound repeats- two or more adjacent simple repeats
Complex repeats- several repeat blocks of variable unit length
TH01 9.3 allele is a classic example of a microvariant- an allele that contains an incomplete repeat unit.
STR use in Forensic DNA typing
STR have become the backbone of forensic DNA analysis worldwide.
PCR Amplifiable: STR loci produce small amplicons (100-350bp) that makes them ideal for degraded or limited DNA samples.
Highly discriminating: the combination of multiple PCR loci produces random match probabilities often exceeding 1 in a quintillion.
Database Compatible: STR profiles are stored digitally as simple numeric genotypes, enabling rapid searching across CODIS
Internationally Standardized: Core STR loci are shared across jurisdictions.
Allelic Ladders
It is a critical quality control tool that consists of a mixture of the common alleles present in the human population.
Purpose: Allelic ladders serve as a calibration standards. It can accurately assign allele designations by comparing fragment migration times.
Construction: Ladders are constructed by combining PCR products from multiple individuals who collectively possess all known common alleles at a locus.
Genotyping Accuracy: Without allelic ladders, small variations in electrophoretic conditions could cause allele miscalls. The ladder ensures that every run is internally calibrated, maintaining consistency,
Reading the Ladder
Evidence sample peaks are compared to the ladder peaks based on their electrophoretic mobility.
Alleles are called when the peak falls within a deigned ± 0.5 bp window of corresponding ladder allele. Peaks falling outside all windows are flagged as off-ladder (OL) alleles.
Off-ladder alleles may represent rare microvariants or technical artifacts.
Allele designation and nomenclature
STR alleles are named according to the number of repeat units they contain. EX: 12 GATA repeats at TPOX is designated allele 12.
Microvariant alleles include a decimal indication incomplete repeats. TH01 allele 9.3 contains 9 repeats + 3 bases.
the International Society of Forensic Genetics (ISFG) maintains recommendations
Core STR Markers
It is a common set of standardized markers must be used
in 1997, the FBI selected 13 core CODIS loci as the national standard
in 2017, expended to 20 core loci to improve international compatibility and increase discrimination power
Commercially Available STR Kits
Thermo Fisher Scientific produces the GlobalFiler and Indentifiler
Promega Corporation produces the power place fusion series
Technology with the new Kits
Multiple Dye Detection Systems: PCR products across 5 or 6 distinct fluorescent dye channels. Each channel is detected independently.
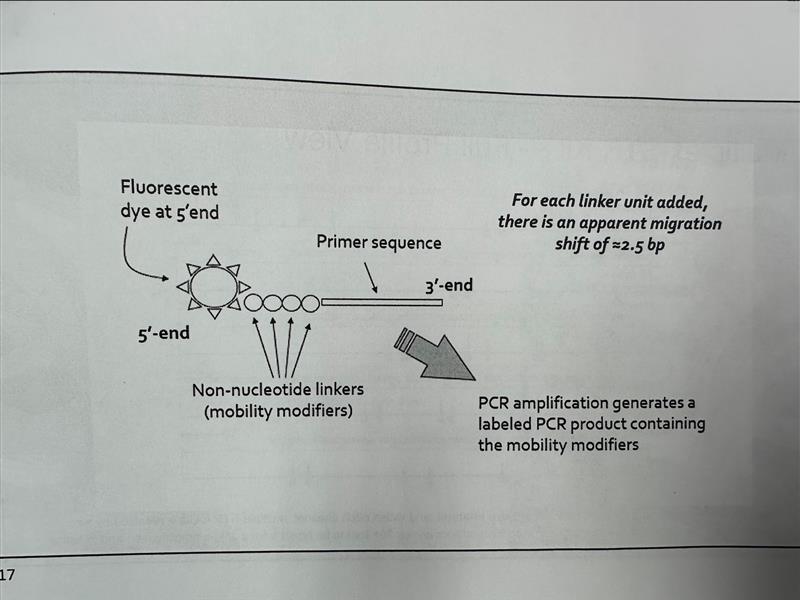
Mobility-Modifying Non-Nucleotide Linkers: Composed of hexaethyleneoxide (HEO) units, each linker shifts apparent migration by approximately 2.5 nucleotides. The linkers are added to 5’ end of PCR primer resulting amplicons carry the extra molecules. By incorporating different numbers of linkers, the mobility of alleles from closely spaced STR loci can be shifted relative to one another preventing overlapping size range.
Non-Nucleotide Link Explained
5’ Fluorescent Dye: A fluorescent label is attached at the 5’ end of the primer
HEO Linker Units: Non-nucleotide HEO units are added between the dye and the primer sequence. Each unit shifts apparent migration by about 2.5 bp.
Primer Sequence
Labeled PCR Product: Lebel and mobility modifiers creating a predicable size shift.
NIST/ STRBase
The National Institute of Standard and Technology (NIST) maintains STRBase.
STR References: Comprehensive sequence and allele frequency data for a commonly used forensic STR loci.
Microvariant Alleles: Documentation of rare off ladder STR alleles and their population frequency
Trialleltic patterns: Recording of three alleles appear in a single individual due to duplication
Additional tools: Mutation rate data, concordance studies between kits.
Reason and Goal for seperation
After PCR amplification, the mixture contains DNA fragments of different sizes. Physically separate those fragments based on their length.
Why separate: without separation, all amplified DNA fragments would appear as a single undifferentiated mixture. Separation allows us to determine the exact sizes of each fragment.
Goal: produce DNA profile. This requires precise resolution of fragments that may differ by only a single base pair in length
Electrophoresis
Primary technique used to separate DNA fragments. Term comes from the Greek words electro (electric) and phoresis (to carry). It exploits a fundamental property of DNA that is negative change.
How electrophoresis work
Negatively changed DNA migrates toward the positive electrode (anode), Smaller fragments move faster and larger fragments are retarded and created a separation.
The sieving medium (gel or polymer) acts as a molecular obstacle course.
Electrophoresis Factor
Electric field strength: Higher charge increases migration speed but can reduce resolution and generate excess heat. Balance speed and accuracy
Sieving Medium: the Pore size of the gel or polymer matrix determines the effective separation range. Smaller pores resolve smaller fragments more precisely.
Fragment Size and Shape: DNA migrates inversely proportional to the log of its molecular wright. Single stranded DNA sieve differently than double-stranded DNA.
Buffer and Temperature: Buffer composition maintains PH and conductivity. Temperature control prevents band distortion caused by uneven heating
Native vs. Denaturing Electrophoresis Conditions
Native (nondenaturing): Double-stranded DNA. Simpler to setup but offers lower resolution between similarly sized fragments.
Denaturing: Use single-stranded DNA by chemical denaturing (urea / formamide) or heating
key advantage of denaturing system
Resolution between closely sized DNA molecules
Single-stranded DNA is more flexible than double stranded DNA and therefore interacts with the sieving medium more effectively
Native vs. Denaturing Electrophoresis Conditions
Modern forensic STR Typing exclusively uses denaturing conditions because the single-base the single base resolution required for accurate allele calling demands the highest possible separation fidelity.
Native: Rigid rod -like structure less interaction with sieving matrix. Lower resolution.
Denaturing: Flexible, random coil conformation. Greater interaction with polymer pores. Superior resolution.
Gel Electrophoresis
Original DNA separation technique. Matrix: typically agarose or polyacrylamide.
Gel electrophoresis process and type of Gel
DNA samples are loaded into small walls at one end of the gel. An electron field is applied that causes negatively charged DNA fragments to migrate through the gel matrix towards the positively charged electrode.
Agarose gels- larger pore size suitable for separating 200bp - 20kb
Polyacrylamide gels- smaller, more uniform pores, Ideal for resolving small fragments like 1bp
Limitation of Gel Electrophoresis
Time Consuming 2-4 hours
Labor intensive: Manual gel casing, sample loading with micropipette and hands on detecting steps
Hazardous Materials: Polyacrylamide is neurotoxin before polymerization
Limited Throughput: Only a fixed number of samples can be loaded per gel.
Capillary Electrophoresis (CE)
DNA separation inside a narrow glass capillary. The capillary is field with a flowable polymer solution that acts as the sieving medium. DNA fragments are injected into one end and separated as they migrate through the polymer under an applied electric field.
Advantage of CE Over Gels
Speed: Takes 20-30 min
Automation: Reduce hands on labor
Sensitivity: Laser induced fluorescence detection can detect picogram quantities of DNA
Digital Output: Results are recorded as electropherograms
Quantitative data: Peak heights and areas in electropherograms provide quantitative information which is essential for mixture interpretation
multi-color detection: Fluorescent dye labels simultaneous detection of multiple loci in different colors, enabling multiplex STR analysis in a single injection
Minimal Sample Required only about 1 μL of amplified product is needed per injection
Reproducibility: Internal size standards run with every sample ensure consistent and reproducible sizing across different instruments, runs
Disadvantage of CE
Instrument Cost: exceeding $100,000
Single Sample per Capillary: Each capillary processes one sample a a time.
Electrokinetic injection bias: The injection method preferentially loads smaller and more mobile ions, which can affect the relative representation of fragments- degraded or inhibited samples
Sensitivity to contaminations: Salts, dyes and other contaminants in samples can interfere with injection efficiency and separation quality
Small salt ion (cl-) that compete with the DNA for loading onto the capillary.
Components of CE
Capillary: A fused silica capillary filled with a polymer sieving matrix. the narrow bore enables efficient heat dissipation and high resolution separation.
Laser and detector: An argon ion or solid state laser excites fluorescent dye labels on DNA fragments. A camera or photodetector captures the emitted light
High-Voltage Power Supply: Applies 10-15 kV across the capillary to drive electrophoretic migration.
Autosampler: A robotic arm positions samples plates
Polymer
In CE polymer serves as the sieving medium. CE uses liquid polymer solutions and those polymers form a dynamic mesh or network of entangled chains that act as molecular sieves.
Linear polymer: Flexible, replaceable chains that can be pumped in and out of the capillary between runs
Cross-Linked Polymers: Fixed gels that are poured and set in place
Performance Optimized Polymers: POP-4 standard for STR, balances resolution and run time. POP-7 for Higher viscosity polymer for SNP and sequencing for single base separation.
Polymer directly impacts resolution, run time, and the types of DNA fragments.
Electrophoresis and Fluorescence
Electrophoresis for physical separation and Fluorescence for optical detection.
Electrophoresis- DNA molecules carry a net negative charge and run through an electric field enabling size-based separation.
Fluorescence - Fluorescent dyes attached to DNA fragments absorb laser light at specific wavelengths and re-emit light at longer wavelengths.
Detection
DNA fragments are identified, measured, and recorded as they pass through the detector. The instrument uses a leaser to excite the fluorescent dye and a CCD camera or photodetector captures the emitted light.
Excitation: Argon ion laser illuminates the detection window as fragments pass through
Emission
Fluorescent dyes that attached to the DNA molecules can be used to detect and quantify, re-emit light at characteristic wavelengths.
Capture
The quality of detection directly impacts the sensitivity and accuracy of the DNA profiling result.
Methods for detecting molecules
Detecting methods impact on sensitivity, dynamic range, and the ability to multiplex- detect multiple targets simultaneously
UV absorbance: DNA absorbs UV at 260 nm. Not commonly used in STR
Laser-induced fluorescent: God standard; preferred method
DNA Fragment sizing and resolution
Fragment sizing is measured by inferred from migration time through the capillary.
Internal size standard: Known DNA fragments of defined sizes are co-injected with each sample, providing reference points. Building a size curve for every run.
Multicolor fluorescent CE systems use an internal sizing standard labeled with a different colored dye.
Resolution: The ability to distinguish two closely spaced peaks
Precision: Reproducible sizing across multiple injections and instruments
Basics of Fluorescence
Fluorescence is a photophysical process in Fluorophore molecule.
Absorption: A photon of excitation light is absorbed by the fluorophore promoting an electron from the ground state to an excited electronic state
Internal conversion: The excited electron rapidly relaxes to the lowest vibrational level
Emission: the electron returns to the ground state by emitting a photon of lower energy (Longer wavelength) this emitted light is the fluorescence signal detected by the machine.
Fluorescence process
The difference between absorption and emission is called the Stokes Shift. It permits the use of optical filters to separate excitation light from emission light that ensuring only the fluorescence signal reaches the detector.
The characterization of absorption and emission of a fluorophores is based on their chemical structure and environmental conditions.
Laser detector
The laser is the excitation source in CE providing energy needed to induce fluorescence.
Argon ion laser, produce light at 488nm and 514.5nm
Solid-State Lasers: at 505nm that offer longer life time and lower maintenance.
The laser beam is focused on the detection window of the CE. As each fluorescently labeled fragment passes through this window the laser excites the dye, generating the fluorescence signal that forms the basis of the electropherogram.
Detector
Modern forensic CE use charge-coupled device (CCD) cameras that simultaneously capture the full emission spectrum, enabling multicolor detection in a single run.
The spectral calibration matrix is critical for accurate color separation that generated using single due standard samples.
Spectral calibration matrix
Spectral calibration aka matrix or color deconvolution. it is the software uses images collected during the spatial calibration to establish a relationship between the signal emitted by each capillary and the position were the signal falls. It prevent bleed between two adjacent dyes and causes pull-up peaks
Run a matrix standard - generate reference emission profile for each dye
Build the spectral matrix
Apply deconvolution- mathematically subtracting spectral overlap
Importance of spectral calibration
Prevent incorrect genotype calls
Pull-up Peaks: a strong peak in one color channel produces a phantom “pull up” peak in an adjacent channel. These artifacts can be mistaken for true alleles in mixed profile interpretation.
Pull- down (Not common): Signal is subtracted too aggressively causing negative dips or suppressed peaks in neighboring channels
Recalibrate: regular schedule according to protocols
Evenly spaced, well-resolved peaks indicate a successful spatial calibration.
Intercalating Dyes and Forensic dNTPs
Intercalating Dyes (exp: ethidium bromide and SYBR Green) are small fluorescent molecules that insert in between the base pairs of double stranded DNA. It is non-specific so cannot distinguish. It can detect total DNA quality.
dNTP: are the individual building block that incorporated during PCR amplification
Dye-Labeled Primers
A fluorescent dye molecule is covalently attached to the 5’end of a PCR Primer.
The dye label allows simultaneous detection of multiple loci by assigning different colored dyes to overlapping size ranges.
Covalent attachment: the dye is chemically bonded to the primer during synthesis
Locus - Specific: each primer pair target a specific STR loci.
Advantage and challenges of Dye-labeled multiplex design
Adv: conserves precious forensic DNA sample; Reduces per-sample analysis time and cost; Increases discriminatory power; Standardized kits
Challenges: minimized primer interaction; Balanced amplification across all loci; Spectral overlap; Sensitivity differences between dye channels
STR Genotyping and profiles
Short Tandem Repeats (STR) loci consist of short, repetitive DNA sequences- typically 4-5 bp that very in the number of repeats between individuals
an STR profile is the collection of allele designations across multiple STR loci. Modern forensic kits such as GlobalFiler can amplify 20+ STR loci at same time
Steps in STR genotyping and data interpretation
Data collection
Peat detection
Size calling
Allele Designation
Steps in STR genotyping and data interpretation
Spectral Separation: Multi color fluorescent dye signals are spectrally resolved using a matrix file.
Peak Detection: Peaks above the analytical threshold (about 50RFU) are identified
Peak sizing: An internal size standard converts raw data point into DNA fragment sizes
Allele calling: Sized peaks are compared against the allelic ladder to assign repeat number. Peak falling within ±0.5 bp
Peak Detection and Thresholds
Software distinguish true allelic signal from background noise, artifacts and stutter peaks
Establish interpretation threshold - minimum peak height values that determine a signal is a genuine allele
Internal validation studies. testing their lab instruments, chemistries and protocols to determine the interpretation thresholds.
Analytical threshold- separates out the background noise
Stochastic Threshold
The stochastic threshold is defined as the point above the basic analytical threshold which there is a low probability that the second allele is a truly heterozygous sample has dropped out.
If all observed peaks at an STR locus are above the stochastic threshold, then there is confidence that all amplified alleles are being detected.
Peaks between analytical threshold and the stochastic threshold cannot be certain whether is truly homozygous or heterozygous with allele dropped out. Use mixture interpretation and statistical calculation to solve the issue
Peak Sizing
Converting raw electrophoresis data into meaningful DNA fragment sizes
An internal size standard is co-injected with every sample, providing a set of known size reference fragments
Internal Sizing Standard
Spectral distinction: the internal size standard is labeled with a different colored dye so that it can be spectrally distinguished
Calibration Curve: A calibration curve is established with each sample using the known sizes of the internal size standard. Global Filer Kit uses the GS600-LIZ size standard (from 20-600bp)
Precision Under Variable conditions: more precise sizing even when environmental temperatures fluctuate during a run
From DNA size to Allele Call
The peaks in each sample are converted from DNA size to STR alleles through the use of allelic ladders
Ladder Calibration
Bin windows ± 0.5bp
Software designation each call represents a true allele or an artifact
Allelic Ladder
A critical reference standard in forensic STR typing. It contains alleles of known repeat content and functions like a molecular ruler. Using ladder, analysts can determine the unknown alleles and ascertain the genotype
Allelic ladder must be injected with every run due to variations in run conditions.
Characteristic of Allelic Ladder
Fully resolved: On overlapping or merged peaks
Above the peak detection threshold
Properly sized by the internal size standard
MicrovariantsProperly
STR alleles that contain an incomplete repeat unit- meaning the total number of base pairs does not correspond to an exact multiple of the core repeat motif. Exp: TH01 allele 9.3
Three types of Off-Ladder Alleles
Below Ladder: Alleles that are smaller than the smallest allele in the ladder for the locus. Those contain fewer repeat units than any reference alleles in the kits
Above Ladder: Alleles that are lager than the largest alleles in the ladder
Variant- Alleles that fall between two adjacent ladder alleles- Microvariants with incomplete repeat units
Off-Ladder Alleles resolution
It is merely a flag but does not mean the result is invalid.
Resolution steps: Re-injection
Reamplification: From the extracted DNA to verify the result independently
Sequence analysis: determine exact repeat structure
Off-ladder is less common but can increase the discriminating power of a DNA profile
DNA fragment analysis and genotyping software
GeneMapper ID-X is the industry-standard software. Include: Spectral Separation; Size Calling; Allele Designation; Quality Flagging
Manual intervention in STR Genotype Determinations
Artifact ID: Common artifacts like Stutter Peaks (± 1 repeat), pull-up/ bleed-through and spikes (air bubble)
Off-Ladder Resolution: Peak represent a true microvariant, a rare allele or a sizing anomaly
*** Threshold Evaluation: Peaks near the analytical or stochastic thresholds demand careful judgement.
Mixture Determination: In multi-contributor samples, the analyst must identify the number of contributors, separate major and minor profiles and use statistical frameworks.
Key elements affecting Genotyping Results
Matrix files, internal size standards and allelic ladders
Matrix file (Spectral Calibration)
Matrix file is a critical instrument specific calibration that accounts for the spectral overlap between fluorescent dyes used in STR kits. Without it, result will show pull-up or bleed-through and leading to false allele calls.
Internal size standard
It is a set of DNA fragment of known size that is co-injected with every sample.
Precision in Accurate Genotyping
It is refers to the reproducibility of fragment sizing measurement across multiple injections
Verification study :
Measurement precision typically be <0.15 bp for well maintained machines.
Run-to-run variation: slight differences in polymer age, temperature and voltage can shift fragment migration. The internal size standard compensate for this variability.
Internal instrument comparison ensure that the same allele receives the same designation regardless of where it was typed.
Partial STR Profiles
DNA sample is severely degraded or contains PCR inhibitors only a particle STR profile may be obtained
Degradation affects larger DNA fragments and shorter STR loci amplify well.
Inhibitor cause all profile low result
Mixtures
More than two contributors. Analysts must determine the minimum number of contributors, identify major and minor based on peak height ratios. Combined probability of inclusion (CPI) to evaluate the evidence
Extra Peaks-Is this a true allele or an artifact?
Misidentifying an artifact as a real allele could falsely implicate an innocent person, while dismission a true allele could allow a guilty party free.
Interpretation criteria: Peak Height; Peak Morphology; Position; Reproducibility
Determine True Alleles
Identify Artifacts: Recognize and label known artifact types
Apply Thresholds: Evaluate peaks against analytical, stochastic and stutter thresholds
Assess context: Sample type, degradation and mixture indicatiors
Call genotype
Biology-related Artifact Peaks
Inherent properties of DNA replication and the PCR process itself.
Three most important bio-related artifacts are stutter products, incomplete 3’ adenylation and triallelic patterns
Sutter Products
Sutter products are the most common source of additional peaks in STR electropherograms. They arise from strand slippage during PCR amplification, typically losing one repeat unit
Stutter peaks appear 4 bases shorter (n-4) than the main allele
Characterization- Maximum percent stutter for each locus around 5-15%
Off-Scale Complication
Sutter Filter and thresholds
Universal Sutter Filter apply a single percentage threshold (10-20%) across all loci. Any peak in n-4
Locus - specific thresholds: upper-limit shutter threshold for each locus individually
Software auto removes peak labels from any peaks found within the designated stutter size range.
Incomplete 3’ adenine addition
During STR Amp, Taq Polymerase preferentially adds a single A nucleotide to the 3’ end of newly synthesized PCR product.
Incomplete could occur when excessive amount of DNA template are used in the PCR reaction
Final extension step (60 °C) for 45-60 min promote the adenylation
Triallelic Patterns
Triallelic patterns- the appearance of three alleles at a single STR locus- represent a rare but biological genuine phenomenon
Unlike artifacts, triallelic patterns reflect real genetic events and must be properly recognized to avoid misinterpreting a single source sample as a mixture.
Cause of triallelic patterns
Somatic Mutation: occurs during early embryonic development
Chromosomal Duplication: A localized duplication polies the STR region
Chimerism: Individual may carry cells from two genetically distinct cell lines (Vanishing twin syndrome
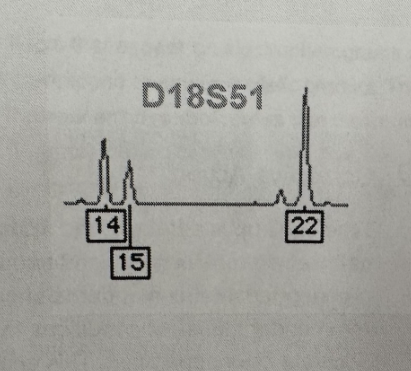
Identify 3-peak patterns
The Sum of the height of two peaks equals the height of the third. This pattern suggests a chromosomal duplication where one chromosome carries two copies of the locus (Exp: D18S51)
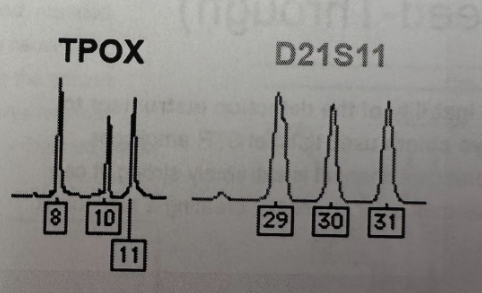
Identify 3-peak patterns
All three peaks are balanced, approximately equal heights. This suggests a trisomy or somatic mutation (Exp: TPOX and D21S11)
Technology related Artifact Peaks
Artifact peaks- signals that arise from technical limitations rather than biological reality.
Common technology related artifacts including pull-up peaks, dye blobs, air bubbles, urea crystals and voltage spikes.