Geography 40 Final Study Concepts
 Call Kai
 Learn
Learn Practice Test
 Spaced Repetition
 Match
Match Flashcards
 Knowt Play
1/73

Earn XP
Description and Tags
Name | Mastery | Learn | Test | Matching | Spaced | Call with Kai |
|---|
No analytics yet
Send a link to your students to track their progress
74 Terms
Explain what interannual variability of climate means, and how ENSO is an example of such variation
Interannual variability of climate is the fluctuation of climate from year to year. These fluctuations occur because of various factors like changes in oceanic and atmospheric patterns, etc.
ENSO is an example of inter annual climate because ENSO is the largest signal to inter annual climate variations as its mechanism create intense changes in the atmosphere and ocean systems.
Explain the characteristic features of an El Nino event - how do they manifest in time and space? How is the Nino3.4 index defined?
El Niño episodes feature an equatorward- shifted, stronger-than-normal jet stream and wetter-than-average conditions across the southern part of the United States, and less storminess and milder-than-average conditions across the North.
The Jet Stream over the North Pacific changes, the jet is more southward, and oriented east-west.
An El Niño condition occurs when surface water in the equatorial Pacific becomes warmer than average and east winds blow weaker than normal.
The Nino 3.4 index is defined by the average sea surface temperature in the region bounded by 5N to 5S, to 150W to 90W.
Explain how El Nino forecasts are used to predict the seasonal climate over various regions of the globe, and why this is useful
El Niño is forecasted through the creation of climate model to predict seasonal climate over various regions of the globe.
This is useful because it helps predict its impact of the environment or environmental factors (fish, local weather, etc.)
Describe and be able to sketch the main atmospheric and ocean features of the equatorial Pacific.
See Tropical Pacific Climate model diagram on lab 6.
The main atmospheric features of the equatorial pacific includes asymmetry between its western and easter ends. On the eastern end, it is colder and dry, while on the western end, the sea surface temperature are warmer and its rainier.
Explain what the Bjerknes feedback is, and how it is responsible for the west-east equatorial asymmetry over the Pacific.
The Bjerknes feedback is the process in which the movement of easterlies cause ocean curents to diverge from one another. This causes equatorial upwelling. This upelling brings cooler waters from the depths of the ocean, shallowing the thermocline in the east with cooler waters, and deepening the waters in the west. This leads to cooler sea surface conditions in the eastern pacific and warmer in the western pacific. Atmospheric convection locates itself in the west under warmer conditions, because of the warmer sea surface there, leading to the Walker circulation.
Explain how the Bjernkes feedback is responsible for the onset of El Nino conditions
The Bjerknes feedback is responsible for the onset of El Niño conditions because the easterlies eventually weaken, leading to warmer waters in the west migrating eastwards. When upwelling occurs, the water brought up from the depths create a warmish sea surface temperature, creating El Niño conditions.
Explain how an El Nino event impacts California
El Niño years are often marked by severe winter storms that bring high levels of precipitation to California's coast. On land, this can translate to increased erosion, flooding, and landslides, all of which can directly affect terrestrial, aquatic, and marine ecosystems.
Be able to explain, broadly speaking, how populated areas in California get its water. Explain the role of rainfall and watersheds, snowpack, and groundwater.
Populated areas in California relied water through aqueducts and other water systems. Our ability to get its water in California comes from the transportation of water across watersheds.
Rainfall and watersheds: Majority of rainfall for California occurs in the winter time, and falls within a watershed (drainage basin), an area within which all water will drain to a single point (ocean, lake, river, etc.)
Snowpack: the precipitation that falls as snow, is stored in a snowpack, and they store water in the winter, and melt during the spring/summer seasons in order to supply rivers during dry seasons.
Groundwater: groundwater is stored under the surface in aquifers, contained areas beneath the surface where water moves through gaps in the sediment. Water is pumped through wells and extracted for households, industrial, and agriculture uses
What was the 2011-2015 California drought, and what caused it? Know what the atmospheric circulation changes are over the North Pacific that leads to a dry year over CA.
The 2011-2015 California Drought was a large drought that occurred in California, caused by several consecutive years of rainfall.
Dry years over California are caused by storm tracks steering northwards because of a persistent high pressure ridge in the northeastern pacific.
Explain how we know CA underwent megadroughts in the past
We know California underwent megadrought because of the tree ring records of Californias hydro climate extending back several hundred years.
Explain how global warming affects snowpack in the future.
Warmer temperatures also reduce snow pack in the sierras. with increase in temperatures due to global warming, the snow packs melt, less snow pack, less water storage. More water runoffs immediately after rainfall. Snow melt occurs earlier in the season, leaving less for the summer
Explain the conditions that lead to wildfires over California, in particular the meteorological conditions tied to Santa Ana and Diablo winds.
Increased Drought: Persisted dry conditions dry out vegetation as fuel for wildfires, and depletes snow packs and glaciers, wetter years surge plan growth, increasing amount of dry vegetation in dryer seasons, leading to increase in wildfires.
Southern California has a seasonal wind pattern called the Santa Ana winds, which are hot dry winds that reach up to 60+ miles an hour, that usually occur during the fall.
Santa Ana winds and Diablo winds are winds that are originally cooler dry air that come from high elevation basins in western northern America. However, as they move from these places of high pressure, to low pressure atmosphere of the pacific coast, the air compresses as it sinks, warming and reducing relative humidity.
Explain what an atmospheric river is, the role it plays in bringing rainfall over the western US, and in causing flood conditions.
An atmospheric river is a flowing column of condensed water vapor in the atmosphere responsible for producing significant levels of rain in snow, especially in the western united states. When atmospheric rivers rise over mouton ranges, water vapor cools and precipitation occurs.
Each winter California gets around 5-7 atmospheric rivers every winter and they contribute to 30-50% of rainfall, and most floods are caused by atmospheric rivers. More powerful atmospheric rivers can cause floods, create flood conditions.
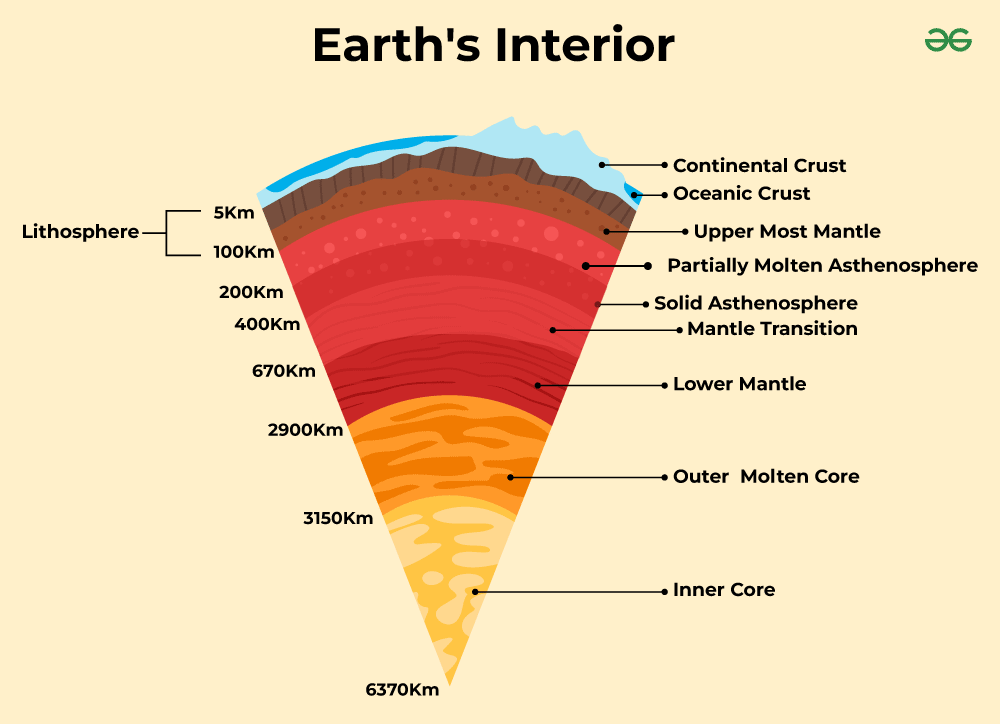
Know the basics of the structure of the lithosphere – crust, mantle, core
Crust: outer skin occupies < 1% of the earth's volume. Thickness varies, especially with oceanic vs continental crusts
Mantle: middle section, 83% of the earth's volume. More flexible than the crust
Core: center portion, ~16% of earth's volume (but 33% of its mass - very dense)
Outer core is liquid, inner core is solid
Lithosphere: rigid upper portion of the earth, containing the crust and uppermost mantle
Asthenosphere: upper mantle; much more viscous (it's like plastic). This is what allows the lithosphere to move under plate tectonics
Know the basics of faults, and describe the 3 types of faults.
The crust is not uniform; has its breaks and fissures. These breaks are called fault. Parts of the crust can move along these fault lines, which can cause earthquakes. Fault movements: not all faults behave the same way. Stress on either side of the fault lines forces the fault to move in different ways.This movement can happen slowly (as creep) or in a short period of time (as an earthquake)
Normal fault: a dip slip fault in which the block above has moved downward relative to the block below - pulled by tensile stress
Thrust fault: the block of earth has moved up relative to the other wall - driven by compression
Lateral slip fault: the lateral movement of two blocks together (slip against one another both right and left)
Know what the Hayward fault is how it relates to the San Andreas Fault system
The Hayward fault is a high lateral strike slip geological fault zone, and it relates to the San. Andreas fault system because the Hayward fault is an offshoot of the San Andreas fault.
Explain the mechanics of an earthquake - what the ‘elastic rebound’ model is, and what creeping motions are.
Earthquakes: sudden release of energy between two blocks of rocks, creating a shaking and/or vibration of the ground.
Epicenter: position on the surface of the earth above the focus of the movement
Moving rock blocks along a fault push into each other ( a force), but friction also impacts the block (another force). Friction holds the blocks in place, causing them to deform or bend elastically. Once the force of the moving blocks is larger than the friction force holding them in place, the fault “ruptures” along the fault, causing an earthquake. Slip - distance moved. An example of elastic rebounding causing episodic movement (or earthquakes along a fault)
This is sometimes called earthquake cycle
Sometimes the shallow parts of faults move past each other slowly, without causing a seismic event. This is called creep.
Continuous creep: continuous motion along the fault up to 25mm per year
Creep event: sudden, slow movement, lasting up to a few hours at a time up to a few cm movement. Creep events are separated by long periods of continuous creep
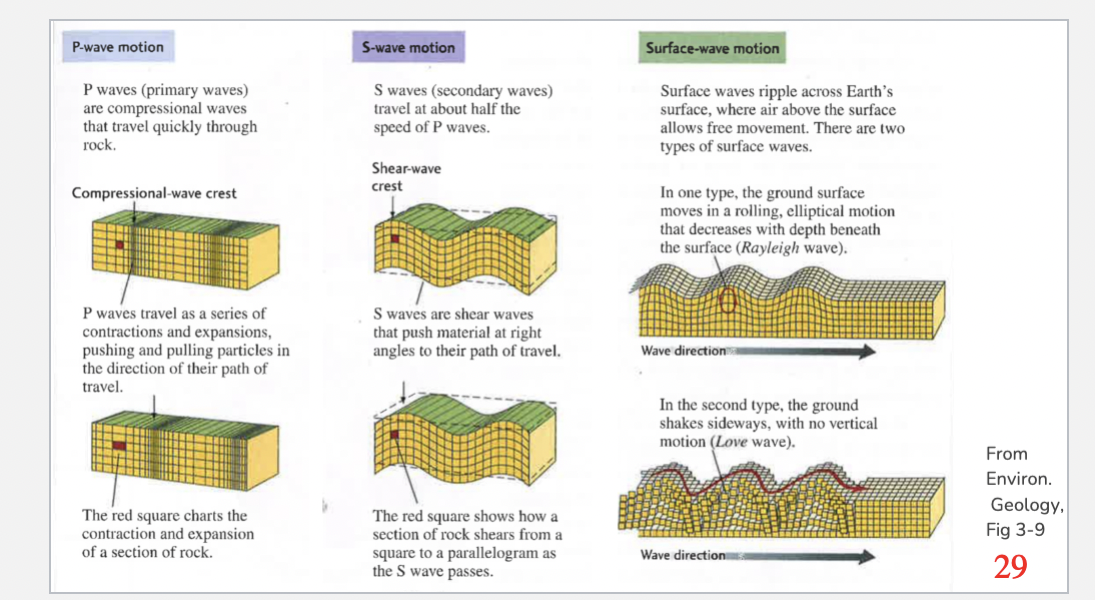
Explain the types of seismic waves and how they propagate
Primary waves: compressional waves; solids and fluids can transmit p waves; moves through the interior of the earth and arrives sooner
Secondary waves: shear waves; only solids can transmit S waves; moves through the interior of the earth and arrives sooner
Surface waves: waves at the surface of the earth - includes Rayleigh waves (move in an up and down elliptical like motion) and Love waves (move horizontally from side to side, perpendicular to the wave directions; moves along the surface and arrives later
Explain how the position of earthquakes can be inferred from triangulation
Seismographs are sensitive to and record the motion of the earth
These machines can detect either vertical movement or horizontal
The amount of motion detected can be used to calculate magnitude
Networks of seismographs are set up globally, and help us pinpoint the location and strength of earthquakes through triangulation
Seismometers: measures the time it takes for S and P waves to arrive at a seismograph. Based on that time, you can draw a circle around the seismometer of where the epicenter could be. If you have at least 3 seismometers, the epicenter will be located where those 3 circles intersect
Explain how we infer the inner structure of the earth using seismic waves
Seismic waves also teach us about the Earth's interior
P waves move through liquid and solid; S waves only move through solids
Using a global network of seismographs, we can measure differences in P and S waves learn about interior structures we would bever be able to observe otherwise
Know what liquefaction of soils is and why it is a dangerous hazard for earthquakes
When solid is shaken, it sometimes act like a liquid
This movement can swallow cars and over objects, tips buildings over, causes structures to fail
This is especially common in the Bay Area in places with shallow infill (where solid and debris is piled into water to create land
Explain the stages of scientific discovery, and how the development of the science of continental drift fits with these stages
Speculation: an idea based on some preliminary evidence. Initial starting point of any scientific discovery
Hypothesis: a formal proposal for an explanation. It has to be testable
Theory: a hypothesis that has matured (and survived) through rigorous scientific testing over time. It includes formal mechanism that is able to explain key evidences
(ask about this in review session)
Explain the idea of continental drift and how Wegener drew various lines of evidence to support it
The idea that continets were once part of a giant land mass, but eventually drifted apart.
Wegener's Hypothesis: “The``Origins of the Continents and Oceans”
Plausible and compelling evidence including:
Similar fossils and rock formations along the coasts of continents, found in identical rock layers
Coal deposits (formed in warm areas) found around the globe dated to a similar time period
Tropical plant fossils found in the arctic
Some holes in his theory and other setbacks:
Did not provide a single conclusive explanation (or mechanism) for driving force behind continents moving
Could’nt disprove dominant theory at the time (there were land bridges below ocean surface)
Was not a geologist by training and wasn't taken seriously
Some miscalculations in his evidence
Explain how the discovery of sea floor spreading was instrumental in providing an explantion in support of Plate tectonics
The process of recycling oceanic crust, to form new crust, was instrumental in providing an explanation fro the support of plate tectonics because it showed that new oceanic crust was being formed and then spread out by plate boundaries.
Explain how magnetism is used to date the sea floor and infer sea-floor spreading
Earth is surrounded by a field of magnetism
This is most likely caused by convection in the liquid outer core, which generates electric currents that create the magnetic field
Particles in magma will orient themselves along the direction of the magnetic field when they cool past the curie point (570 C), creating a record of the magnetic field when the rock was formed
We can use this info to record rock ages in the sea floor
Explain how we are able to infer past positions of continents
The oldest part of the seafloor is 200 million years old
We can calculate the expansion of the sea floor based on those records and recreate the drift of the continents
We can also extrapolate beyond 200 MYA to estimate what the continents looked like pre-pangea
Explain the types of plate boundaries and what characterizes each
The earth's crust is broken into 7 major tectonics plates, and other smaller plates
Plates move due to convection in the mantle, and interact in different ways:
Divergent Boundaries (spreading)
since divergent boundaries create pulling forces, most divergent boundaries have normal fault lines and create “rift valleys”
Convergent boundaries (colliding and subducting)
compression plays as role in this type of boundary, since it pushes forces together, mountains, volcanoes and earthquakes occur
these boundaries can be:
ocean-ocean: typically happens underwater , can form volcano arcs, island chains, etc.
continetal-contiental: Not dense enough to subduct, so they collide and crinkle instead; creates mountain ranges like the Himalayas
ocean-continental: denser and subduct under the continental plate, causes earthquakes, mountain ranges near coasts, and trenches
Transform boundaries (lateral sliding)
plates move laterally against each other without creating or destroying crust; doesn’t form volcanoes or mountains, but does create a lot of earthquakes, found perpendicular to mid ocean ridges
Explain what hotspots are and how they formed the Hawaii island chain
Volcanic points on earth that are independent of plate boundaries, and oceanic plates moving along these hotspots give rise to island chains, which is how the hawii islands are formed.
Mid Ocean Ridges
Long chains of submarine mountain ranges in the middles of the ocean. rift runs in the middle of the ridges
Sea-floor spreading
mechanisms that build mid ocean ridges and drives crustal movement. New sea floor extruded along mid-ocean ridges due to upwelling magma from mantle convection. New sea floor spreads laterally and symmetrically to plate boundaries. As it could, it contracts and subsides
Why do the plates move?
mantle convection: molten rocks in mantle, heated by the core and radioactive decay, form convection cells and drag plates
Gravitational forces: old dense oceanic crust drags plates and upper mantles.
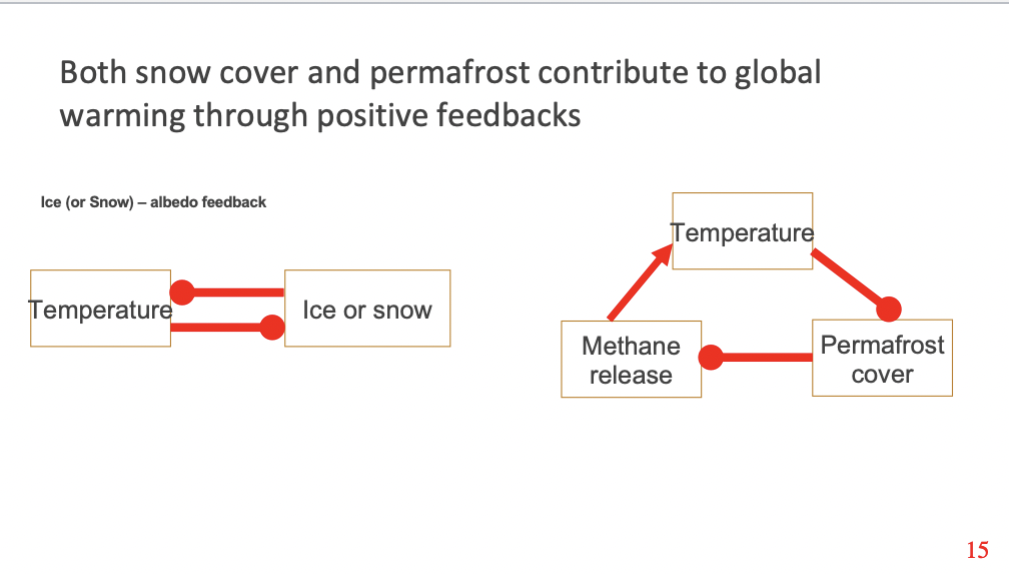
Understand what snow and permafrost is, and how they contribute to earth’s feedback to global temperature
A thick subsurface layer of soil that remains frozen throughout the year
precipitation that freezes.
Permafrost and snow contribute to earths feedback to global temperatures through positive feedback because as temperature increases snow and ice decreases, and as snow an ice increase, temperature decreases (two negative = +)
As temperature decreases, permafrost cover increases, and as permafrost cover increases, methane release decreases, and as methane release increases, global temperatures increase (negative, negative, positive = +)
Understand what glaciers are and the concept of mass balance of a glacier, accumulation and ablation regions, and how that relates to glacier flow.
Glaciers are rivers of ice. An ice field is a large area of interconnected glaciers, and they are usually found in areas of high altitude, or high elevation areas
the accounting of movement or transformation of mass in a system is what characterizes mass balance
The gain in glacier mass by snowfall is the accumulation area of the glacier
The loss of mass in a glacier bay melting of snow, freezing rain, etc. is the ablation area of a glacier
the altitude line separating the accumulation area and the ablation area is the equilibrium line
Glacier flow is driven by gravity (always fastest at the center near the top of the glacier), so when water melts, gravitational pull can cause disequilibrium in the different regions of the glacier
Describe what ice sheets are and how they work.
Continental sized glaciers; dome-shaped glacier> 50,000m
they are the accumualtion of old snow, that causes the ice/snow under it to spread to melt or make icebergs
Understand what ice streams are and the role they play in ice sheets, and how they respond to warming.
The part of glacier ice that is flowing faster than the surrounding ice; they account for most of the ice leaving the glacier or ice sheet
with warming, they also accelerate with ice melt, leading to positive feedback
Understand what ice shelves are and the buttressing role they play in ice sheets, and how losing the buttressing can lead to ice sheet instability.
The floating part of an ice sheet is called an ice shelf
Ice flows from the ice sheet to the ice shelf, where it then calves to form ice bergs
Grounding lines - where the transition from a grounded ice sheet to a floating ice shelf occurs
Melting occurs underneath an ice shelf because of the warmer ocean water
Floating extensions called “ice shelves” - ice flows over water for a while before breaking off to make bergs;
As the large plates of ice spread over the ocean, many shelves come up against coastal features such as islands, peninsulas, or submerged mountains, creating a resisting pressure that slows their movement toward the ocean. If an ice shelf collapses, this backpressure disappears. The brakes on glacier flow are released., this is all important in controlling sea level rise
Be able to describe the characteristics of glacial-interglacial cycles, including where the Earth was glaciated during glacial times, the time evolution of glacial-interglacial cycles, and how the atmospheric CO2 changed.
Millions of years ago, the Pleistocene epoch evolved from gradual cooling of the earth throughout the Cenozoic era, starting around 50 million years ago
the Pleistocene epoch started with the onset of large scale glaciation in the northern hemisphere
within the Pleistocene epoch, there are times of more ice and less ice: which are considered glacial-interglacial cycles
During glacial periods, CO2 is decreased, however in the warmer interglacial periods, CO2 is greater
(ask about this in review)
Explain how we know where ice sheets formed on Earth, based on geologic evidence
glacial striation and glacial erratics tell us where ice sheets formed on earth, because of the gouging marks left by passing glaciers on rock.
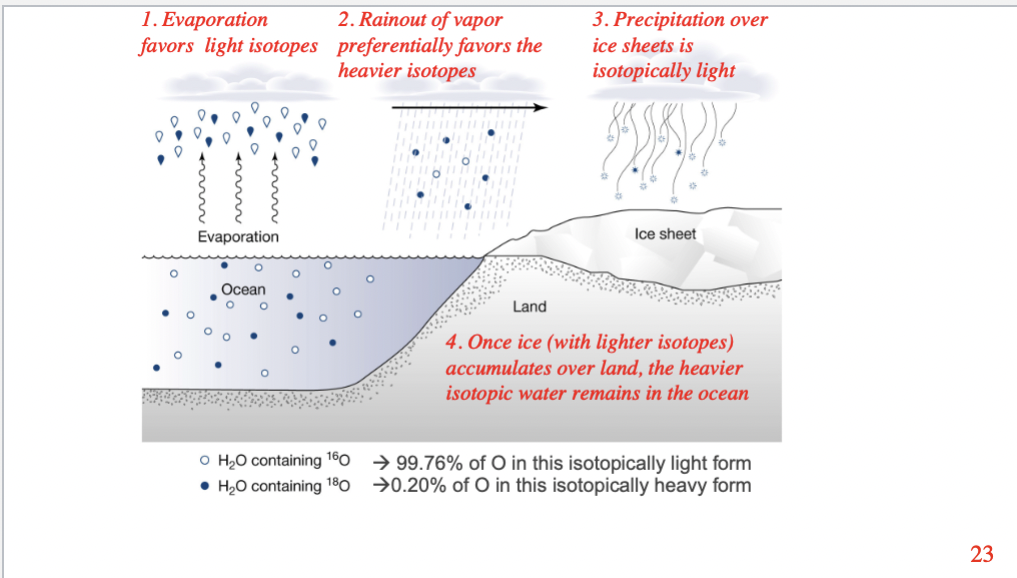
Understand how oxygen isotope measurements from foraminifera in deep ocean sediments tell us about past glaciations – in particular, understand why the ocean is relatively ‘heavier’ isotopically when there is ice on land
Benthic formaninfera are single celled organisms that live at the sea floor, and they grow shells that contain calcium carbonate (CaCO3) formed from ocean water. When they die, they are buried in the ocean for, and gradually they become embedded in sea floor sediment. We can use analysis from the oxygen atoms in CaCO3, to reveal the climate conditions at the time the form lived. We can measure the weight / mount of oxygen isotopes are made up of the sheets during glacial-interglacial periods (lighter during interglacial, heavier during glacial). Shells oxygen isotopic composition is also based on temperature of the water, the cooler the water, the heavier the O18
The ocean is heavier isotopically when there is ice on land because of the characteristics of the different oxygen isotopes, specifically O16 and O18, since O18 is considered isotopically heavier than O16, its described as such, especially in water. Because atmospheric occurrences such as evaporation amor lighter isotopes, this leads the rainout (precipitation) carrying the heavier isotopes (O18), back into the ocean, so by the time rainout appears on land, lighter isotopes fall as snow and ice, on land. This creates a difference is in the isotopic makeup of land and ocean, ocean being heavier isotonically (more O18) and land with ice being isotonically lighter (O16)
Understand physically the 3 components of Milankovitch cycles: eccentricity, obliquity, precession
The Milankovitch hypothesis/ cycle = the changes to the earths insolation overtime as a result of changes to earths orbit was the ultimate cause of glacial-interglacial cycles, and these changes to earth cycle include
Eccentricity
the earths orbit is elliptical and eccentricity measures the degree earths orbit is elliptical
includes perihelion, which is when the earth is closest to the sun, occurs during northern hemisphere winters
aphelion, which is when the earth is farthest from the sun, opposite of perihelion, and occurs in Northern hemisphere summers
varies form 0-0.6 over a 100,000 year cycles
impacts seasonal sunlight, which impacts climate
Obliquity
change in the title of earths rotational axis
obliquity varies from over a 41,000 year cycle
at higher obliquity, seasonal contrast in insolation is greater, ie we would have warmer summers and colder winters
earths title varies from 22.1-24.5
Precession
precession of the spin axis, the “wobble of the earth”
changes over 25,700 year cycle
and the precession of the perihelion, distance of earth from the sun
both effects combined equal a year cycle of around 19,000-23,000
the net effect of precession (combining the precession of the spin axis with the precession of perihelion) is to alter the position of perihelion relative to the solstice each year
our water solstice takes place in NH winter, milder summers and winters
half a precession cycle ago (11,000 years), the perihelion used to be during the NH summers, making fro hotter summers and less mild winters
Be able to explain the Milankovitch hypothesis, specifically what sort of insolation favors ice sheet growth
Milankovitch hypothesis = The Milankovitch hypothesis/ cycle = the changes to the earths insolation overtime as a result of changes to earths orbit was the ultimate cause of glacial-interglacial cycles.
He postulated that a critical factor for Northern Hemisphere continental glaciation is the amount of summertime isolation at high northern latitudes. You want low NH summer insolation in order to grow ice sheets - low insolation during the summer would allow snowpack to survive
On the other hand, high NH summer insolation leads to warmer summers and less snow persisting through summer. If there are ice sheets, high insolation can destabilize them.
Low obliquity = low NH summer insolation
High obliquity = high NH summer insolation
Explain the apparent shortcoming of the Milankovitch hypothesis when compared to the oxygen isotope record of glaciations (mismatch at the 100,000 year eccentricity band)
When compared to oxygen isotope record of glaicaitons, the MIlankovitch hypothesis seems to explain and accurately compare the year long cycles of glaciation with isotopic oxygen makeup, specially for precession and obliquity, but when it comes to the eccentricity band, the oxygen isotopic makeup and the cycle are unmatched. The problem with the hypothesis remains that eccentricity may be an outdated idea that triggers glaciation, and that these glaciation cycles are driven by precession and obliquity (that trigger deglaciation)
Explain in brief recent developments in the Milankovitch hypothesis, including how obliquity and precession are thought to drive glacial cycles (through ‘skipping’ peaks)
Glacial terminations are tied to maximum obliquity in the 100,00 year cycle from multiples of 41,000 cycles skipping 2 or 3 beats
However, more recent evidence seems to argue against the Huybers and Wunsch
interpretation, in favor of precession. More recent evidence shows that deglaciation
occurs during peak NH summer insolation (i.e. timed to precession), but that it ‘skips’
every 4 or 5 precessional cycles.
Huybers and Wunch 2005 argued that terminations are timed to maximum obliquity i.e. 100,000 year cycles come from multiples of
41,000 cycles skipping 2 or 3 beats
Be able to explain the story behind the ‘Younger Dryas event’: what was the observation, and what we think happened to the thermohaline circulation during that time that brought about these cold conditions; and also why we think it might be relevant for future global warming
An example of abrupt climate change, the Younger Dryas event was the abrupt cooling of the earth as a result of ocean circulation changes.
It occurred during the deglaciation phase of earth
The leading hypothesis as to why this event occurred is the belief that through the introduction of glacial melt water, there was a disruption in the oceanic thermohaline circulation
Slowdown caused by sudden introduction of meltwater from glacial lake Aggisaz through the Great Lakes system and into the St Lawrence
River system
Current climate model simulations of the future
predict a gradual slowdown of the thermohaline
circulation in the future, because of the direct effect of increased temperature and rainfall on the high latitude North Atlantic surface ocean, and also increased melt from Greenland.
We’re starting to see evidence of the slowdown
already occurring. Current presence of a “cold blob” south of Greenland could be slowing circulation and causing other interruptions to weather patterns
Explain the Thermohaline circulation
A surface-to-deep ocean circulation driven by ocean
water density changes as a result of either
temperature or salinity changes (hence:
thermohaline)
• Deep water is formed when surface waters are
made denser (by cooling and/or increasing salinity)
and which then sink
• The sinking region for the Atlantic thermohaline
circulation is in the high latitude North Atlantic
• The water upwells in the other ocean basins, and is
returned to the North Atlantic by surface
circulations
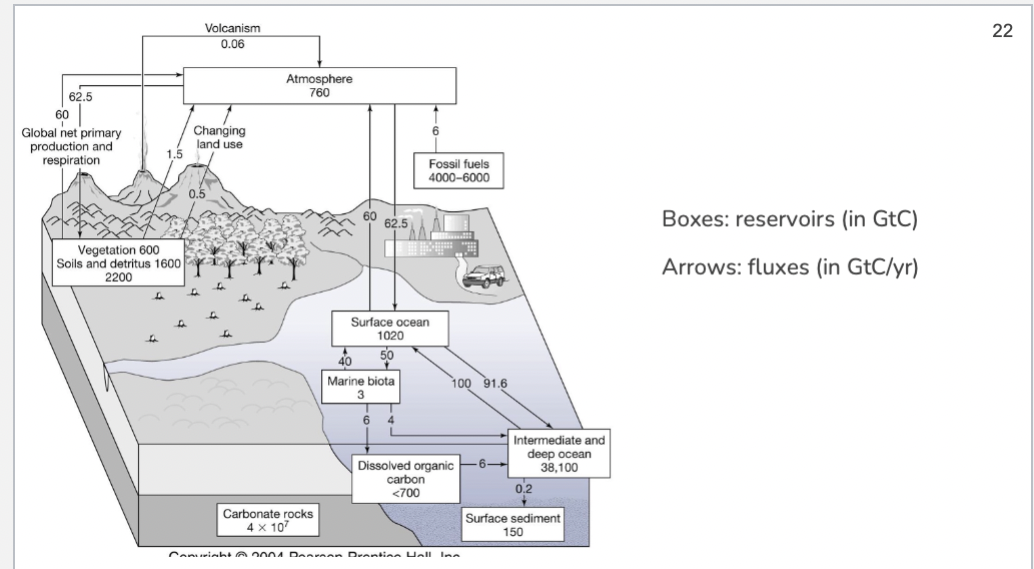
Explain in general what the carbon cycle is. Include in your explanation the concepts of ‘reservoirs’ and ‘fluxes’
Carbon exchanged between earth systems: the biosphere, atmosphere, hydrosphere, and lithosphere
This cycle regulates the level of carbon in each component of earth (especially re: levels of carbon dioxide in the atmosphere)
Carbon reservoirs are “pools” of carbon, typically defined by type and location of carbon. Quantified in terms of mass or number of moles.
Gigaton (Gt): most common unit for measuring carbon (ie GtC.) 10^9 metric tons, or a billion metric tons. [1 metric ton = 1000 kg = 1000g]
Note: we measure carbon reservoir size by the mass of carbon in the pool, usually in gigatons of carbon - GtC.
Moles: 6.023 x 10^23 atoms, based on Avagadros #. ‘Molar mass: mass (in g) per mole of a given atom. Molar mass of carbon: ~ 12g/mole
Carbon fluxes
Fluxes: Carbon is moved from one reservoir to another through chemical/physical processes. Eg.
Photosynthesis
Respiration
Formation of calcium carbonate shells
Weathering reactions (silicate and carbonate weathering)
Reactions in water
Explain what the 5 major reservoirs of carbon are in the Earth system, and the difference between short and long-term carbon cycles. What is the largest short-term reservoir?
Lithosphere (crust): Fossil fuels, sedimentary rock (limestone, dolomite, chalk) - - 50,000,000-100,000,000 GTC (only 4,700 GtC as fossil fuels)
Oceans: (dissolved C)2, CaCO3, shells, CO3^2-, and HCO3-)39,000 GtC
Soil: organic - - 1,600 GtC
Atmosphere: Co2, CH4, CO - - 578 GtC in 1700,766 GtC in 1999
Biosphere: All living and dead organisms not yet converted to soil and organic matter - - 540-610 GtC
The difference between short term and long term carbon cycles, is the time scale in which it takes for the cycles to occur.
Longterm carbon cycles include the Lithosphere *thousands to millions of years), and short term carbon cycles are the ocean, oil, atmosphere, etc. (seconds to centuries)
The largest short term carbon reservoir is the ocean
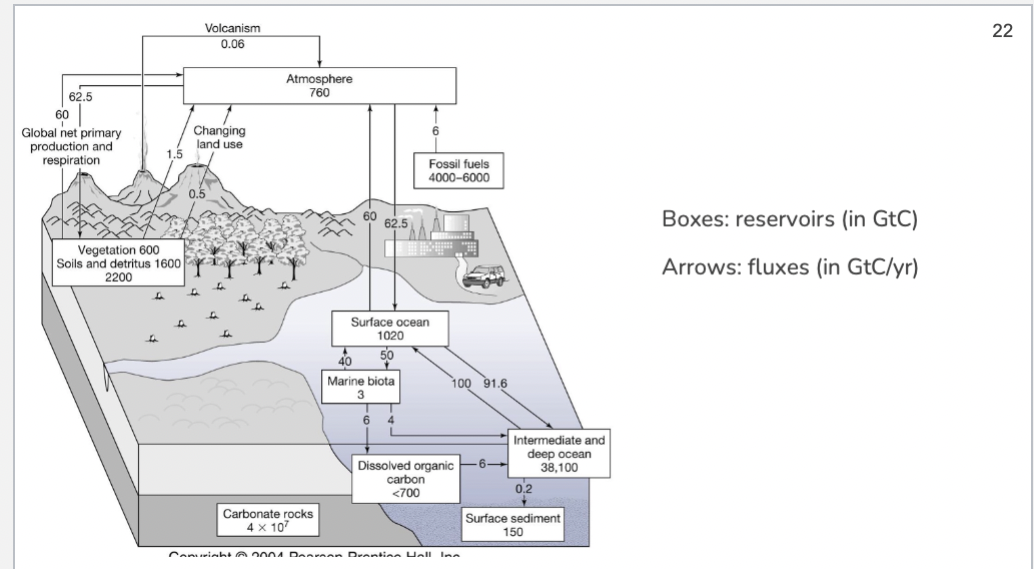
Explain what the marine and terrestrial organic carbon cycles are and be able to interpret the box model of the carbon cycle shown in class.
Terrestrial organic carbon cycle:
Photosynthesis- primary production
2. Consumers feeding
3. Respiration of consumers and producers
4. Burial in organic rich soils/sediments
5. Aerobic respiration from soil/sediments
6. Anaerobic respiration from soil/sediments: makes CH 4
7. Oxidation of CH 4 (like low temp flame)
Long term
8. Incorporation into sedimentary rocks
9. Volcanism
10. Uplift and exposure
Marine organic carbon cycle
Ocean photosynthesis
2. Ocean respiration
3. Dead organic matter settles to ocean floor and decomposed
4. Dead organic matter settles to deep ocean and decomposed
(“Biological pump”)
5. Thermohaline circulation brings carbon from deep ocean to surface
ocean
Long term
6. Incorporation into ocean sedimentary rocks
Make sure you know how to interpret the box model
Explain what the biological pump is, and how it relates to the organic carbon cycle?
The biological pump is the set of processes by which inorganic carbon (e.g., carbon dioxide) is fixed into organic matter via photosynthesis and then sequestered away from the atmosphere generally by transport into the deep ocean.
Photosynthesis takes up Co2 in shallow water, producing plant matter
Other organism (zooplankton, fish, etc.) consume this plant matter and cycle through the food web
eventually , organism die and settle towards the bottom of the ocean where they decompose, creating carbon rich deep water
Cabron/other nutrients are stored in deep water reservoirs until they return to the surface through thermohaline circulation and upwelling.
The transformation of carbon dioxide and nutrients into organic carbon, its sinking into the in the deep ocean, and its decomposition at depth, is known as the biological carbon pump.
Explain what happens to the carbon once CO2 is dissolved in seawater, including the reactions that take place to convert the carbon in CO2 to carbon in bicarbonates.
Water and carbon dioxide combine to form carbonic acid (H2CO3), a weak acid that breaks (or “dissociates”) into hydrogen ions (H+) and bicarbonate ions (HCO3-).
Explain what acidity is, and how acidity of seawater drives bicarbonate to carbonate reactions and vice versa
Acidity: higher concentration of H+ ions in an aqueous solution
Opposite is basity (which is low in H+ ions concentration)
Acidity is measured on a logarithmic scale called the pH scale. A decrease in 1 on the pH scale= 10x increase in H+ ion concentration
When CO2 dissolves in seawater, it makes it more acidic becasue of the addition of H+ ions.
When carbon dioxide dissolves in seawater, most of it becomes bicarbonate ions and hydrogen ions. This increase in hydrogen ions is what decreases the pH. In addition, some of the hydrogen combines with carbonate to form more bicarbonate, decreasing the concentration of carbonate in seawater.
If pH rises (low [H+]), bicarbonate may dissociate into carbonate, and release more H+ ions, thus lowering pH. Conversely, if pH gets too low (high [H+]), bicarbonate and carbonate may incorporate some of those H+ ions and produce bicarbonate, carbonic acid, or CO2 to remove H+ ions and raise the pH.
Explain ocean acidification – what is it, where does it come from, what are the potential impacts
Ocean acidification is the increased acidification of the entire world ocean as a consequence to the increase in atmospheric carbon dioxide concentrations
Dissovled CO2 + water - carbonic acid
Carbonic acid dissociates to release H+ ions into solution (this is what acids do)
As atmospheric CO2 increase, the ocean has become more acidic across the globe
Carbonic acid dissociates to release more H+ ions, which increases acidity
Explain how much of the carbon dioxide emitted by humans stay in the atmosphere, and how much is taken up by land and ocean uptake. What is potentially driving the increased uptake by the land and ocean in recent decades?
The amount of carbon dioxide emitted by humans that is taken by the atmosphere is around 50%, however, the remaining 50% is equally split (25%),between the land and the ocean. The increased uptake by the land and ocean is due to reforestation in the northern hemisphere, increase in phtosytheiss sue to higher concentrations of atmospheric Co2 and nitrogen fertilization, as well as dissolution in the ocean, and dissolution of carbonates hat dissolves from the carbonate sediments on the sea floor
Be able to compute the change in atmospheric ppm from GtC of emission
Find Lab 10 for practice problems
Explain what Carbon Dioxide Removal (CDR) is – name a few types, and explain how they work as related to the organic and inorganic carbon cycles introduced above
Carbon capture, Utilization, and Storage (CCUS) are
efforts to ‘scrub’ CO 2 from the atmosphere, or to remove
carbon from fossil fuel burning that would otherwise be
emitted, and either store it in a way that would keep it
from being introduced back into the atmosphere, or use it
in applications.
An example: carbon scrubbing through amine application, which is a solvent that captures Co2 from flue gas
An example: Air scrubbers that directly capture CO2 from the atmosphere
Explain generally the argument presented by climate scientists that leads us to conclude that the Earth is warming, and it is due to human emissions of CO2?
Atmospheric CO2 concentrations are rising from human activities
Increased CO2 concentrations causes Earth to warm (greenhouse
effect). Earth is indeed warming, from many, many lines of observational evidence
There are other potential explanations of warming, but none can readily and convincingly account for the warming in its entirety. Scientists agree, because of the comprehensive history of scientific
work done leading to this conclusion.
What is the enhanced greenhouse effect?
The Enhanced Greenhouse Effect is the increasing concentrations of natural greenhouse gases caused by human activities which lead to an increasing amount of the global temperature.
The increased CO2 enhances the natural greenhouse effect, causing warming
Explain what climate sensitivity is, and what feedbacks contributes to it
Climate sensitivity - defined as the global temperature change due to a doubling of CO2
the feedback the contributes to this is Water vapor + lapse rate (additional ~50% or ~0.6K)
• Surface albedo feedback (additional ~10% or ~0.1K)
• The rest (including the uncertainty range) comes from positive
cloud feedbacks
Explain the urban heat island effect and how that might complicate the attribution of observed global warming. How did climate scientists conclude that the urban heat island effect is not responsible for global warming?
"Urban heat islands" occur when cities replace natural land cover with dense concentrations of pavement, buildings, and other surfaces that absorb and retain heat.
Urban environments are warmer becasue there isn't any water for evaporation becasue of the lack of water, and presence of asphalt
Urban heat island: developed areas are warmer that vegetated areas, especially at night
Can be as extreme as +5 degrees celsius
The urban heat island effect is a well known physical effect where built-up areas are hotter than rural areas; this effect is particularly pronounced at night
A vegetated landscape warms up less than a paved landscape, becasue evapotranspiration helps cool the vegetated surface
The effect of urban heat islands on
global-scale temperatures is easily testable, by leaving out data in
or near cities; it has been shown to be negligible
Explain why natural variability complicates our ability to detect climate change? Explain the ways that climate scientists use to overcome this hurdle in detecting climate change
natural variability complicates our ability to detect climate change because natural variability is intrinsic to the climate system, coming without any chances to radiative forcing, eg. weather, el nino, natural changes to the ocean circulation.
This can make it hard to detect this climatic changes being consequences of behavior or just natural patterns in our climate.
climate scientists are counteracting this by showing that
many different observations are consistent with the
interpretation of global warming
2. Extend observations back in time to show how exceptional the climate
changes since preindustrial has been
3. Model the climate changes since preindustrial, and attribute the changes
to specific causes
This is called detection and attribution of climate change.
Apart from temperature, what other aspects of the climate system would you expect to change under global warming, and why?
Rising sea levels because of the melting of glacier sea ice sheets
Disruption of amine life bio habitats and food chains because of ocean acidification and its impact on marine organisms, etc.
Explain how climate scientists attribute climate change to human emissions of CO2 and other greenhouse gases, in particular the use of a climate model
Use climate models with known climate forcings to
simulate the climate over the 20th century
These model by and large simulate the behavior of
global mean temperature very well
If the anthropogenic climate forcings are left out, the climate models cannot reproduce the warming trend over the last 50 or so years
Therefore, the recent climate change is attributed to anthropogenic forcings.
What are the considerations going into creating a future climate scenario? What are the 3 major scenario types?
The considerations going to creating future climate scenarios are increase in temperature, increase in ocean acidity, higher sea levels, and changes in precipitation patterns.
The 3 major scenario types are:
RCP2.6 - mitigation scenario
•RCP4.5 and 6 – stabilization scenarios
•RCP8.5 - very high greenhouse gas emissions
What is a climate model? How are climate models used to make projections based on the future climate scenarios? What sort of inputs do the climate model need to do this?
a computer simulation of the Earth's climate system, including the atmosphere, ocean, land and ice. They can be used to recreate the past climate or predict the future climate.
Climate projections are made through the input of scenarios (RCP) like spatial land use data, GHG emission, and non-GHG climate forcing.
What do the projections for 21st century temperature look like, both in time and space? Approximately how much warming will there be in the global mean?
Increases in average global temperatures are expected to be within the range of 0.5°F to 8.6°F by 2100, with a likely increase of at least 2.7°F for all scenarios except the one representing the most aggressive mitigation of greenhouse gas emissions.
What do projections for 21st century rainfall look like, and what are the ‘rules of thumb’ for rainfall changes in the future?
Rainfall (depends on latitude)
• Midlatitudes and Polar regions: Wetter.
Midlatitude storms tend to shift towards the
polar latitudes
• Tropics and subtropics: “Dry regions gets drier,
wet regions gets wetter” – i.e. regions with
marginal rainfall may get further negatively
impacted
Explain sea level rise – how much has the sea level risen by, and how much will it rise in the future? What are the contributions to the current sea level rise (thermal expansion, melting ice, groundwater)?
Sea level rise, is the rise in average sea level due to external environmental factors and more recently, humans contribution to warming of the climate. This causes melting of glacial ice, etc.
The sea has risen by over the
period 1901 to 2010, global mean sea level rose by 0.19 [0.17 to 0.21] m/ 2.8mm/yr from 1993 to 2010)
The contributes for the current rise in sea level is as follows:
Around half from ice melt, 40% from ocean thermal
expansion, and 10% from land storage
• Ocean thermal expansion, 38.7% [1.1 mm/yr]
• Mountain glaciers and ice caps, 26.8% [0.76 mm/yr]
• Greenland ice sheet, 11.6% [0.33 mm/yr]
• Antarctic ice sheet, 9.5% [0.27 mm/yr]
• Land water storage, 13.3% [0.38 mm/yr]
(source: IPCC AR5)
Explain why sea level will continue to rise in the future, even if we stabilize CO2 concentrations?
It will continue to rise, even id we stabilize CO2 in the future because of two reasons why:
1. Deep ocean warming (hundreds to thousands of
years)
2. Continual melting of ice sheets (thousands to hundred
of thousands of years)
Can the ice sheet collapse?
• Greenland = 7m sea level rise
• West Antarctica = 4-5m sea level rise
Explain how Broecker’s ‘carbon pie’ argument works, and how it severely constrains how much more CO2 we can emit in the future
His argument poses the hypothetical of how much more carbon dioxide can we emit (the
“carbon pie”) yet keep atmospheric CO2 below a
certain upper limit?
This contains the amount of Co2 we are allowed to emit because we only have 720 GTc that we are allowed to emit given the math, therefore, we only have 25 years to be able to stay where were at with emissions, without going above the upper limit.
What are the arguments for keeping global warming below 1.5C, as opposed to 2C which is the limit set by the Paris accord?
Sea ice will remain during most summers
In 2 degrees cel - - ice-free summers are 10 times more likely
More frequent mass mortalities of corals under 1.5 degrees cel
Coral reefs mostly disappear above 2 degrees cel
14% of world population experiences heat waves under 1.5 degrees cel
37% of world population experiences heat wave above 2 degrees cel
Loss of species is also impacted above 2 degrees cel and below 1.5 degree cel
With current policies in place, the world will warm by ~2.8 C. Reductions of ~45% are needed to attain 1.5C.
What are the constraints on future emissions if we want to limit global warming to 1.5C? What does this require us to do with respect to energy sources in the future?
No more coal, and much, much more
renewables, We need to sequester carbon from the atmosphere, Effects of CO2 has to be priced in, carbon tax, etc.
Be able to explain the 4 pillars for reducing net emissions: energy efficiency, decarbonizing electricity, switching end use to electricity, and capturing carbon
Using energy more efficiently (reduce consumption)
2. Decarbonizing electricity (swapping fossil fuels for
renewable energy sources)
3. Switching end use from fossil fuel to electricity
4. Capturing carbon
Explain what solar geoengineering is, and be able to described in detail the method of pumping sulfur dioxide into the stratosphere – how it is implemented, how it acts to counter global warming, and also the drawbacks of the method.
Solar Geoengineering (aka solar radiation management) refers to efforts made to combat global warming by artificially shading the earth from sunlight by various means
Injecting sulfur (as So2) into the stratosphere from balloons, aircraft, or missiles
However, some drawbacks include:
Increase acid rain, reduce evaporation, accelerate destruction of ozone layer, cheap enough, continual maintenance
Explain why is solar geoengineering considered a ‘band-aid’ and not a true solution to global warming?
This technique is a band aid technique, it tries to compensate for the greenhouse effect, but it does not decrease co2 in the atmosphere and doesn't account for ocean acidification. Actively removing carbon also can “buy” us more time to reduce emissions in other ways