Two-way Independent groups ANOVA
1/30
There's no tags or description
Looks like no tags are added yet.
Name | Mastery | Learn | Test | Matching | Spaced | Call with Kai |
|---|
No analytics yet
Send a link to your students to track their progress
31 Terms
Two-way Independent group ANOVA
We want to examine the effect of two different independent variables at once?
Two-way
2 IV (aka “factors”)
-each factor can have any # of levels
Independent
Different participants in each group
Simplest way to combine 2 or more factors: factorial design
each level of Factor A is combined with each level of Factor B to form a cell
each cell is a different sample made up of different participants
Balanced design: all cells have equal ns
Factorial design (How is it represented )
represented as a table/matrix
rows represent levels of one factor
columns represent levels of the other
each box in table is a cell
Factorial design (how is it named)
named by “# of levels of one factor x # of levels of other factor”
example 2×3 factorial design
Why not conduct 2 separate one-way ANOVAs?
more efficient —> test effects of 2 IVs with one study
More importantly: 2-way ANOVA allows us to examine INTERACTION between factors
Interaction
when effect of one IV changes depending on the level of the other IV
3 total effects tested for in 2-way ANOVA (each get their own F test)
main effect of factor A
main effect of factor B
Interaction effect
Main effect (ME) - what is it asking?
do the means of levels of factor A differ from each other, ignoring/averaging across the levels of factor B? (and vice versa)
Main effect:
compares marginal means of table of cells to each other
compares column means to each other
or compares row means to each other
Interaction effect: what is it asking?
Does effect of one factor differ depending on level of other factor?
compares cell means to each other
do differences between levels of factor A depend on which level of factor B we’re on?
Interaction effect example on table
i.e. is the pattern of differences between cell means within the same column different for different columns?
i.e. is the pattern of differences between cell means within the same row different for different rows?
If lines are parallel:
No interaction
SStot =SSbet + SSw
total variability split into two independent chunks
Assumptions of 2-way ANOVA
independent random sampling
best to randomly sample
if not: randomly assign to conditions (if you’re doing a true experiment)
independence of participants across groups
Normal Distribution of DV in populations
Homogeneity of variance
in populations, all groups have equal variances
not an issue for balanced designs (equal ns)
SS total
each score’s deviation from the grand mean, squared
represents total variability in DV from all causes
FOr one-way ANOVA equation
SS total = SS bet + SS w
SS bet
represents explained variance/treatment effect
SSw
represents unexplained variance/error
How is the variability in the DV broken up to analyze? (in a 2-wway ANOVA)
as we add factors, we split the total variability in our sample (SStotal) into more and more specific components, each one explaining additional variability
one-way anova: SStot = SSbet + SSw
Two-way ANOVA: SStot = SSrow + SScolumn +SSinteraction +SSw
Explained variance =
three independent sources, one for each effect:
variance between rows (main effect of task difficulty)
variance between columns (main effect of motivation)
variance between cells (interaction)
In 2 way ANOVA — how is the variability in the DV broken up to analyze
SSbet still represents ALL explained variability, all variability between-groups, but now is comprised of the three sources
SSbet = SSrow + SS column + SSinter
-with three sources, more variability is explained
-SS bet now will be bigger than it was with only 1 IV
With three sources, more variability is explained:
—> less variability, lef unexplained
—> SSw gets smaller
-smaller error term —> easier to reach significance
The three effects each have their own df, MS, and F:
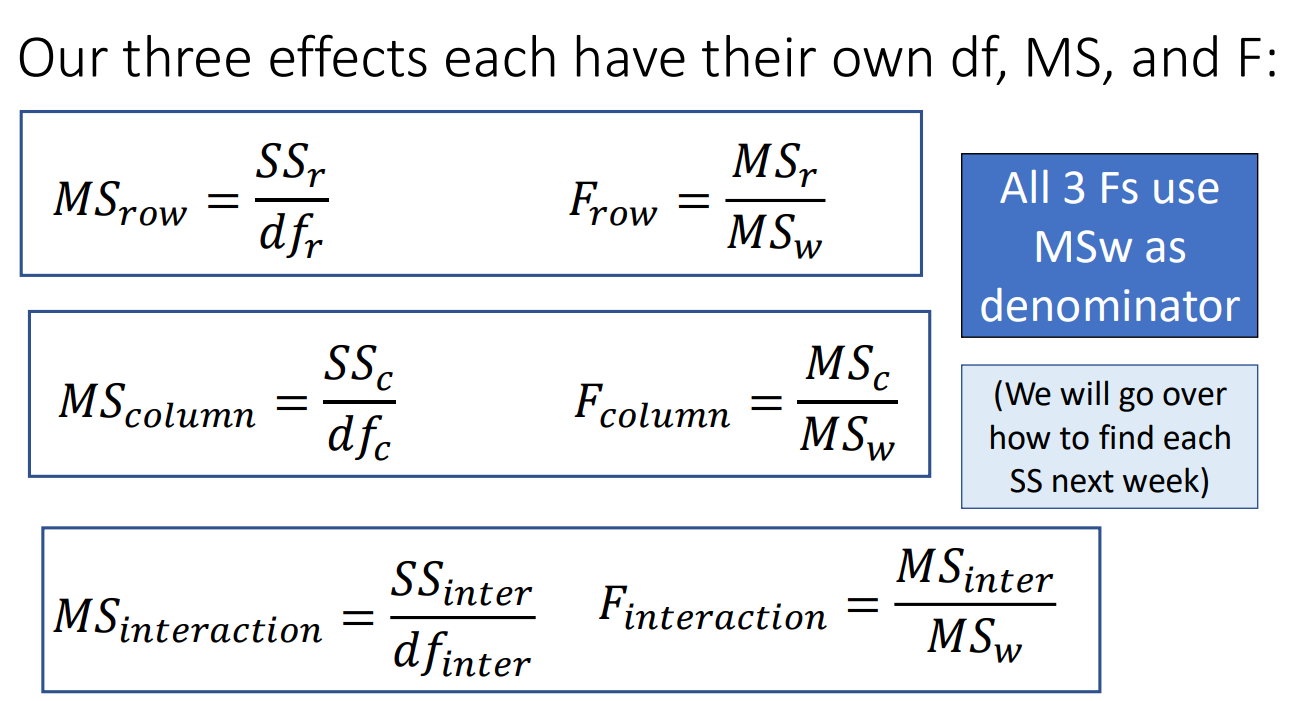
Use these df to find the appropriate Fcrit for the test of each effect
-look up in table: Fcrit (df whichever effect you’re testing, dfw)
—> there will be 3 separate F crits
compare calculated F ratio for each effect to its respective Fcrit
If calculated F>Fcrit for that effect, that effect is significantHo
How to interpret significant effects
Main effects: are there differences between the levels of one IV averaged across the levels of the second IV?
ME of motivation: ignoring task difficulty, what is the effect of motivation?
are there differences between low, med, and high motivation, averaged across easy and hard tasks?
ME of task difficulty: ignoring motivation, what is the effect of task difficulty?
are there differences between easy and hard tasks, averaged across motivation level?
Interpreting Significant Main effects
if you have 3+ groups, MEs only tell you that there is a significant difference SOMEWHERE between that factor’s marginal means
but you don’t know where
again, can perform follow-up tests to pinpoint which means are different from each other
Interpreting Significant Interactions
significant interaction tells us that effect of one IV depends on what level of the second IV we are at
pattern of means for low —> medium —> high motivation for easy tasks differs from the pattern of means for low —> medium —> high motivation for difficult tasks
Important note: significant interactions …
When interatiction is significant, significant main effects may be misleading
interpret MEs with caution when the interaction is significant
always look at your data visually to see what’s going on
For one-way ANOVA, we had n² (effect sizes)
was biased
used w² instead
measures proportion of variability in DV that was explained by IV