Day 18 - Measuring Biodiversity
1/35
There's no tags or description
Looks like no tags are added yet.
Name | Mastery | Learn | Test | Matching | Spaced | Call with Kai |
|---|
No analytics yet
Send a link to your students to track their progress
36 Terms
What are the 4 types of biodiversity?
Genetic Diversity
Species Diversity
Functional Diversity
Landscape Biodiversity
What is landscape biodiversity?
The number/arrangement of specific habitat types or ecosystems
Why is genetic diversity important?
Higher genetic diversity usually indicates strong species persistence
More genetic diversity = more resilience
Why is species diversity important?
Higher species count can mean more stable and resilient community
What you normally think of when hearing biodiversity
What is functional diversity?
The diversity of ecological roles, not just species
Lots of different minnow but all have the same function = low functional diveristy
Why is functional diversity important?
More applied
Can be more indicative of stability/resilience
What is richness?
The raw number of species in a community
What is evenness?
The evenness of abundance between species in a community
Is one species dominant over the others?
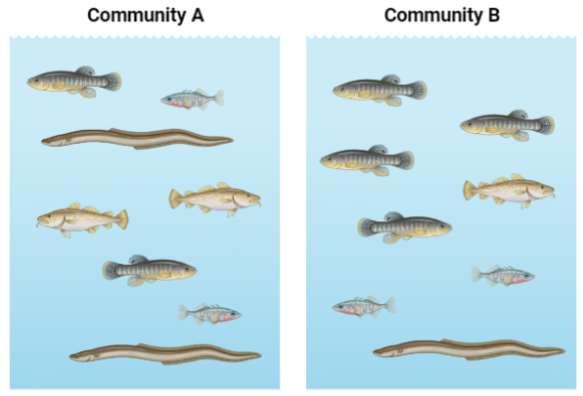
What is the richness for each community?
Community A = 4
Community B = 4

Which community is more even?
Community A
What is alpha diversity?
The diversity of species within a single habitat
What does a higher alpha diversity indicate?
A higher diversity
What is beta diversity?
The diversity of species between habitats/species turnover
When each patch is distinct = higher beta (each patch has different species)
What does a higher beta diversity indicate?
Higher diversity
What is gamma diversity?
The diversity of species across all habitats of interest
What does a higher gamma diversity indicate?
Higher diversity
What are the 4 main ways to measure diversity?
Count individuals in an area
How much effort should you put in?
How do you handle rare species?
Stratify by habitat
Dedicate time in riffles, runs, pools
Rank abundance curves
Made after collecting data
Log abundance plots
Creates a normal distribution
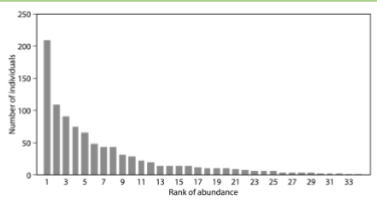
What does this graph show?
A Rank Abundance Curve
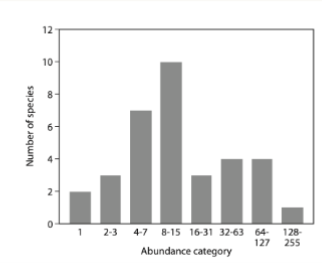
What does this graph show?
A Log Abundance Plot
What would the rank abundance curve/log abundance curve look like if the community was richer?
The log plot would get taller and wider
The rank plot would get wider
What would the rank abundance curve/log abundance curve look like if the community was more even?
Rank would be flatter
Log would also be flatter
What does being rare mean?
Limited geographic range
Specific habitat requirements
Locally sparse population
How can rarity affect measuring biodiversity?
Complicate single estimations and comparisons across locations
Certainly, going to miss species when sampling
What are the 2 ways to estimate missing species?
Rarefaction Curves
Chao’s Indicator
What is a rarefaction curve?
Mathematically estimate asymptote of accumulation curve
What is a drawback to a rarefaction curve?
You are likely to be wrong if you already don’t have a good sample
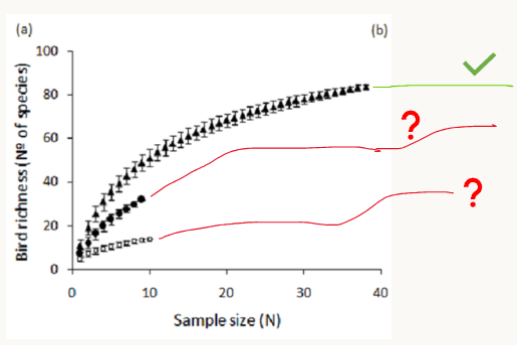
What does this graph show?
A rarefaction curve!
Most of the species caught in the first few sample runs
Lots of errors between the lines
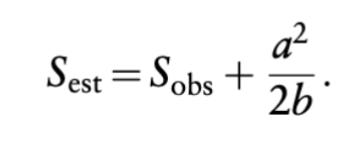
What does this equation show and what do the parts mean?
Chao’s Indicator
Sest = estimated species
Sobs = samples species
a = number of species with only 1 individual
b = number of species with 2 individuals
What is a Chao’s indicator?
A conservative estimate
Best used with the rarefaction curve
What is a drawback to a Chao’s indicator?
Samples will usually be lower than reality
What are the 2 diversity indices used?
Shannon Diversity Index
Simpson Index
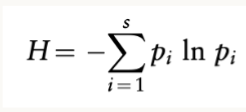
What equation is this?
The Shannon Diversity Index
s = number of species in your community
pi = proportion of species i that show up (i/total number of species in your community)
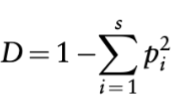
What equation is this?
The Simpsons Index
s = total individual in community
pi = proportion of species i out of total
What are diversity indices good for?
Taking richness and evenness and putting it all into 1 number
What are pros to diversity indices?
Can combine species richness and evenness into one value
Relatively easy to calculate
Many indices with their own respective usefulness
What are cons to diversity indices?
Each index has its own quirks and sensitivities to be aware of
Comparison among sites using indices not very meaningful (especially statistically)