MT 1 Microeconomics
1/52
There's no tags or description
Looks like no tags are added yet.
Name | Mastery | Learn | Test | Matching | Spaced | Call with Kai |
|---|
No analytics yet
Send a link to your students to track their progress
53 Terms
Price elasticity of demand
Percentage change in quantity demanded of a good resulting from a 1 percent increase in its price.
Elasticity
Percentage change in one variable resulting from a 1 percent increase in another.
Elasticity of demand
how much the quantity demanded changes when price changes.
Elasticity of supply
how much the quantity supplied changes when price changes.
Short run
elasticity is usually lower (more inelastic) because people and firms cannot adjust quickly. (<1%)
Long run
elasticity is usually higher (more elastic) because people and firms have time to adjust production or consumption. (>1%)
Unit elastic
=1
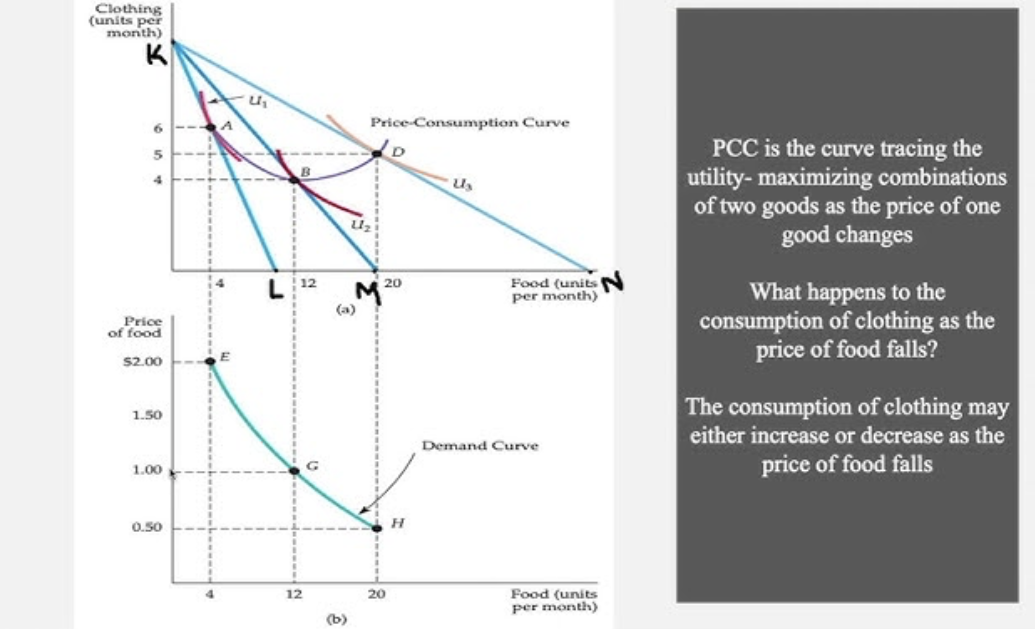
Price Consumption Curve (PCC)
traces the utility-maximizing combinations of two goods as the price of one good changes, while income and the price of the other good remain constant
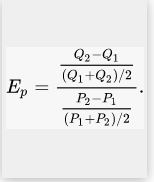
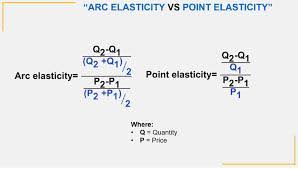
Arc elasticity formula
It is the percentage change in quantity (based on the average quantity) divided by the percentage change in price (based on the average price).
Independent goods
No effect on Qd of 1 to another
What is a slope of a budget line?
-Px/Py price ratio - not a marginal substitution
Consumer surplus
difference between what a consumer is willing to pay for a good and the amount actually paid. CS = ½ ( Pmax - P in equilibrium) * Q in equilibrium
Expenditure will decrease
when elasticity will increase
Expenditure will increase, what happens to price and demand ?
when prices and demand will increase
Market demand curve term
Curve relating the quantity of a good that all consumers in a market will buy to its price. shifts to the right when more consumers enter the market
Elasticity of demand (formula)
Eqd,p=delta Qd/ delta P*P/Qd
Isoelastic demand curve
demand curve with a constant price elasticity
MRS
max amount of goods consumer is willing to give up of one unit in order to obtain another good. MRS=MUx/MUy
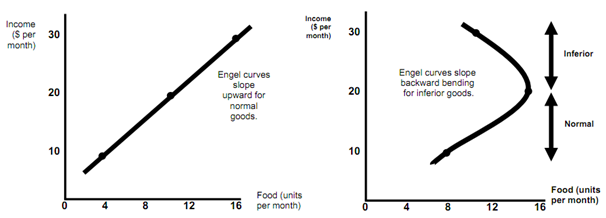
Engel curve
curve relating the Q consumed of a good to income
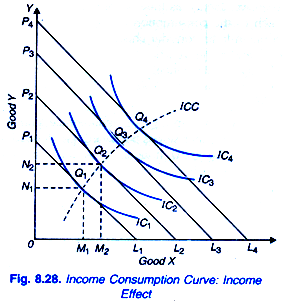
The Income Consumption Curve (ICC)
shows how a consumer’s choice of goods changes when their income changes, while prices stay the same. It shows all the best (optimal) combinations of two goods at different income levels.
More horizontal line
elastic
More vertical line
inelastic elasticity
Infinitely elastic demand
The price decrease, we want to buy max of this product (while the price is low)
Completely inelastic demand
The price increase, but we still buy it.
Income elasticity of demand
Percentage change in the demand resulting from a 1 percent increase in income.
income incr - demand decr = inferior goods (noodles)
Income decrease - demand decrease = normal goods
Income increase - buying the same or a lil better = necessarily goods
Income increase - buying expensive/branding goods = luxuriously goods )
Cross-price elasticity of demand
Percentage change in the quantity demanded of one good resulting from a 1-percent increase in the price of another.
Price elasticity of supply
Percentage change in quantity supplied resulting from a 1 percent increase in price. Can be elastic, uni elastic and inelastic
Point elasticity of demand
Price elasticity at a particular point on the demand curve.
Elasticity sign
Price with elasticity demand should be negative (slope)
Short run (production)
Period of time in which quantities of one or more production factors cannot be changed.
Fixed input
Production factor that cannot be varied.
Long run (production)
Amount of time needed to make all production inputs variable.
Income elasticity (time difference)
For most goods and services the income elasticity of demand is larger in the long run than in the short run.
Durable goods elasticity
The short run income elasticity of demand will be much larger than the long (cars, appliances)
Marginalism
is a theory in economics that explains the value (price) of goods and services based on their marginal utility.
Marginal utility importance
Marginal utility matters more than total.
Marginal utility
the additional satisfaction or benefit a consumer gains from consuming one extra unit of a good or service (goes down). Can be neg.
Consumer behavior steps
1. Consumer preferences 2. Budget constraints 3. Consumer choices
Indifference curve (indifference map)
curve representing all combinations of market baskets that provide a consumer with the same level of satisfaction. They cannot intersect, can have a budget line.
Indifference map
graph containing a set of indifference curves showing the market baskets among which a consumer is indifferent.
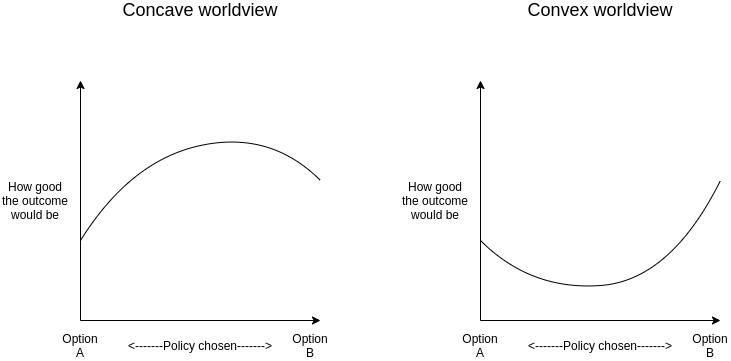
Shape of indifference curve
The indifference curve is always convex - going down. Or concave - mirror shape
Slope of indifference curve
MRS
Perfect complements
Two goods for which the MRS is zero or infinite; the indifference curves are shaped as right angles.
Utility
Numerical score representing the satisfaction that a consumer gets from a given market basket.
Utility function (market baskets)
Formula that assigns a level of utility to individual
U(F,C)=F*C
Ordinal utility function
Utility function that generates a ranking of market baskets in order of most to least preferred.
Cardinal utility function
Utility function describing how much one market basket is preferred to another.
Budget constraints
Constraints that consumers face as a result of limited incomes.
Budget line
All combinations of goods for which the total amount of money spent is equal to income. Slope = Px/py (MRS). Px, Py both decrease in the same % or amount - slope wont change but will move right
Marginal benefit
Benefit from the consumption of one additional unit of a good.
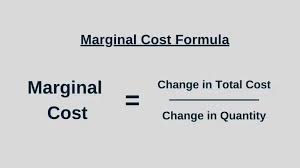
Marginal cost
Cost of one additional unit of a good.
Diminishing marginal utility
Principle that as more of a good is consumed, the consumption of additional amounts will yield smaller additions to utility.
Consumer equilibrium
MUx/Px=MUy/Py ; MUx/MUy=Px/Py ; MRS=Px/Py