Biology 30 AP - Population & Community Dynamics
1/55
There's no tags or description
Looks like no tags are added yet.
Name | Mastery | Learn | Test | Matching | Spaced | Call with Kai |
|---|
No analytics yet
Send a link to your students to track their progress
56 Terms
G. Hardy and W. Weinberg
1908
frequency of alleles and genotypes in a population will remain constant from generation to generation if population is stable and in genetic equilibrium
Genetic equilibrium
no change
frequencies of certain traits will remain same
Microevolution
change present
frequencies of traits change over time (short period)
5 conditions for Hardy-Weinberg Equilibrium
A large breeding population
Random mating
No change in allelic frequency due to mutations
No immigration (coming in) or emigration (leaving)
No natural selection
Hardy-Weinberg Principle
p + q = 1.00
p = dominant allele
q = recessive allele
values referred to as allele frequencies
Hardy-Weinberg Equation
p2 + 2pq + q2 = 1.00
frequencies b/w 0.00-1.00
5 agents of evolutionary change
Mutation
Gene flow
Non-random mating
Genetic drift
Natural selection
Mutation
change in DNA
created by mutagens or mistakes during replication
can provide genetic diversity in a species and new alleles for a gene
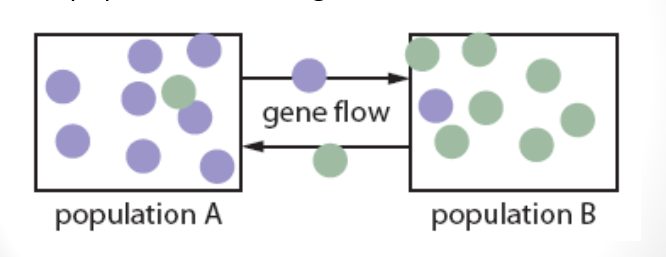
Gene flow
migration of alleles from one population to another
Non-random mating
e.g. fertilization in flowers
random mating is uncommon in natural populations
mates are usually selected based on appearance and health
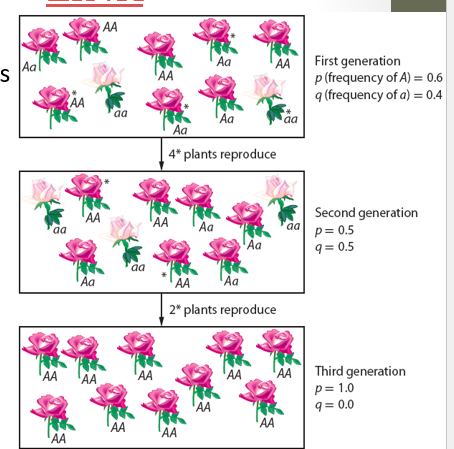
Genetic drift
only some plants in a population reproduce every generation
when plants do not reproduce → allele quickly lost from gene pool
bottleneck and founder effect
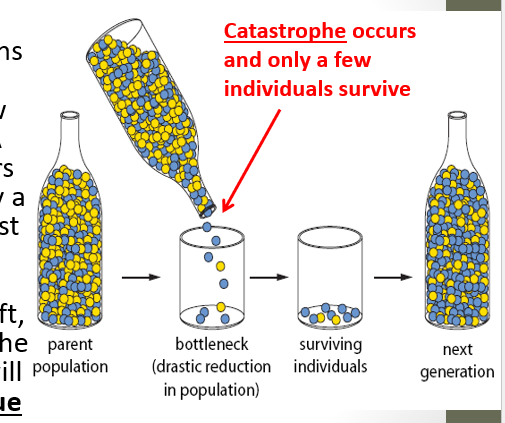
Bottleneck effect
parent population contains roughly equal numbers of yellow blue alleles → catastrophe occurs with only few survivors
most survivors have blue alleles → genetic drift → gene pool of next generation will contain mostly blue alleles
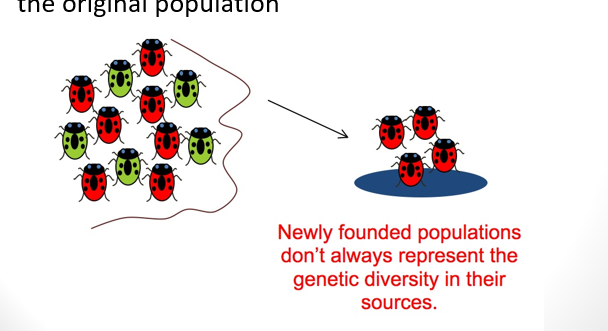
Founder Effect
gene pool change that occurs when a small number of individuals start a new, isolated population
few individuals from large population leave → establish a new population → allele frequencies in new population will differ from original population → further deviation as population expands
Natural selection
favourable variations
acts on mutations by selecting for most successful individual who has the mutation
mutation provides selective advantage → individual lives to reproduce → passes on mutation to offspring → evolution
Census
counting total in small area
Sampling
representatively sample small area and multiply by total area
assumes random distribution
4 factors affecting population size in given area
Natality (birth)
Mortality (death)
Immigration (coming)
Emigration (leaving)
Open populations
all 4 factors functioning
Closed populations
no migration (immigration and emigration)
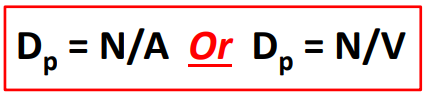
Formula for population density
Dp = N/A or N/V
Dp: population density
N: # of individuals in a population
A: area
V: volume
increased density = increased population
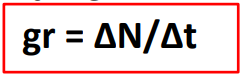
Growth rate
change in population size
delta N = (births + immigrations) - (deaths + emigration)
factors that increase size - factors that decrease size
formula: gr = delta N / delta t (time)
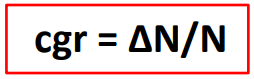
Per capita growth (cgr)
change in population size (delta N) relative to initial population size (N)
formula: cgr = delta N / N
effective when comparing populations of different sizes (e.g. school vs. community)
Biotic potential ( r )
capacity for reproduction
regulated by four factors
Four factors that regulate biotic potential
Max. # of offspring per birth
Chance that offspring will reach reproductive age
# of times per year organism reproduces
Age at which reproduction begins
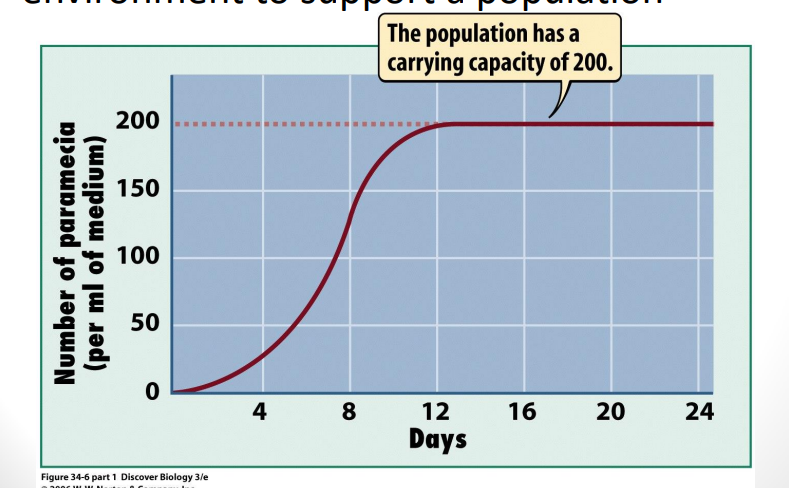
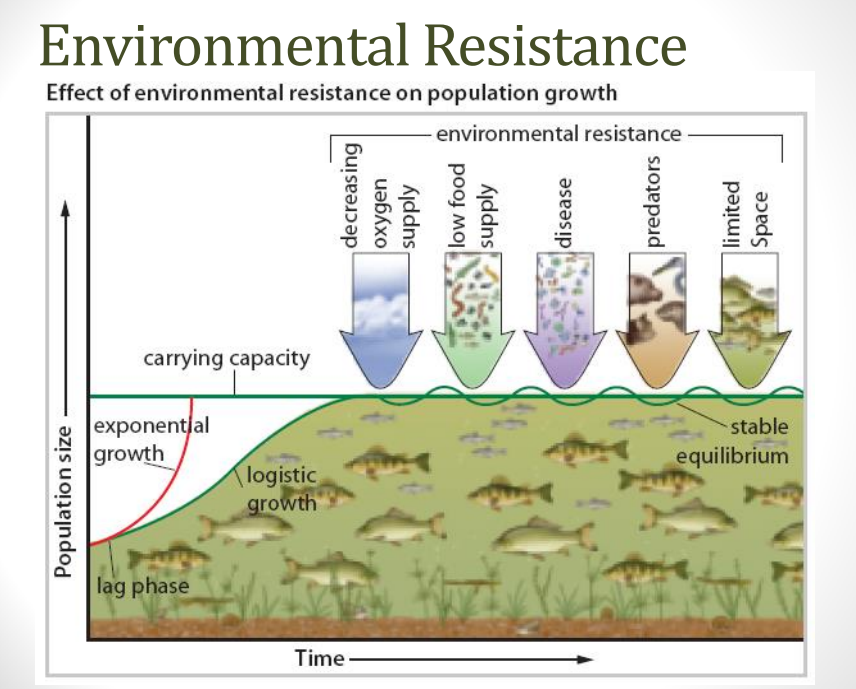
Carrying capacity (K)
ability for environment to support a population
plateau on a graph (ALWAYS)
Density-dependent factors
usually biotic
affect population because of density of population
increase death & limit reproduction as population decreases
e.g. disease, predation, food supply, water quality
Density-independent factors
usually abiotic
affect the population regardless of density
work regardless of population size
e.g. floods, fires, drought
Environmental resistance
environmental conditions limit a species from growing out of control
influenced by abiotic and biotic factors
environment fighting back
J curves
exponential growth
increase in population size at an increasing growth rate
closed systems
often microorganisms with short life spans
e.g. bacteria, algae, yeast
exception: humans

S curves
most natural populations demonstrate a Sigmoid-shaped curve
population increases until limiting factors cause it to reach carrying capacity → resources maintained → population size stabilized
density dependent/independent factors initiate death phase

K-selected strategies
slow reproduction
long life span
longer offspring rearing (taking care of young)
later reproductive maturity
bigger animals
live at densities close to carrying capacity
e.g. elephants, humans, deer, bears
r-selected strategies
rapid reproduction
short life span
little/no rearing
early reproductive age
smaller animals
exploit less crowded niches
high growth rates
e.g. bacteria, yeast, mice, insects
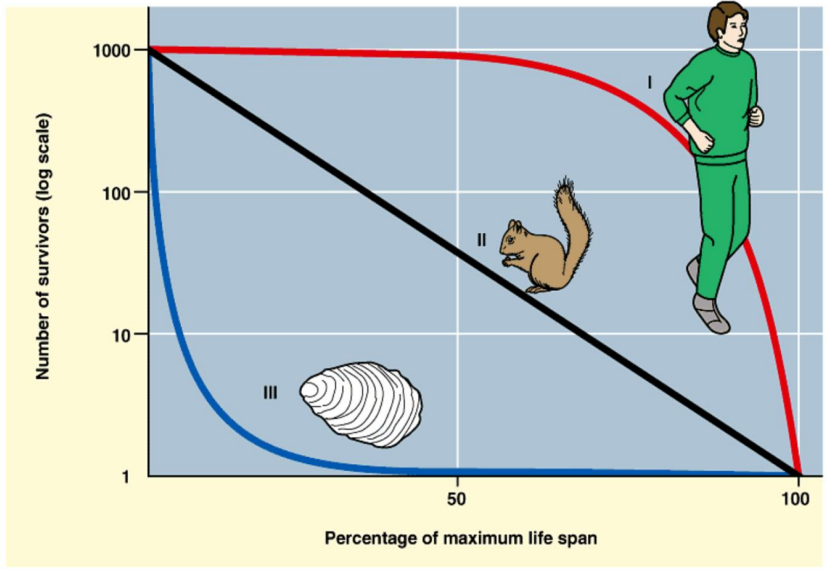
Type I survivorship curve
large mammals
few offspring
low infant mortality
extended lifespan.
e.g. humans

Type II survivorship curve
chances of survival or death are about the same at any age
e.g. squirrels

Type III survivorship curve
low survivorship
high mortality rates early in life
e.g. oysters
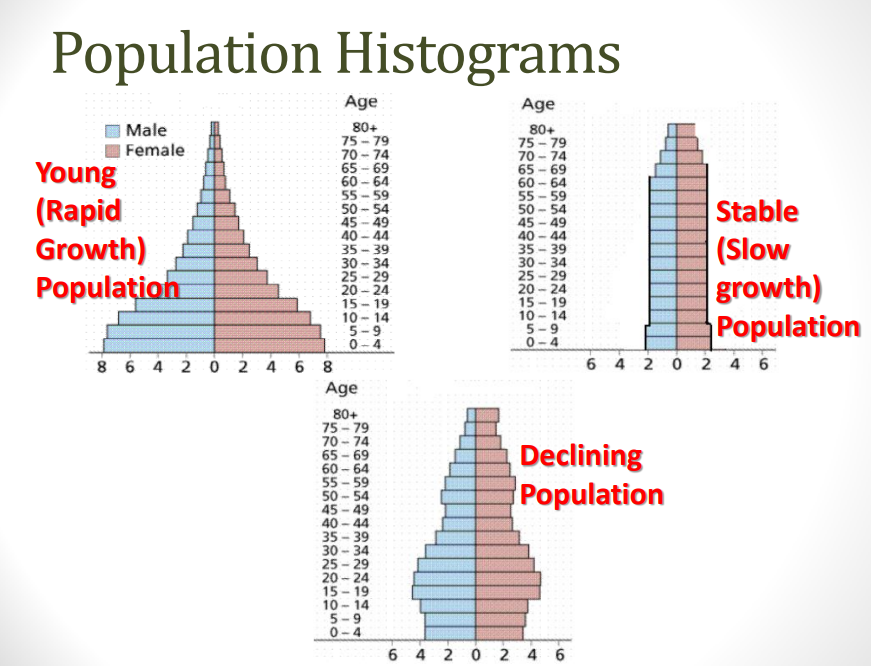
Population histograms
useful for studying human populations to see trends and make predictions
double histograms: includes age and sex of a population
often pyramid shaped
Symbiosis
relationship between two or more different species
3 types: parasitism, commensalism, and mutualism
Predator-prey interaction
one species preys on another
Consumer-producer interaction
one species produces a resource for another
producers must be present in order to sustain the needs of consumers
no producers = no consumers = no community
Competition
individuals must compete for resources
2 types: intraspecific and interspecific competition
Parasitism
positive / negative
one benefits
another harmed
parasites require hosts (usually specific)
Commensalism
positive / neutral (0)
one benefits
other unaffected
Mutualism
positive / positive
both benefit
Predation
both predators and prey have specialized adaptations to assist with survival
2 ways to avoid predation
Camouflage: blend in
Mimicry: look like something scary
Intraspecific competition
individuals within the same population are competing for resources
Interspecific competition
different populations are competing for resources
Gause Principle
competitive exclusion principle
if 2 populations are competing for a limited resource → one eliminated
Niche
an organism’s role or place within an ecosystem
Succession
ways by which populations and communities change over time
Pioneer species
1st organisms to take root and build soil layer
e.g. lichen, moss, ferns, insects
Climax community
stable end populations that develop
Primary succession
community arising from NO previous living populations (i.e. barren land)
Secondary succesion
community begins to re-establish after partial destruction
e.g. forest fire, road paving, cultivation
Obligatory mutualism
each depends on the other exclusively
Facultative mutualism
neither is wholly dependent on the other