exst 2201 exam 3
1/196
Earn XP
Description and Tags
9.1-9.4, 10.1-10.3
Name | Mastery | Learn | Test | Matching | Spaced | Call with Kai |
|---|
No analytics yet
Send a link to your students to track their progress
197 Terms
In linear relationships, what is the purpose of these new methods that require two columns of data values?
To measure how the values of two variables move relative to each other.
In linear relationships, do the two columns of data values have to be dependent data values?
Yes, otherwise the results have no meaning.
In linear relationships, why is first looking at the scatterplot so important?
To check for extreme values and unusual patterns in the data values.
In linear relationships, why could the field of statistics not prove that smoking caused lung cancer?
Because of the possibility of a lurking variable affecting the statistical results.
In linear relationships, what is the key purpose of a scatterplot?
To see any relationship between two variables.
In linear relationships, which variable is always plotted on the y-axis?
The response variable.
In linear relationships, how are the predictor variable / response variable, determined in a dataset?
The variable that changes first / The variable that changes second.
In linear relationships, what is the key purpose of linear correlation?
To summarize the linear component between two variables.
In linear relationships, select two characteristics that linear correlation measures in the relationship between two variables?
The direction of the linear relationship.
The strength of the linear relationship.
In linear relationships, what is the key purpose of linear regression?
Two of these other choices.
In linear relationships, what is the theoretical objective of linear regression?
To find the middle line of a scatterplot.
In linear relationships, what form of statistical calculations are used to do a linear regression in this book?
The Least Squares method of linear regression.
In linear relationships, is a data set with two columns for the Height and Weight of individuals appropriate to measure movement?
Yes, because this data is two measurements from one individual.
In linear relationships, could the field of statistics show that higher tariffs imply higher prices?
Yes, as statistics can determine the relationship between two variables.
In linear relationships, what characteristic of the two columns of data values is being measured?
The movement between the data values in the two columns.
In linear relationships, what is the consequence of using two columns of independent data values?
The statistical results have no actual meaning.
In linear relationships, what are two key points to always keep in mind when interpreting relationship results?
Always look at the data first to see its pattern.
Relationship is never proof of causation between two variables.
In linear relationships, where does a lurking variable lurk?
Outside of the variables measured.
In linear relationships, why is the presence of a potential lurking variable important?
It can affect the statistical results without being known.
In linear relationships, what does the word movement (or relationship) between two variables mean in terms of the data values?
How the value of one variable changes in relation to a change in the other variable.
In linear relationships, what type of relationship between two variables can be seen in a scatterplot?
Any type of relationship between the two variables.
In linear relationships, what type of relationship between two variables can be detected with the method of correlation?
Only a linear relationship.
In linear relationships, can the method of correlation measure a linear relationship, as well as just detect it?
Yes, it measures the strength of the linear relationship.
In linear relationships, what are possible values for the linear correlation statistic?
-1 to +1 (including the end points).
In linear relationships, what additional information does linear regression over that given by linear correlation?
The size of the effect of the predictor variable on the response variable.
In linear relationships, how is the information about a linear relationship summarized in linear regression?
By the equation of the line of best fit through the middle of the scatterplot.
In linear relationships, what is the purpose of a scatterplot?
A tool to help analyze the pattern of pairs of data values.
In linear relationships, what are the three types of overall patterns to look for in a scatterplot?
A linear relationship.
A curvi-linear relationship.
No relationship.
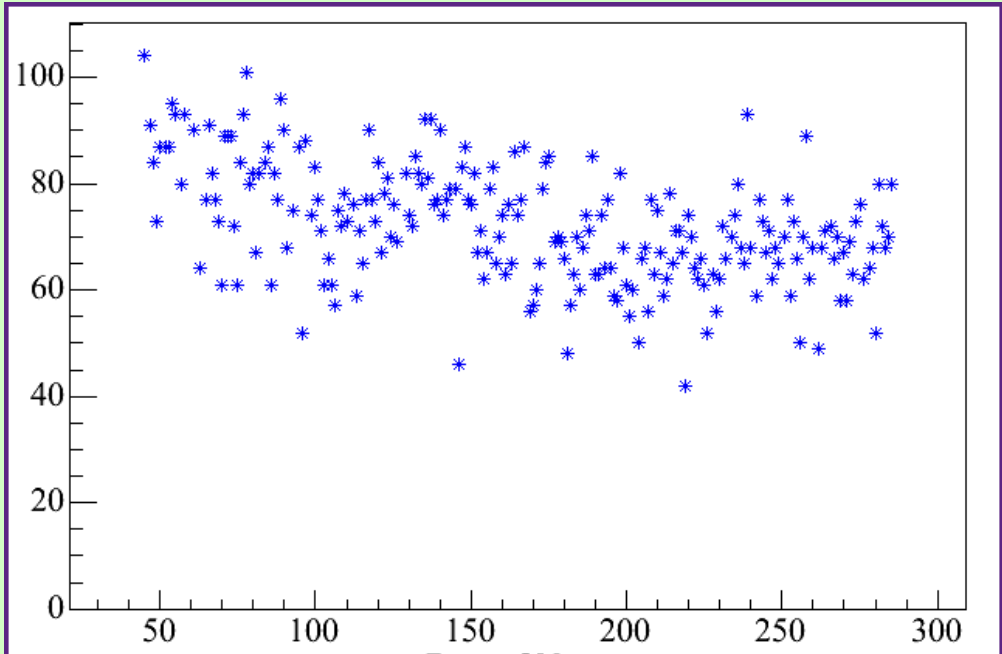
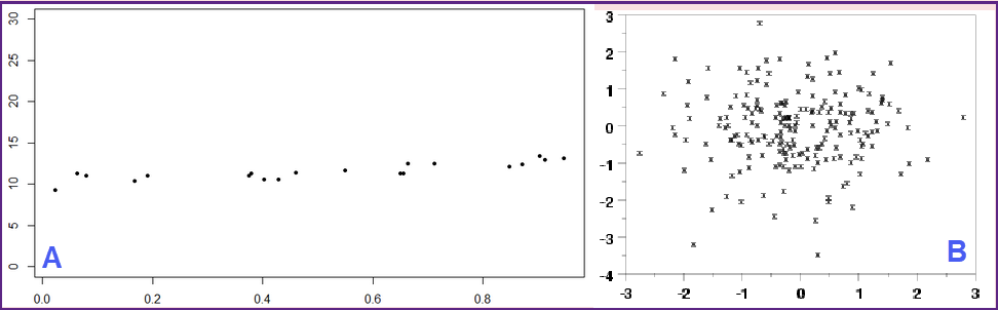
In linear relationships, what type of overall pattern is seen in the scatterplot below?
A slight negative linear relationship.
In linear relationships, what is the practical meaning of a positive / negative, linear relationship?
The data values move together / The data values move opposite.
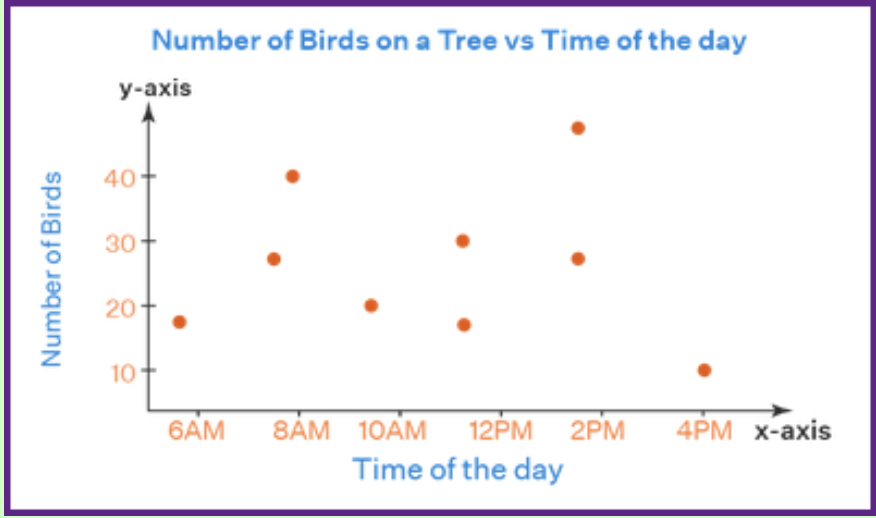
In linear relationships, what type of overall pattern is seen in the scatterplot below?
No relationship.
In linear relationships, what are the three exceptions to the overall patterns to look for in a scatterplot?
Extreme values.
Multiple groups.
Events.
In linear relationships, why is knowing about extreme values in the data set so important?
They pull the statistical results away from the main pattern of the data values.
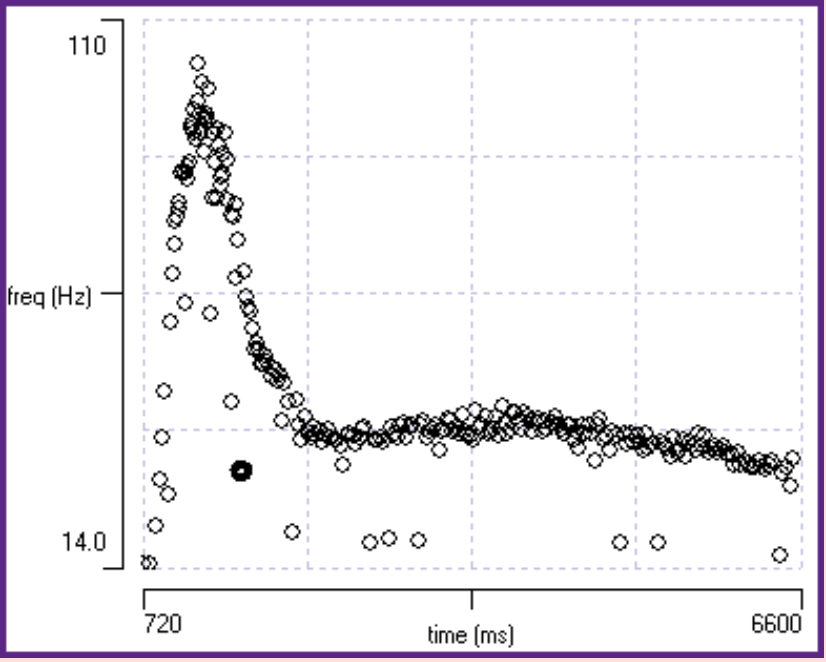
In linear relationships, what type of exception is seen in the scatterplot below?
An event on the left side of the scatterplot.
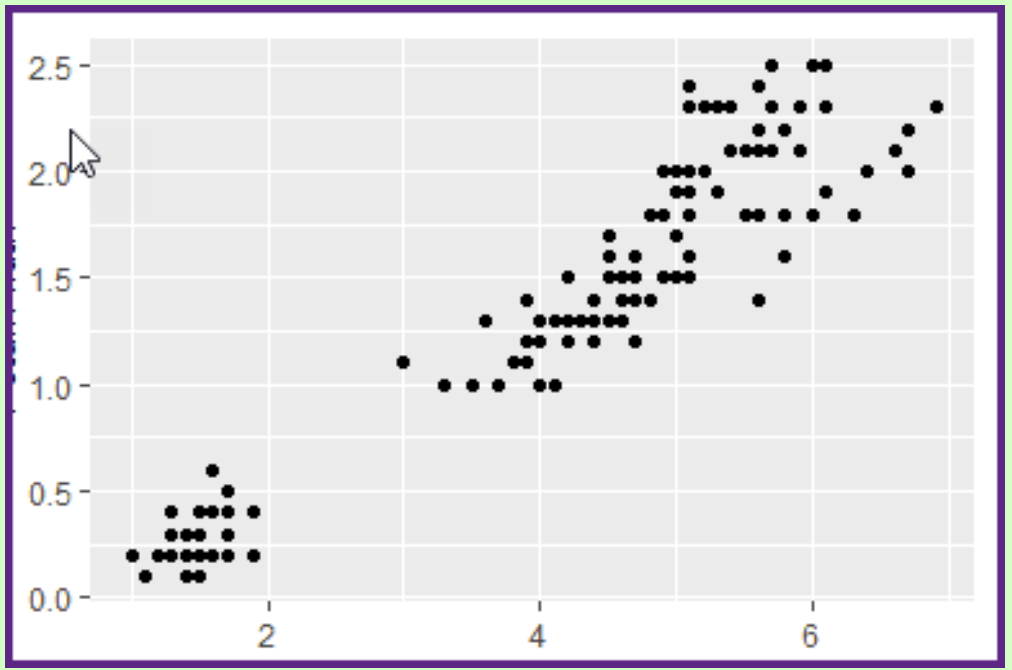
In linear relationships, what type of exception is seen in the scatterplot below?
A group on the lower left side of the scatterplot, and a second group on the upper right side.
In linear relationships, what is the purpose of linear correlation?
A tool to measure the linear component of the pattern of the pairs of data values.
In linear relationships, why is knowing a linear relationship important in statistics?
Because it is an easy to use, and understand, summary of the relationship between two variables.
In linear relationships, what is the first step in calculating linear correlation from the data values?
Standardize the raw data values into z-scores.
In linear relationships, what value of Pearson’s correlation coefficient indicates that there is no linear relationship?
r = 0 .
In linear relationships, what part of the correlation coefficient gives the direction of the linear relationship?
The mathematical sign of the correlation coefficient.
In linear relationships, what part of the relationship between two variables does the correlation coefficient measure?
Only the linear component of the relationship.
In linear relationships, how are extreme values seen in a scatterplot?
As a dot outside of the overall pattern of the dots.
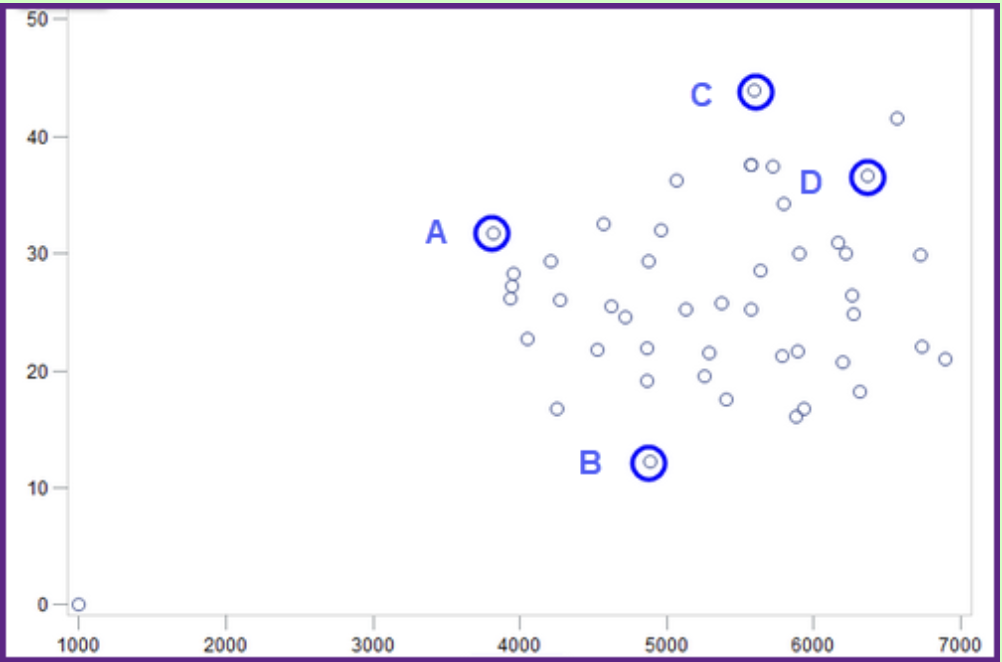
In linear relationships, use the scatterplot below to find the coordinates of Point A / Point D?
Point A = (3800, 32) / Point D = (6500, 36)
In linear relationships, what are the two steps to follow when analyzing a scatterplot?
Look at the overall pattern of the dots.
Look for exceptions to the overall pattern of dots.
In linear relationships, what method is used to visually estimate the linear component in a scatterplot?
The Rubber-Band method.
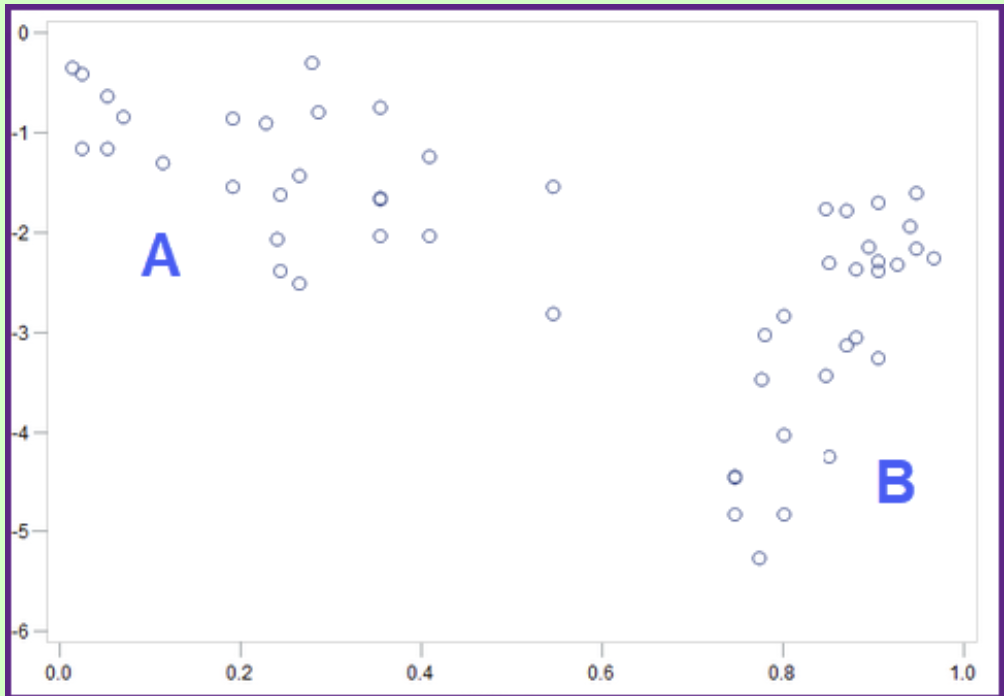
In linear relationships, what is the direction of the linear relationship in Scatterplot A / Scatterplot B below?
All of these other choices.
In linear relationships, which of the two scatterplots below (A, B) shows a higher linear relationship?
Plot B, because its points lie closer to a line.
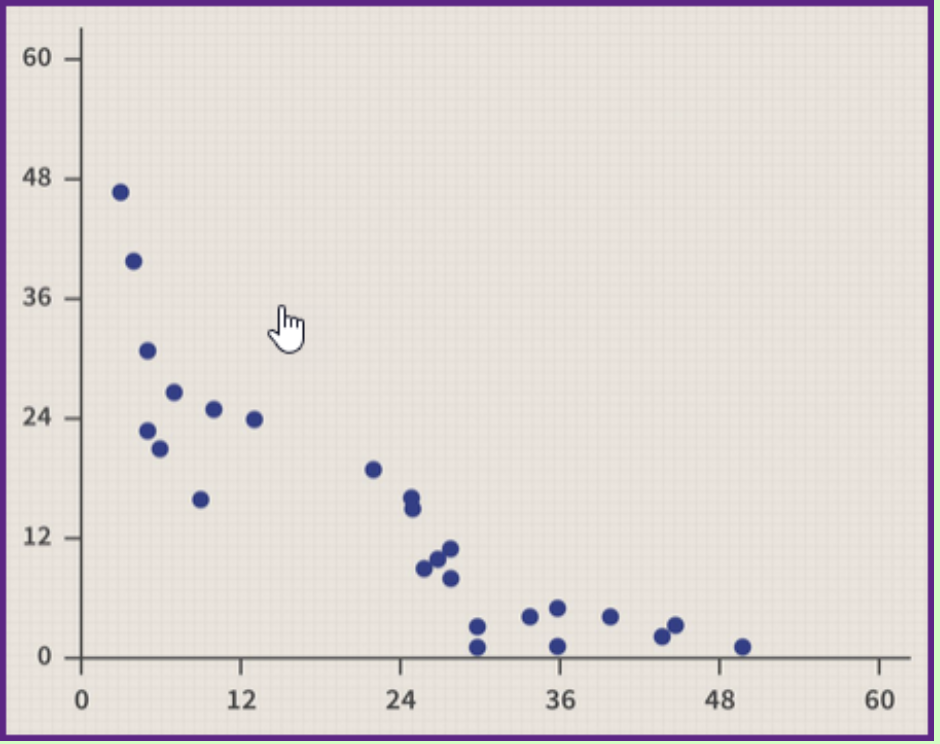
In linear relationships, what overall pattern of the dots is shown in the scatterplot below?
One curvi-linear relationship.
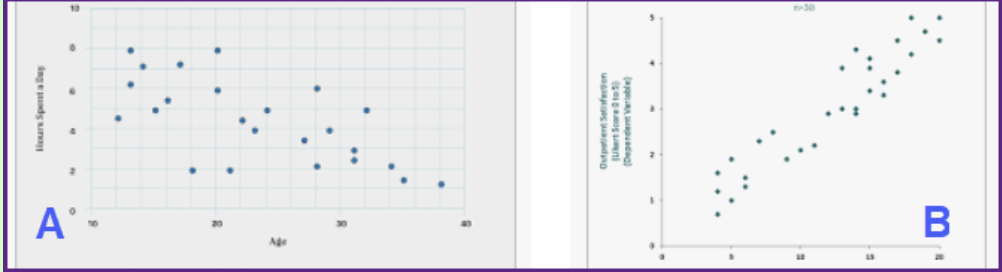
In linear relationships, what is the relationship between two variables shown in Scatterplot A / Scatterplot B, below?
Plot A = no relationship / Plot B = no relationship.
In linear relationships, what are two reasons why a statistical method using mathematics is needed if scatterplots are so useful to see variable relationships?
It can be hard to see a pattern in complex scatterplots.
A scatterplot does not quantify a relationship.
In linear relationships, what calculations are the foundation for the method of linear correlation?
Multiplying two z-scores together and summing.
In linear relationships, how many positive and negative signs would you expect in the last column (Zx × Zy) of the linear correlation table for a correlation coefficient near zero?
Nearly equal number of positive and negative signs.
In linear relationships, what two characteristics of a linear relationship are expressed in a correlation coefficient?
The direction shown by the mathematical sign.
The strength shown by the magnitude of the value.
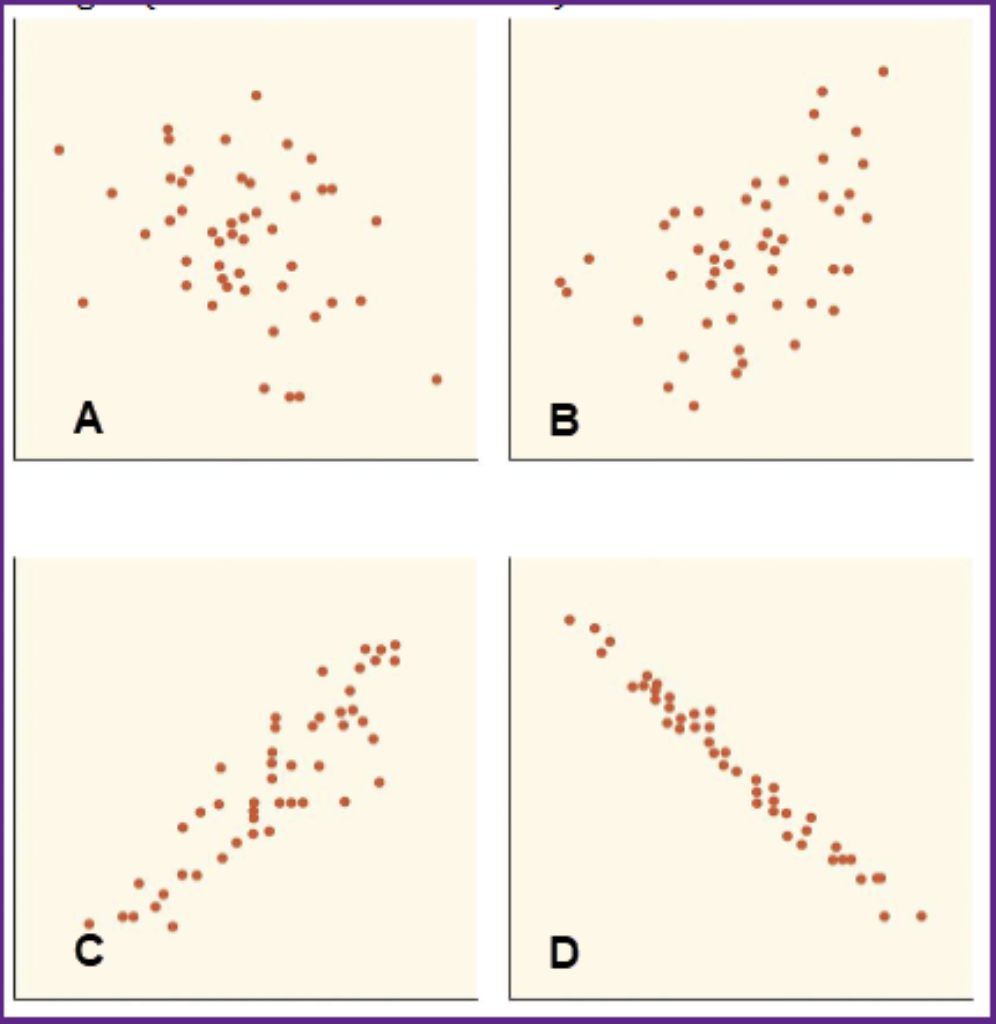
In linear relationships, what are appropriate linear correlation coefficients for Plot A / Plot B / Plot C / Plot D, shown below?
Plot A = -0.3 / Plot B = 0.5 / Plot C = 0.9 / Plot D = -0.99.
In linear relationships, how does the Rubber Band method indicate a high linear component?
By forming a long, narrow oval shape.
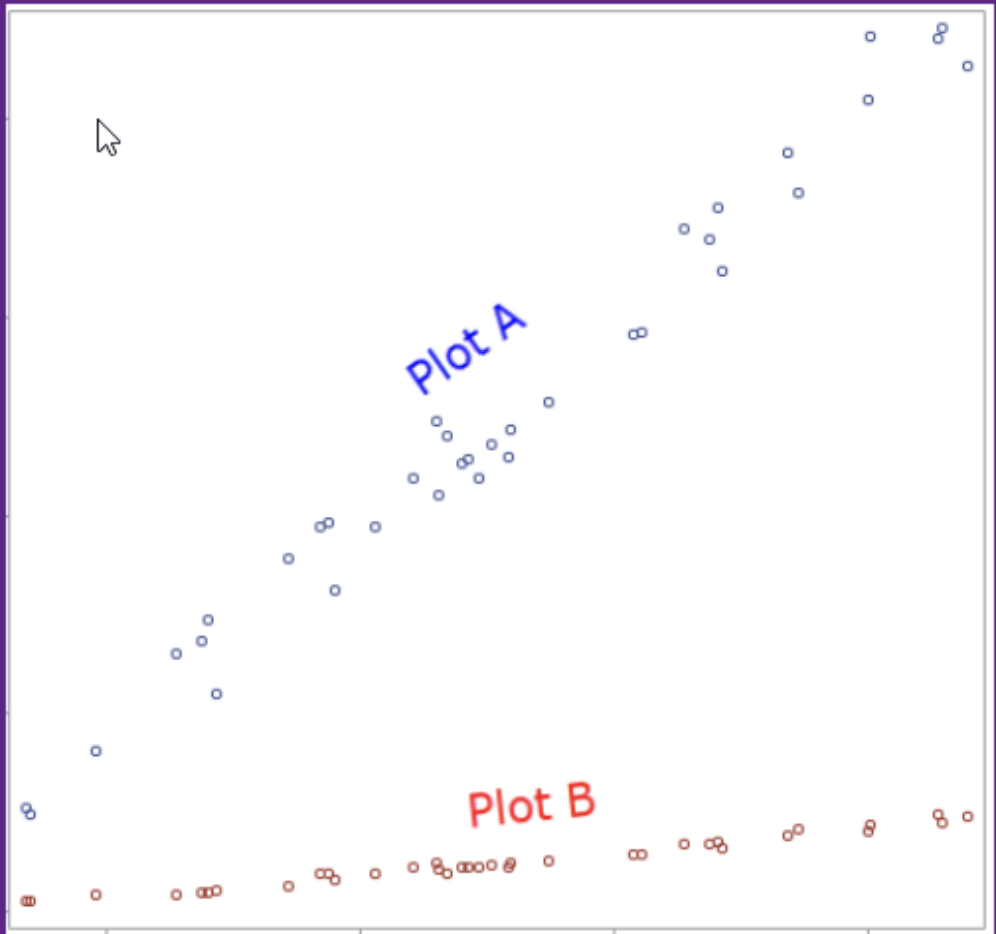
In linear relationships, which of the two scatterplots (A, B) in the graph below shows a lower linear correlation coefficient?
Plot A as its points lie farther away from a straight line.
In linear relationships, how does an extreme value affect the linear correlation coefficient?
All of the other answers.
In linear relationships, what is the correlation coefficient between height (in inches) and weight (in ounces) if the correlation coefficient between height (in feet) and weight (in pounds) is 0.40? (note: 12 in/ft, 16 ou/lb).
r = 0.40.
In linear relationships, why is the concept of the middle point in a histogram so important to understanding the data values?
It gives one, easy to understand, value that is most representative of all the data values.
In linear relationships, why is the concept of the middle line of a scatterplot so important to understanding the relationship between two columns of data values?
It gives an easy to understand relationship between the two columns.
In linear relationships, why is the equation (slope and y-intercept) of the middle line of a scatterplot so important to understanding two columns of data values?
It allows the use of the line for explanation and prediction.
In linear relationships, what is the name of the middle line of a scatterplot?
The regression line.
In linear relationships, what is the appropriate name of a regression with one predictor variable and one response variable?
A simple regression.
In linear relationships, what new information does the method of linear regression give over the method of linear correlation?
The size (magnitude) of the effect on the response variable by the predictor variable.
In linear relationships, how are the results given for the method of linear regression?
In the equation of the regression line.
In linear relationships, choose the proper equation for a linear regression line in the field of statistics?
y=b0+b1x.
In linear relationships, what are the correct symbols for the y-intercept / the slope, in a regression line?
y-intercept=b0 / slope=b1.
In linear relationships, which of the following choices is an assumption about the residuals in a linear regression line?
They are normally distributed around the regression line.
In linear relationships, use the regression equation shown below to select which of the choices is an example of the use of a regression line for explanation?
y = 1.0 + 2.31x
All of these other answers.
In linear relationships, use the regression equation shown below to select which of the choices is an example of the use of a regression line for prediction?
y = 1.0 + 2.31x
If x equals 1.25 units, then y equals 3.89 units.
In linear relationships, use the information shown in the table below to find out if the point = (2, 20) within the scope of the model?
Variable | Min | Max | Range |
x | -14 | 112 | 126 |
y | 27 | 189 | 162 |
Yes, as this point is within the value range of the predictor variable.
In linear relationships, what is the concept of a residual in simple linear regression?
The vertical distance from the point to the regression line.
In linear relationships, what is the value of the residual for a point exactly on the regression line?
Residual = 0.
In linear relationships, in simple linear regression, how many predictor variables / response variables, are there?
Predictor = 1 / Response = 1.
In linear relationships, what two assumptions about the data set must be met to do a linear regression?
A linear relationship actually exists between the two variables.
The values of the response variable are normally distributed around the regression line
In linear relationships, the values of both the y-intercept (b0) and the slope (b1) are needed to use a regression equation for prediction. What terms are needed to use a regression equation for explanation?
Only the value of the slope (b1).
In linear relationships, which choice below is an important consequence of the Scope of the Model for interpreting linear regression results?
Valid for interpolation inside the range of the predictor variable.
In linear relationships, which one of the following points would be closest to the regression line?
Point A: with residual=+150
Point B: with residual=−120
Point C: with residual=−10
Point D: with residual=+12
Point C, as it has the smallest residual.
In linear relationships, what is the concept of how linear regression finds the equation of the regression line?
Finding the one line that makes all the squared residuals the smallest.
In linear relationships, use the regression equation shown below to explain the change in Weight (in lbs) if Height (in inches) went up one inch?
Weight = −12.3 + (9) ∗ Height
Weight would go up 9 lbs.
In linear relationships, use the regression equation shown below to explain the change in Weight (in lbs) if Height (in inches) went up one foot?
Weight = −12.3 + 9 ∗Height
Weight would go up 108.0 lbs.
In linear relationships, use the regression equation shown below to explain the change in Weight (in lbs) if Height (in inches) went down 6 inches?
Weight = −12.3 + 9 ∗Height
Weight would go down 54.0 lbs.
In linear relationships, use the regression equation shown below to explain the change in Weight (in lbs) if Height (in inches) went up 12 inches?
Weight = −12.3 + (−9) ∗ Height
Weight would go down 108.0 lbs.
In linear relationships, use the regression equation shown below to predict the Price of a used car that was one year old?
Price = 45,000 + (−550) ∗ Months
Used car price = $38,400.
In linear relationships, use the regression equation shown below to find the residual of a two year old car with an asking price of $30,000?
Price = 45,000 + (−550) ∗ Months
Residual = -$1,800.
In linear relationships, use the regression equation shown below to predict if you would purchase a five year old car for $15,000?
Price = 45,000 + (−550) ∗ Months
Unlikely, as it would be $3,000 over the average price.
In linear relationships, use the regression equation shown below to predict the price of a 2.5 carat diamond?
Price = −2,416 + 8,896 × Carats
Price = $19,824.
In linear relationships, use the regression equation shown below to explain why a diamond price of -$2,416 is not an appropriate interpretation from the statistical perspective?
Price = −2,416 + 8,896 × Carats
A diamond of zero carats is outside the scope of the model.
In linear relationships, how is a residual found in linear regression?
The difference between the y-coordinate of the point and the y-coordinate on the regression line.
In linear relationships, a residual in a scatterplot is analogous to what term in a histogram?
A deviation.
In linear relationships, how is a residual in linear regression calculated?
Residual=yi-ˆy
In linear relationships, why does the sum of all the residuals in linear regression equal zero?
The positive and negative residuals cancel out in the sum.
In linear relationships, in concept how does the linear regression method of least squares find the equation of a regression line?
By minimizing the sum of the squared residuals.
In linear relationships, what does finding the regression line specifically mean in this book?
Find the values of the slope and y-intercept using the least squares equations.
In linear relationships, what is the importance to the data values for a variable relationship for a slope that is positive / is negative?
Data values move together / Data values move opposite.
In linear relationships, the regression equation shown below was calculated by hand using the two least squares equations. No other calculations were done. Does this regression equation give sample, or population, information?
y=10.5+1.25x
Sample information, as no t-tests about the population parameters were done.
In linear relationships, what are the two possible values for the population slope in simple linear regression?
The value of the sample slope or 0, since H0:β1=0.
In linear relationships, what is the meaning of the Standard Error of Regression / the Standard Error of the Slope?
Spread of the points around the regression line / Spread of all possible slopes.
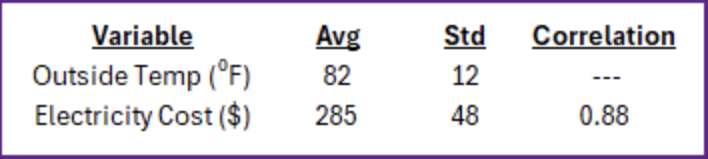
In linear relationships, use the information in the table below to choose an appropriate regression equation?
Cost = -3.64 + 3.52 * Temp.
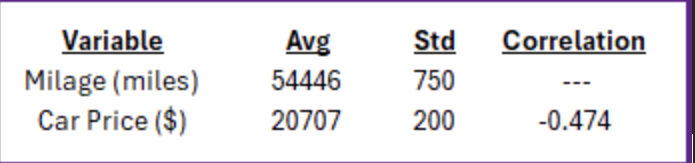
In linear relationships, use the information in the table below to find out if $20,500 is a good price to pay for a car with 50,000 miles?
Yes, the average price is expected to be $21,289.