MAS-I ISLR Conceptual Questions
1/156
There's no tags or description
Looks like no tags are added yet.
Name | Mastery | Learn | Test | Matching | Spaced | Call with Kai |
|---|
No analytics yet
Send a link to your students to track their progress
157 Terms
Indicate whether we would generally expect the performance of a flexible statistical learning method to be better or worse than an inflexible method
The sample size n is extremely large, and the number of predictors p is small
better - a more flexible approach will fit the data closer and with the large sample size a better fit than an inflexible approach would be obtained
Indicate whether we would generally expect the performance of a flexible statistical learning method to be better or worse than an inflexible method
The number of predictors p is extremely large, and the number of observations n is small
worse - a flexible method would overfit the small number of observations
Indicate whether we would generally expect the performance of a flexible statistical learning method to be better or worse than an inflexible method
The relationship between the predictors and response is highly non-linear
better - with more degrees of freedom, a flexible model would obtain a better fit
Indicate whether we would generally expect the performance of a flexible statistical learning method to be better or worse than an inflexible method
The variance of the error terms (siqma^2) is extremely high
worse - flexible methods fit to the noise in the error terms and increase variance
Problems with a quantitative response
Regression problems
Problems with a qualitative response
Classification problems
logistic regression is typically used with a qualitative (two-class or binary) response; can be used as classification method, but also regression
As model flexibility increases, what happens to the training MSE and test MSE?
Training MSE will decrease
Test MSE may not
Small training MSE & large test MSE means
we are overfitting the data; may be picking up some patterns that are just caused by random chance
regardless of overfitting, we almost always expect the training MSE to be smaller than the test MSE
reducible error
we can potentially improve the accuracy of the estimate of f by using the most appropriate statistical learning technique to estimate f
[f(X) - fhat(X)]^2
irreducible error
no matter how well we estimate f, we cannote reduce the error introduced by ɛ
var(ɛ)
parametric
non-parametric
no assumption about the form of f is made; estimate f that gets as close to the data points as possible without being too rough or wiggly
requires a very large number of observations to accurately estimate f
parametric potential disadvantage
the model we choose will usually not match the true unknown form of f
non-parametric disadvantage
since the do not reduce the problem of estimating f to a small number of parameters, a very large number of observations is required in order to obtain an accurate estimate for f
non-parametric advantage
potential to accurately fit a wider range of possible shapes for f
From high to low interpretability & low to high flexibility
subset selection
lasso
least squares
generalized additive models
linear regression comes after lasso, but before GAM
why would we ever choose to use a more restrictive method instead of a very flexible approach?
if we are mainly interested in inference, then restrictive models are much more interpretable
(linear model)
inference - what kind of model do we want?
inflexible because easier to interpret
want to better understand the relationship between the response and the predictors
prediction - what kind of model do we want?
more flexible, but not always most flexible; interpretability not of interest
aim is to accurately predict the response for future observations
supervised learning
for each observation of the predictor measurement(s), there is an associated response measurement
unsupervised learning
no associated response
cluster analysis
The expected test MSE
the sum of the variance, squared bias, and variance of the error terms
can never lie below var(ɛ)
More flexible methods have higher or lower varaince? higher or lower bias?
More flexible methods have higher variance and lower bias
As flexibility increases, bias tends to initially decrease faster than the variance increases (test MSE decreases), but then bias evens out, and variance significantly increases (test MSE increases)
Bias-variance trade-off
the relationship between bias, variance, and test set MSE
challenge lies in finding a method for which both the variance and the squared bias are low
advantages for a flexible approach
obtaining a better fit for non-linear models, decreasing bias
disadvantages for a flexible approach
requires estimating a greater number of parameters, follow the noise too closely (overfit), increasing variance
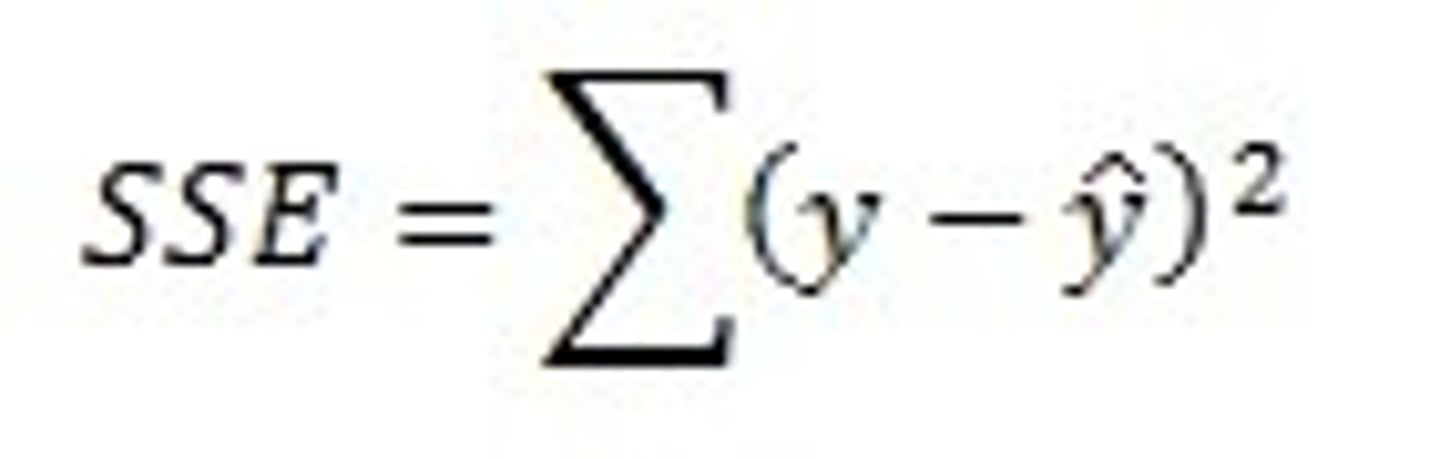
Residual Sum of Squares
the sum of each residual squared for all the observations in the sample. This reflects the amount of variation in the dependent variable not explained by the regression equation
least squares coefficient estimates for simple linear regression
Beta hat sub one
Beta hat sub zero
they characterize the least squares line
True or False: since the coefficient for an interaction term is very small, there is very little evidence of an interaction effect
False. We must examine the p-value of the regression coefficient to determine if the interaction term is statistically significant or not
polynomial regression vs. linear regression; underlying true relationship is linear; would you expect one training RSS to be lower/higher than the other?
I would expect the polynomial regression to have a lower training RSS than the linear regression because it could make a tighter fit against data that matched with a wider irreducible error (var(ɛ))
polynomial regression vs. linear regression; underlying true relationship is linear; would you expect one test RSS to be lower/higher than the other?
I would expect the polynomial regression to have a higher test RSS as the overfit from training would have more error than the linear regression
polynomial regression vs. linear regression; underlying true relationship is not linear, it's unknown; would you expect one training RSS to be lower/higher than the other?
polynomial regression still have lower train RSS than the linear fit because of higher flexibility, no matter what the underlying true relationship is; the more flexible model will closer follow points and reduce train RSS
polynomial regression vs. linear regression; underlying true relationship is not linear, it's unknown; would you expect one test RSS to be lower/higher than the other?
Not enough info to tell; whichever model the underlying relationship is closer to could have the lower RSS
logistic regression
p(X) = e^betas / ( 1 + e^betas)
log(p(X) / (1-p(X)) = betas
odds --> probability
odds = prob / ( 1 - prob)
What is the probability that the first bootstrap observation is not the jth observation from the original sample?
the probbability that the jth observation is selected as the first bootstrap observation is 1/n
therefore the probability that the jth observation is not the first bootstrap observation is 1-(1/n)
what is the probability that the 2nd bootstrap observation is not the jth observation from the original sample
1-(1/n)
bootstrap sampling is sampling with replacement
probability that the jth observation is not in the bootstrap sample
(1-1/n)^n
probability the the jth observation is in the bootstrap sample
1-(1-1/n)^n
probability the the jth observation is in the bootstrap sample tends to...
(limit)
1-1/e
Explain how kk-fold cross-validation is implemented
The data is segmented into kk distinct, (usually) equal-sized 'folds'. A model is trained on k−1k−1 of the folds and tested on the remaining fold. This process is repeated kk times, such that each of the kk folds acts as the test data once. The test performance is recorded and averaged, giving the 'cross-validation' or 'out-of-sample' metric.
What are the advantages of k-fold cross-validation relative to the validation set approach?
k-fold CV has much lower variability, and all the data is used to both train and test model performance
the validation set approach can over-estimate the test error
What are the disadvantages of k-fold cross-validation relative to the validation set approach?
The validation set approach is conceptually easier to grasp and has a computational advantage - a model is trained once and tested once (less time consuming)
What are the advantages of k-fold cross-validation relative to LOOCV?
k-fold CV is less computationally demanding
bias-variance tradeoff (LOOCV has lower bias but higher variance)
What are the disadvantages of k-fold cross-validation relative to LOOCV?
k-fold cv has an element of randomness
loocv can require less computational power in some cases (least squares regression)
Suppose that we use some statistical learning method to make a prediction for the response YY for a particular value of the predictor XX. Carefully describe how we might estimate the standard deviation of our prediction.
The bootstrap approach would be appropriate here. If the original data contains n observations, we create B bootstrap samples from the data (sampling n observations with replacement, repeated B times). On each of these datasets, we would then train a supervised learning method and use it to make our estimate for the 'particular value of X'. Once we have these B estimates, we can calculate the standard deviation of them. Doing so provides the bootstrap estimate for the standard error of our estimate.
We perform best subset, forward stepwise, and backward stepwise selection on a single data set. For each approach, we obtain p + 1 models, containing 0, 1, 2, . . . , p predictors.
Which of the three models with k predictors has the smallest training RSS?
The smallest training RSS will be for the model with best subset approach. This is because the model will be chosen after considering all the possible models with k parameters for best subset. This is not true for either backward stepwise or forward stepwise.
We perform best subset, forward stepwise, and backward stepwise selection on a single data set. For each approach, we obtain p + 1 models, containing 0, 1, 2, . . . , p predictors.
Which of the three models with k predictors has the smallest test RSS?
Can't say
We perform best subset, forward stepwise, and backward stepwise selection on a single data set. For each approach, we obtain p + 1 models, containing 0, 1, 2, . . . , p predictors.
TRUE/FALSE: The predictors in the k-variable model identified by forward stepwise are a subset of the predictors in the (k+1)-variable model identified by forward stepwise selection.
TRUE
We perform best subset, forward stepwise, and backward stepwise selection on a single data set. For each approach, we obtain p + 1 models, containing 0, 1, 2, . . . , p predictors.
TRUE/FALSE: The predictors in the k-variable model identified by backward stepwise are a subset of the predictors in the (k + 1)- variable model identified by backward stepwise selection.
TRUE
We perform best subset, forward stepwise, and backward stepwise selection on a single data set. For each approach, we obtain p + 1 models, containing 0, 1, 2, . . . , p predictors.
TRUE/FALSE: The predictors in the k-variable model identified by backward stepwise are a subset of the predictors in the (k + 1)- variable model identified by forward stepwise selection.
FALSE
We perform best subset, forward stepwise, and backward stepwise selection on a single data set. For each approach, we obtain p + 1 models, containing 0, 1, 2, . . . , p predictors.
TRUE/FALSE: The predictors in the k-variable model identified by forward stepwise are a subset of the predictors in the (k+1)-variable model identified by backward stepwise selection.
FALSE
We perform best subset, forward stepwise, and backward stepwise selection on a single data set. For each approach, we obtain p + 1 models, containing 0, 1, 2, . . . , p predictors.
TRUE/FALSE: The predictors in the k-variable model identified by best subset are a subset of the predictors in the (k + 1)-variable model identified by best subset selection.
FALSE
The lasso, relative to least squares, is
Less flexible and hence will give improved prediction accuracy when its increase in bias is less than its decrease in variance.
Ridge regression, relative to last squares, is
Less flexible and hence will give improved prediction accuracy when its increase in bias is less than its decrease in variance.
Non-linear methods, relative to least squares, is
More flexible and hence will give improved prediction accuracy when its increase in variance is less than its decrease in bias
Ridge regression tends to give similar/different coefficient values to correlated variables
similar
Lasso tends to give similar/different coefficient values to correlated variables
different
basis function
smoothing splines
result from minimizing a residual sum of squares criterion subject to a smoothness penalty
local regression
similar to splines, but the regions are allowed to overlap in a very smooth way
polynomial regression
extends the linear model by adding extra predictors, obtained by raising each of the original predictors to a power
generalized additive models
extend the methods above to deal with multiple predictors
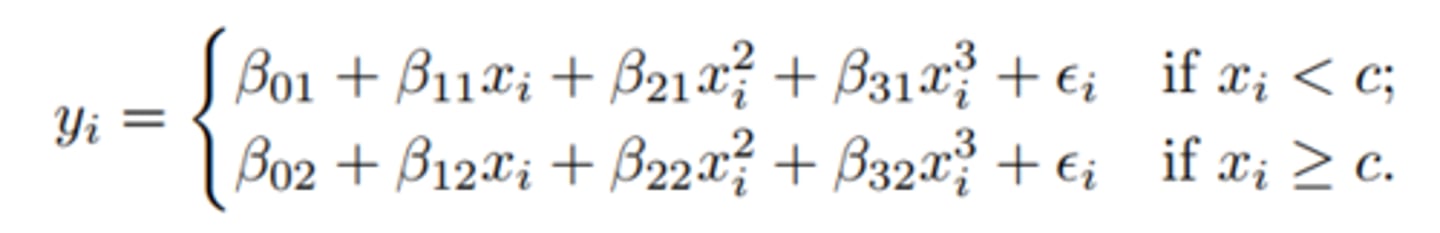
piecewise polynomial regression
involves fitting separate low-degree polynomials over different regions of X
picture = a piecewise cubic polynomial with a single knot at a point c
knots
The points where the coefficients change
more knots = more flexible piecewise polynomial
cubic spline
k+4 df's
degree-d spline
a piecewise degree-d polynomial, with continuity in derivatives up to degree d-1 at each knot
T/F
The lasso is equivalent to assuming a prior distribution for each of the slopes that is double-exponential (laplace) with mean zero
True
T/F
One can use cross-validation to select the best value of the tuning parameter λ
True
T/F
We expect the lasso to perform better than ridge regression in a setting where a relatively number of predictors have substantial coefficients
True
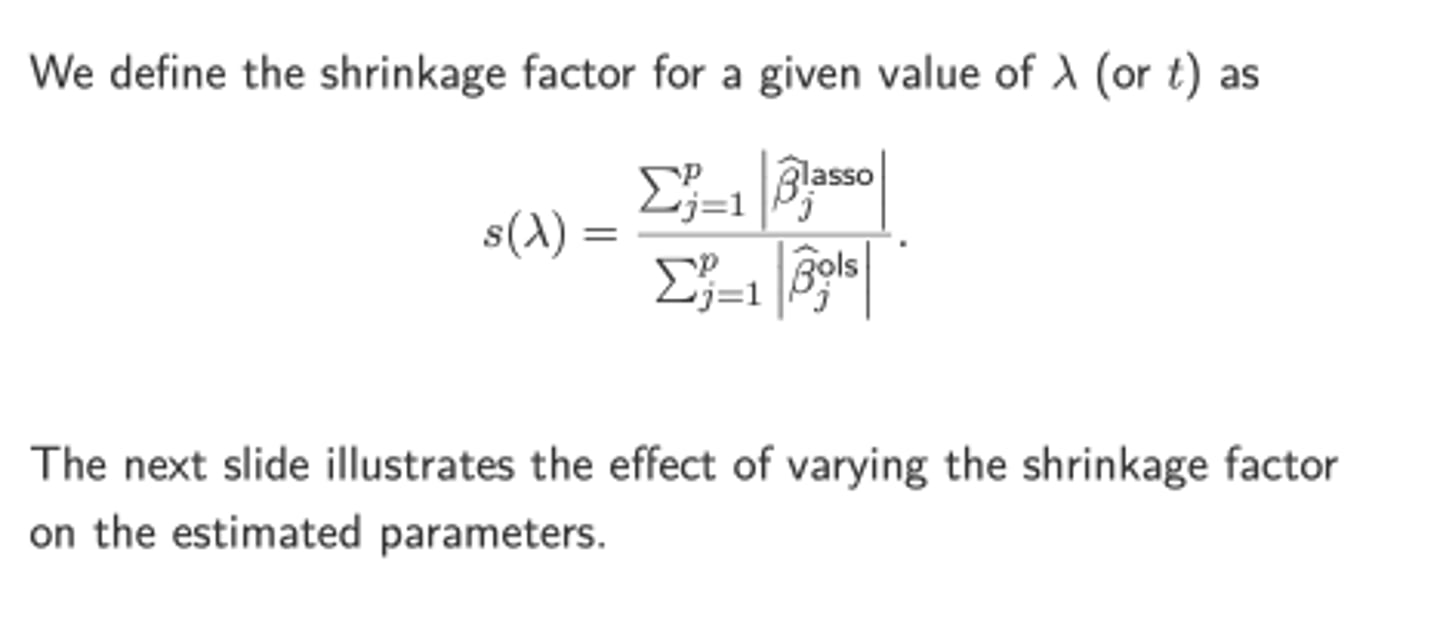
T/F about Lasso
The larger the ratio (see picture; ignore OLS), the less flexible the model
False
Larger values of this ratio correspond to a smaller tuning parameter, λ, and thus a more flexible model
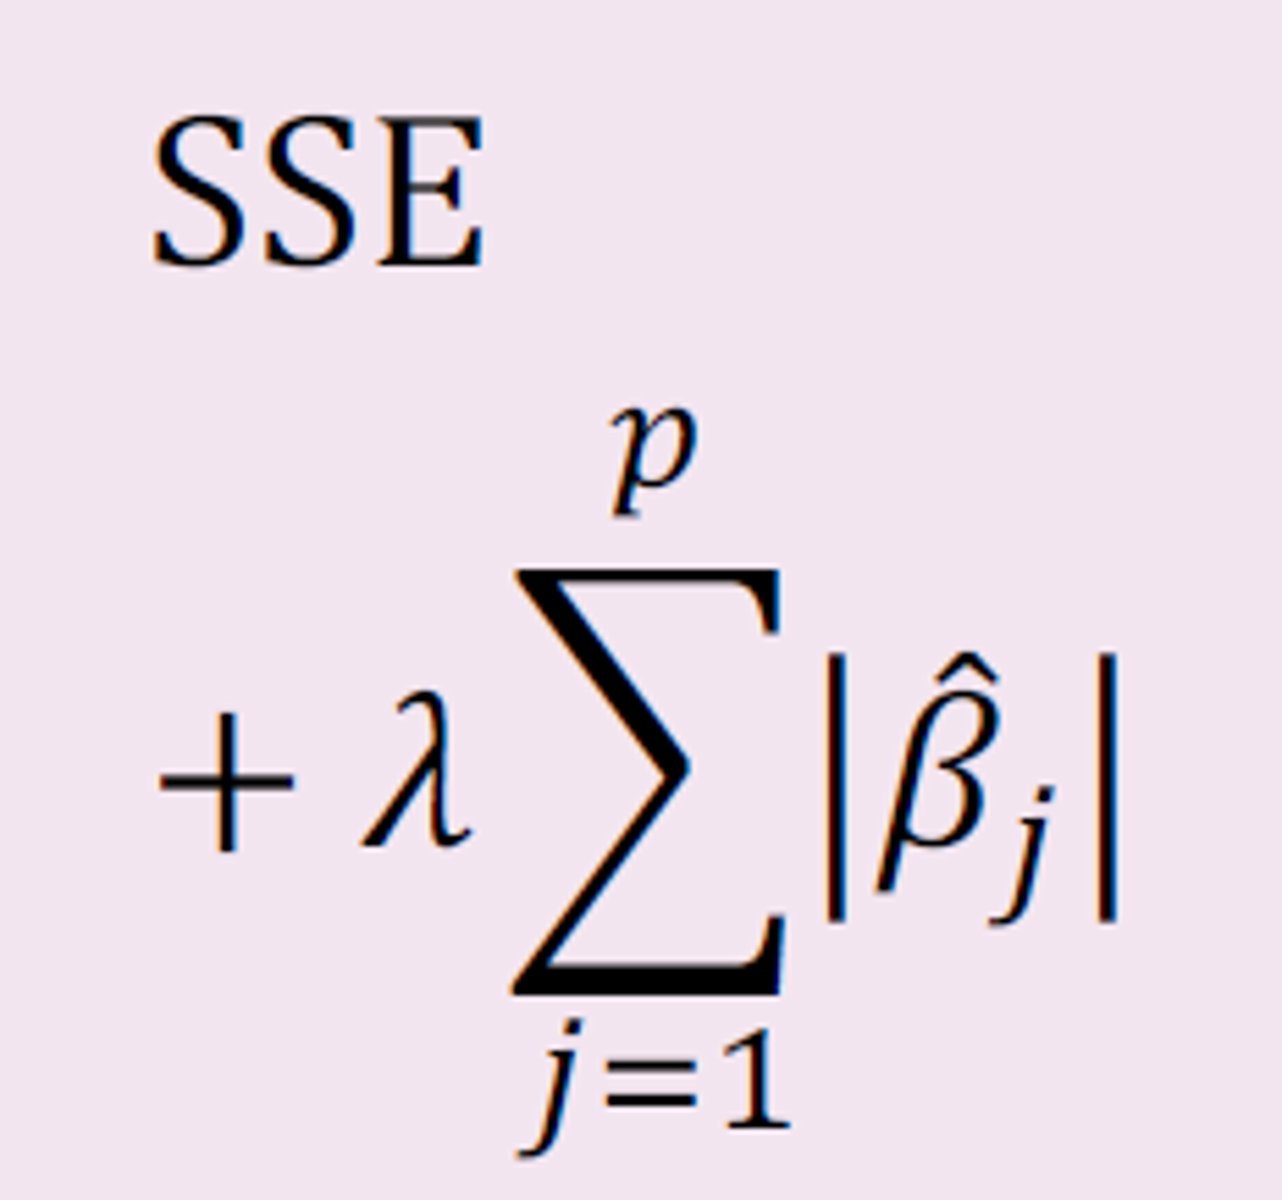
T/F about Lasso
A penalty term (second term in picture) is added to the residual sum of squares; the sum is minimized
TrueA
AIC is best for nested or non-nested models? With the same number or different number of parameters?
AIC is best for non-nested models with different number of parameters
Deviance is best for nested or non-nested models?
Deviance is best for nested models
The pearson chi-squared statistic, likelihood ratio chi-squared statistic and the pseduo-R^2 statistic are best for nested or non-nested models? With the same number of different number of parameters?
The pearson chi-squared statistic, likelihood ratio chi-squared statistic and the pseduo-R^2 statistic are best for non-nested models with the same number of parameters
T/F
If theta-hat is an unbiased estimator of theta and the variance of theta hat = 1/n, it must be a consistent estimator of theta
TRUE
If we have something that's unbiased, then it's going to be asymptotically unbiased
T/F
If theta-hat is a consistent estimator of theta, it must be an unbiased estimator of theta
FALSE
T/F
If theta-hat is a biased estimator of theta, it is not a consistent estimator of theta
FALSE
We can have a biased estimator that is consistent (i.e. xbar + 1/n)
T/F
If we have asymptotically unbiases then we have consistency
TRUE
T/F
Regression splines normally produce more stable results than polynomial regression
True
Regression splines can increase flexibility by increasing knots, but keeping the degree of X fixed at for example 3 in cubic splines
T/F
The more knots, the more flexible is a regression spline
True
T/F
The natural cubic spline avoids the variance in the tails of the (ordinary) cubic spline
True
The natural cubic spline has the constraint that it is linear below the first knot and above the last knot
Polynomial Regression Disadvantage
In order to get more flexibility, we have to use higher powers of X
T/F
The first principal component direction of the data is that along which the observations vary the most
TRUE
T/F
PCR often leads to overfitting
False
PCR usually reduces the number of dimensions; this reduces the tendency to overfit the the model
T/F
PCR assumes the the directions in which the features show the least variation are the directions that are associated with the target
False
the most variation
T/F
PLS is useful for performing feature selection
False
PLS identifies linear combinations of the features that not only approximate these features well, but also that are related to the response
Neither is PCR
An influential point has...
A large absolute value of the standardized residual AND a large leverage
T/F
It is common and expected that the residual series will be autocorrelated
True
T/F
Using least squares fitting, for a positive serial correlation in the residual series, the standard errors of the estimated parameters are likely underestimated
True
T/F
For a positive serial correlation in the residual series, the confidence intervals for parameters using Generalized Least Squares will be narrower than those using least squares.
False
Wider
GLS corrects the underestimate of the standard errors made by least squares
T/F
Usually k-fold cross-validation is less computationally intense than LOOCV with k < n
True
LOOCV fits the model n times
k-fold fits the model k times
T/F
LOOCV tends to overestimate the test error rate in comparison to k-fold cross-validation when k < n
False
k-fold overestimates more
Heteroskedastic
The variance of the error term given the independent variable, x, is not constant
Homoskedasticity
the pattern of the covariation is constant (the same) around the regression line, whether the values are small, medium, or large
T/F with respect to high-dimensional situations
Regularization or shrinkage plays a key role
True
T/F with respect to high-dimensional situations
For ridge regression or the lasso, choosing the tuning parameter is crucial
True
T/F with respect to high-dimensional situations
The test MSE increases as the dimensionality of the problem increases, unless the additional predictors are truly associated with the response
True
Local Regression T/F
At each point in the original data, one fits a weighted least squares regression using only a fraction of the observations
True
Local Regression T/F
One could use the Gaussian (Normal)kernel to determine the weights used in the local regression
False