ECON 101- midterm 2
1/128
There's no tags or description
Looks like no tags are added yet.
Name | Mastery | Learn | Test | Matching | Spaced | Call with Kai |
|---|
No analytics yet
Send a link to your students to track their progress
129 Terms
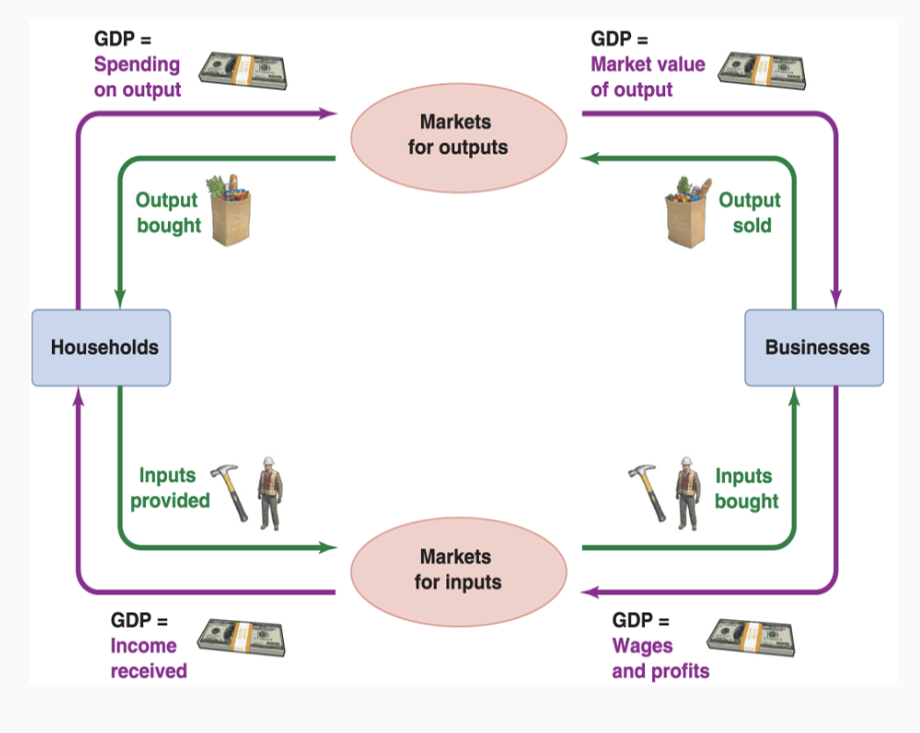
circular flow diagram
model showing how households and businesses in the economy are linked
Green - flow of real resources
Purple - flow of money
Flows must be going opposite directions
the price of total output = total spending
total we spend = total income we recieve
GDP
the market value of all final goods and services produced within a country in a given year
GDP per capita
how much money would each person have?
GDP per capita = GDP / total population
What does GDP really measure
total spending —> how much did everyone spend?
total output —> how much did everyone produce?
total income —> how much did everyone earn?
Expenditure equation
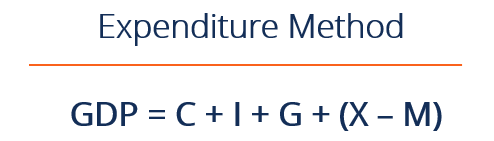
Consumption
house hold spending on final goods and services
ex: rent, food, gas, doctors visits, durable goods (cars/stoves/etc)
Investment
spending on things that improve the economy ability to produce
Ex: office buildings and factories, buying airplanes and office computers. spending money on research, buying a new home
***NOT STOCKS
Government purchases
Gov buys goods or assets
Ex: maintaining roads, spending on schools, paying teachers
Transfer payment
payments that transfer income from one person to another
Ex: social security, unemployment insurance
they spend that money and THEN it gets counted into GDP
Net exports
spending on exports MINUS imports
exports: produced domestically, purchased by foreign buyers
Imports: produced in another country, purchased by domestic buyers
***imports not included because we just want to know what we are making
value added
amount by which the value of an item increased at each stage of production
VA = total sales - cost of intermediate inputs
Ex: Apple bought components for iphone for $400, makes and sells it for $900 —> Apple added $500 of value
Income
what we buy stuff with
Profits- income that we spend on businesses
Wages- the income workers receive
Problem with GDP
meant to capture the value of everything we produce in a country through prices
BUT prices change over time
Real GDP
GDP measured in constant prices (accounts for inflation)
how much real stuff we have (as opposed to money) so we can see if our economy has grown in value
Calculating real GDP
find average price between 2 years
compute GDP for both years using average prices
Growth calculation
Growth = 100 x (Real GDP this year - Real GDP last year) / Real GDP last year
Short term (year or two) growth calculation
% change in real GDP = % change in nominal GDP - % change in prices
Rule of 70
How long it takes the economy to double if that growth rate persist
Time to double = 70 / growth rate
production function
methods by which inputs are transformed into output
ex: how labor and parts turn into a car
aggregate production function
how much of everything a country can produce
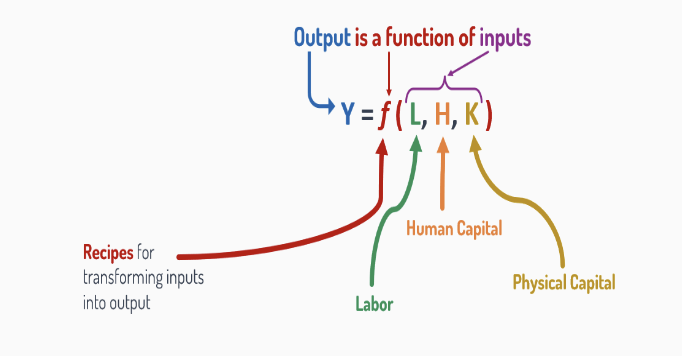
labor
more labor a country has, the more stuff it can make
***population growth boosts GDP, but not GDP per capita
human capital
the accumulated knowledge and skills that make workers more productive
ex: educated workers
leads to GDP and GDP per capita growth
physical capital
the physical tools, machinery, and structures that are used in the production process
more computers, machines, etc means that one worker can produce more stuff
technological progress
new methods for using existing resources
aka growth is possible, even if we don’t increase population, education level, or capital stock
aggregate production function has constant returns to scale
double all three inputs and we get twice as much output
capital (by itself) has diminishing returns:
if you add more capital to the economy, holding the population constant, the growth in output will get smaller
EX: giving every worker a computer increases GDP by a lot, but a 2nd computer wont
poor countries can catch up
countries that havent yet invested in capital have much more potential growth to unlock'
Solow model
capital stock can only grow up to a certain point- every year, some of our capital stock stops working; must replace and then add even more for it to grow
physical capital per workers cant grow forever- the more capital we have, the more capital depreciates each year
Capital accumulation cannot sustain long-term growth- the economy reaches a steady state and the capital per person will reach equilibrium
What leads to technological innovations that drive growth
effective property rights
efficient regulation
government stability
encouraged innovation
working age population
those 16 and older who are not in the military or institutionalized
aka the potential labor force
employed
working age people who work for money
part time and full time
unemployed
working age people who are trying to get a job
some people are neither employed nor unemployed
retired people
teenagers finishing highschool
lottery winners
stay at home parents
labor force
the unemployed and the employed together
Labor force participation rate
percentage of the working age population that is employed or unemployed
tells us how many potential workers are active in the labor market
LFPR = 100 x (employed + unemployed) / working age population
high LFPR = more labor available to make stuff with
unemployment rate (Ur)
the percentage o the labor force that is unemployed
Ur = 100 x unemployed / labor force
the employment situation
monthly update on how the labor market in the US has chnaged since last month
found through household survey (asks some households if anyone lost/found a job) and establishment survey (ask 12,000 businesses about their payroll)
Explain the labor market
it is dynamic! —> in constant change
unemployment is never 0%
tight vs loose labor market
loose = high unemployment —> if there are a lot of unemployed people, you cant really negotiate or a big raise
tight = low unemployment —> hard to replace your workers, so they have more negotiating power
frictional unemployment
caused by the time it tkae for employers to searcg for the right worker and workers to search for the right job
needed to find quality matches between employers and workers
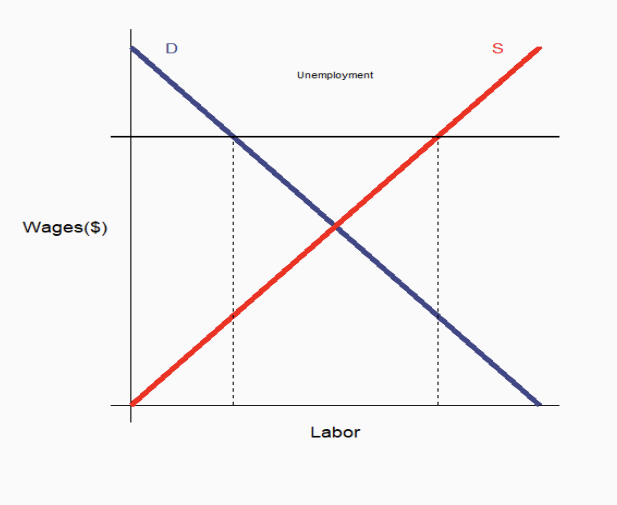
structural unemployment
unemployment that occurs because wages do not or cannot fall to bring labor supply and demand into equilibrium
the structure of the labor market makes it hard for someone to find a job
ex: jobs that are no longer needed —> girls who put you on the right call line
efficiency wages
causes structural unemployment
when employers pay workers exra in order to induce workers to be more productive
ex: McDonalds workers who are paid min wage don’t really care how good they do
job protections
causes structural unemployment
regulations that make it harder for firms to fire workers —> firms hire less workers, more slowly
labor market disrcimination
causes structural unemployment
when individual workers with identical productivity are treated inferior because of their demographics
Minimum wage
a price floor setting a minimum price for selling labor
price floor = persistent surplus —> persistent unemployment
Why won’t unemployment ever be 0%?
because of structural and frictional unemployment
both create the natural rate of unemployment- typical rate of unemployment when the economy is growing normally
cyclical unemployment
unemployment due to a temporary downturn in the economy
worker and business are the right match, but the economy isn’t strong enough for businesses to hire —→ workers face the most damage
Costs of unemployment
lower wages and worse career opportunities
longer unemployed = more likely to be permanently unemployed
imposes negative externalities: more gov spending, increased partner violence, etc
inflation
a generalized rise in the overall level of price
inflation ≠ high prices —> high prices are a result of inflation
typically measured on a yearly basis
Inflation rate
annual percentage increase in the average price level
inflation = 100 x (price level this year - price level last year) / price level last year
consumer price index (CPI)
an index that tracks the average price consumers pay over time for a “basket” of goods and services
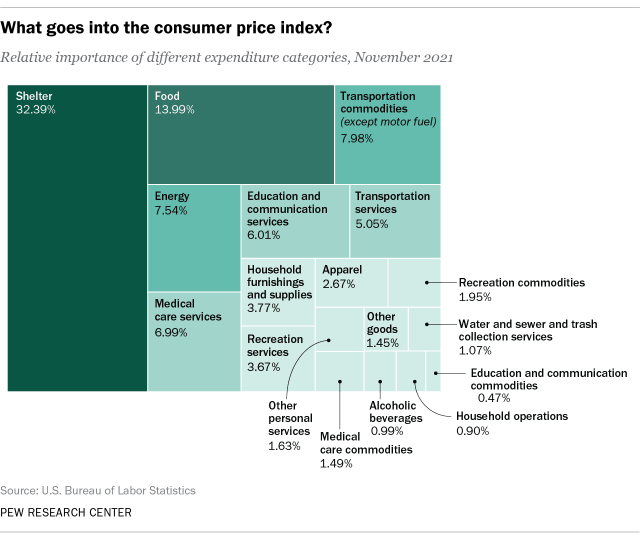
finding CPI
construct basket: include groceries, rent, medical expenses, durables, services, etc
find the prices: ask thousands of stores how much the basket costs
tally the cost of the basket: add up the costs, accounting for the amount each thing is pruchase (rent takes up larger part than car)
Index: turn these numbers into an index by choosing a base year and seeing on much the cost has changed (100 x basket cost this year / cost during base year)
use CPI to calculate inflation between two years
(new year - old year) / old year x 100
deflation
a generalized fall in the overall level of price
what doesnt CPI tell us
can only measure price changes for existing goods (people in 1985 didnt have smart phones, so how do we compare?)
Quality improvements hide price increases: prices go up, not because of inflation, but because of improvements
people change their baskets when prices rise: a lot of people substitute away from goods that experience the most inflation
indexing
adjusting wages, social sercurity, taxes, etc, to compensate for inflation
GDP deflator
a price index that includes everything the economy produces
used to calculate real GDP between years
calculating GDP deflator
pick a base year
use prices from the base year to calculate real GDP in another year
take nominal GDP in that other year, divide by the real GDP from step 2
multiply by 100
calculating real GDP
real GDP = 100 x (nominal GDP / GDP deflator)
Money illusion
the mistaken tendency to focus on nominal dollar amounts instead of inflation adjusted amounts
if the price of everything goes up (including wages), inflation doesnt really hurt anyone
Purposes of money
is a medium for exchange: makes transactions simple
a unit of account: can easily measure relative values (a car is worth X amount of eggs)
is a store value: can turn production today into savings for the future
consequences of persistently high inflation
creates menu costs for businesses: the marginal cost of adjusting prices (adjusting signs, reprinting menus, changing software, etc); if inflation is high, businesses need to do this more often
creates shoe-leather costs for buyers: costs incurred to avoid holding cash (banks raising interest rates to discourage saving)
confuses price signals: does increased spending mean that a item is more valuable? —> businesses increases production and lose money
it redistributes between lenders and borrowers: loans change
hyperinlation
extremely high rates of inflation
erodes all functions of money —> society loses trust for transactions, savings, etc
business cycle
short-term fluctuations in economic activity
parts of business cycle
peak- high point of economic activity
recession- a period of falling in economic activity
trough- a low point in economic activity
expansion- a period of rising economic activity
when do new business cycles start
when expansion ends and the economy peaks, and then a new recession begins
potential output
the level of output that occurs when all resources are fully employed
economy is operating at a healthy limit (unemployment at a natural limit, no resources being wasted, capital is used productively)
output gap
the difference between actual and potential output, measured as a percentage of potential output
output gap = 100 x (actual - potential) / potential
negative vs positive output gap
neg- economy is producing less than potential (under using resources)
pos- economy is producing more than its potential (resources are over used)
Boom
economy is operating above sustainable potential
ex: workers pulling overtime, factories putting off repairs, etc
Bust
economy us operating below sustainable potential
ex: excess unemployment, unused factories/machinery
Business cycles aren’t natural cycles
we cannot predict recessions (or expansions) based on how long the current business cycle has lated
causes of recssion
typically caused by adverse shock to the economy —> a negative event that temporarily pushes us off the path of growth
ex: pandemics, government policy, bank runs, etc
characteristics of business cycles
recessions are shorts and sharp; expansions are long and gradual
business cycle is persistent: economic conditions today are closely tied to economic conditions in the near future
the impact is widespread: impacts the whole economy, not just isolated parts (when GDP falls, employments typically falls too)
leading vs lagging indicator
leading- variables that tend to predict the future path of the economy (stock market, confidence indicators, etc)
lagging- variables that tend to follow the business cycle with delay
how to look at macroeconomic data
focus on real (not nominal) data
always try to compare apples to apples: DON’T compare nominal and real variable
pay attention to revisions (changes)
be aware of seasonally adjusted data: employment always rise in December, so it will fall in January
Nominal exchange rate
the price of currency, in terms of another country’s currency
how many of my dollars do i need to give to you to get one euro
How to calculate nominal exchange rate
Nominal exchange rate of euros (in dollars) = number of dollars going one way / number of euros coming back the other way
aka: dollar per euro
Quantity in AD-AS model
total quantity of output produced in the economy as a whole
measured by real GDP
apprecaition
when the price of a currency rises
if you have that currency, it is more valuable / more expensive
it makes it easier to import (your dollars buy more from other countries)
exports are more expensive for other countries (their dollars buys less of your stuff)
depreaction
when the price of a currency falls
ex: euros are less expensive
price in AS-AD model
the average price level of all the output produced in the economy
measured by GDP deflator
macroeconomic equilibrium
occurs when the quantity of output that buyers plan to purchase equals the quantity of output that suppliers collectively produce at a given price level
where AS meets AD
Aggregate demand curve
the relationship between price level and total quantity of output that buyers collectively plan to purchase
slopes downwards due to decisions about spending today vs spending tomorrow
if components that make up GDP increase in price, people do them less, and decrease GDP
wealth effects
when price levels rise, wealth loses value and consumption falls (more money to buy the same thing)
when price levels fall, wealth gains value and consumption today rises
interest rate effects
when price level rises, interest rates rise —> investment becomes more costly, less money in economy
exchange rate effects
when price levels rise, other countries don’t want to buy those higher priced goods and will buy them from other countries
effects of price level on AD
changes in price level causes movement along AD curve, NOT SHIFTS
Shifts in AD line
caused by anything that changes components of GDP
consumption and investment change when business/consumer confidence changes
government spending rises whenever policymakers decide to spend more
the federal reserve can change interest rates to make spending today more/less attractive
exports change whenever global forces change the competitiveness of American products
increase vs decrease to shifts in AD
increase in GDP = shift right/up
decrease in GDP = left/down
aggregate supply curve
relationship between the price level and the total quantity o output that suppliers collectively plan to produce
slopes upwards
high price level leads sellers to produce larger quantity of output
sticky prices
cause AS to slope upwards
prices tend to adjust sporadically and sluggishly to changing market conditions
sticky wages- wages tend to adjust sporadically and with delay; no one demands a raise when the price of eggs went up by 0.1%
menu costs- business have a marginal cost to change output prices, making output prices sticky; some businesses cannot afford to raise their prices instantly
how price level changes effect AS
they do not shift AS
cause movement along the AS curve
direction of shifts in AS
shift right/down- create more output at the same price
shift left/up- sell the same output at a lower price
what causes shifts in AS curve
higher input prices raise production costs
higher import prices raise production costs
weaker productivity raises production costs
when currency depreciates, import costs and production costs rise
monetary policy
setting interest rates in an effort to influence economic conditions, usually done by central banks
by changing rates = influencing AD curve
The Fed’s job
maintain stable prices: influences prices so inflation doesnt overly influence peoples economic decision making
promote maximum (sustainable) employment: can increase real GDP = more employment
AD shifts with the Fed
raises interest rates = AD shifts left (spend less now and more later; dampens inflation, but lower output)
What is the federal reserve
made up of 12 district banks spread across the country
makes decisions independently (gov does not dictate policy to the Fed)
is subject to government oversight (gov has big-picture control over fed)
FOMC (federal open market committee)
committee that decides US interest rates, made up of 7 Fed governors and the Fed bank presidents
durning meeting, they debate their forecasts of the economy and vote on monetary policy
hawks: tighter monetary policy to temper inflation
doves: looser monetary policy to support growth
shares their agreements to the public clearly, to prevent any miscommunication