Econ Exam 3 - ch. 13
1/36
There's no tags or description
Looks like no tags are added yet.
Name | Mastery | Learn | Test | Matching | Spaced | Call with Kai |
|---|
No analytics yet
Send a link to your students to track their progress
37 Terms
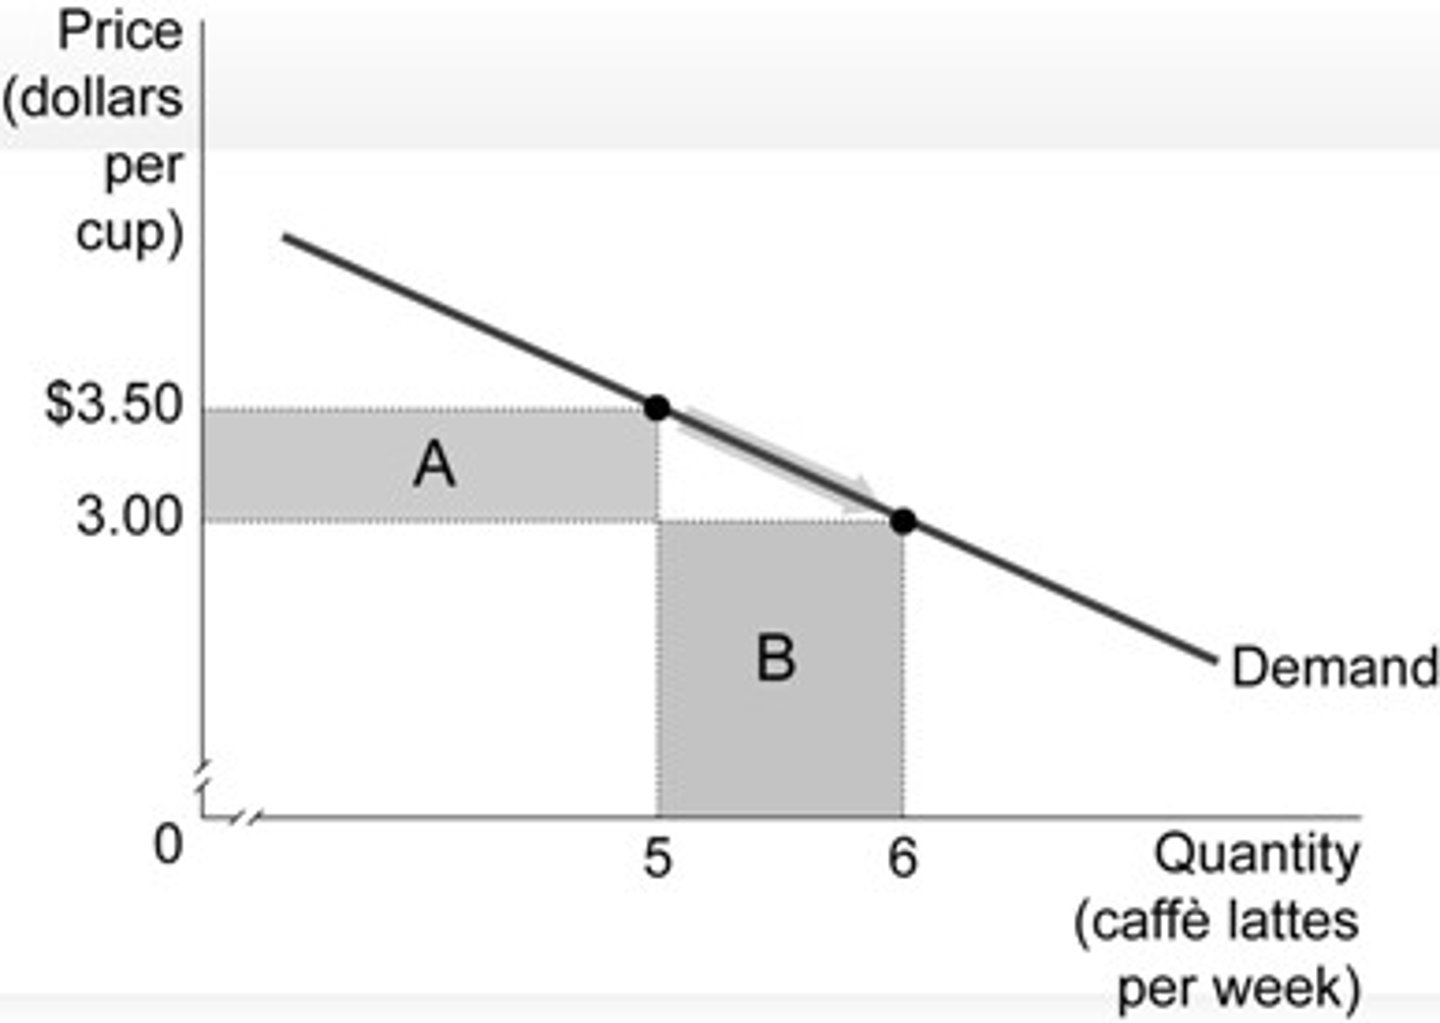
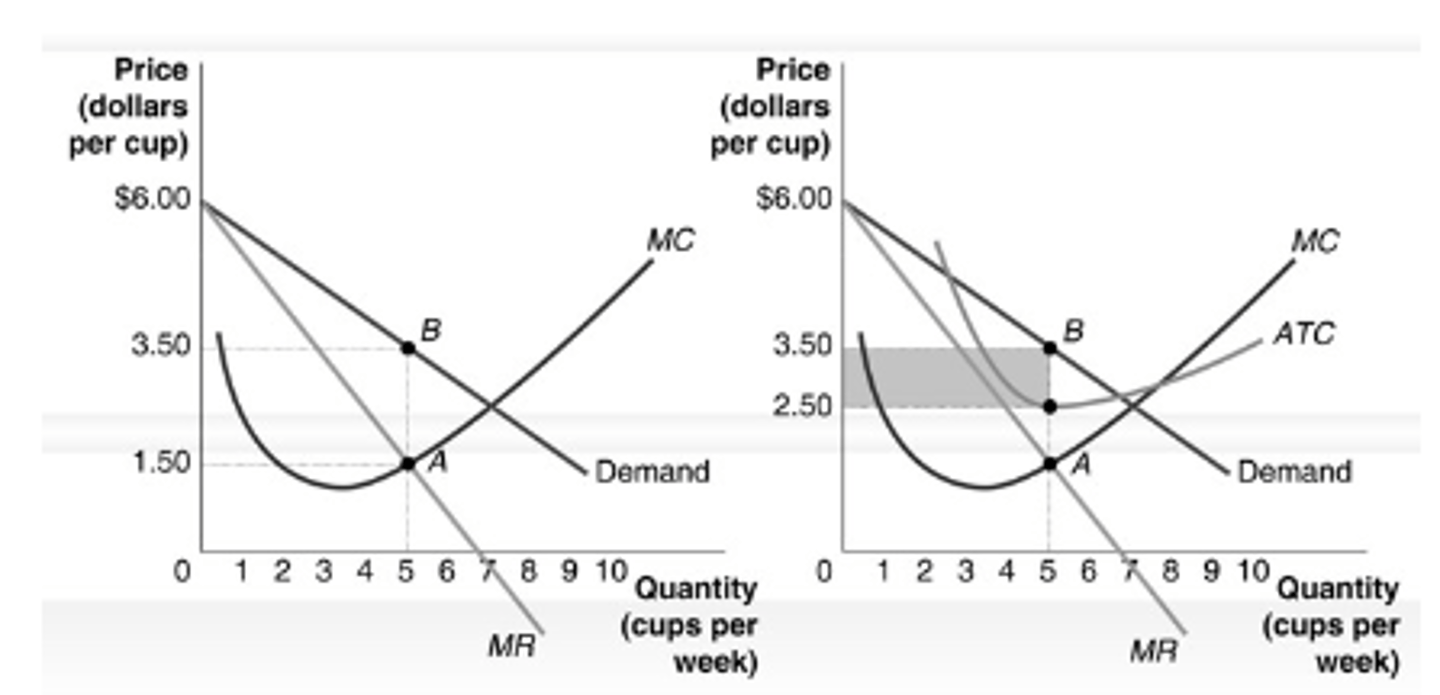
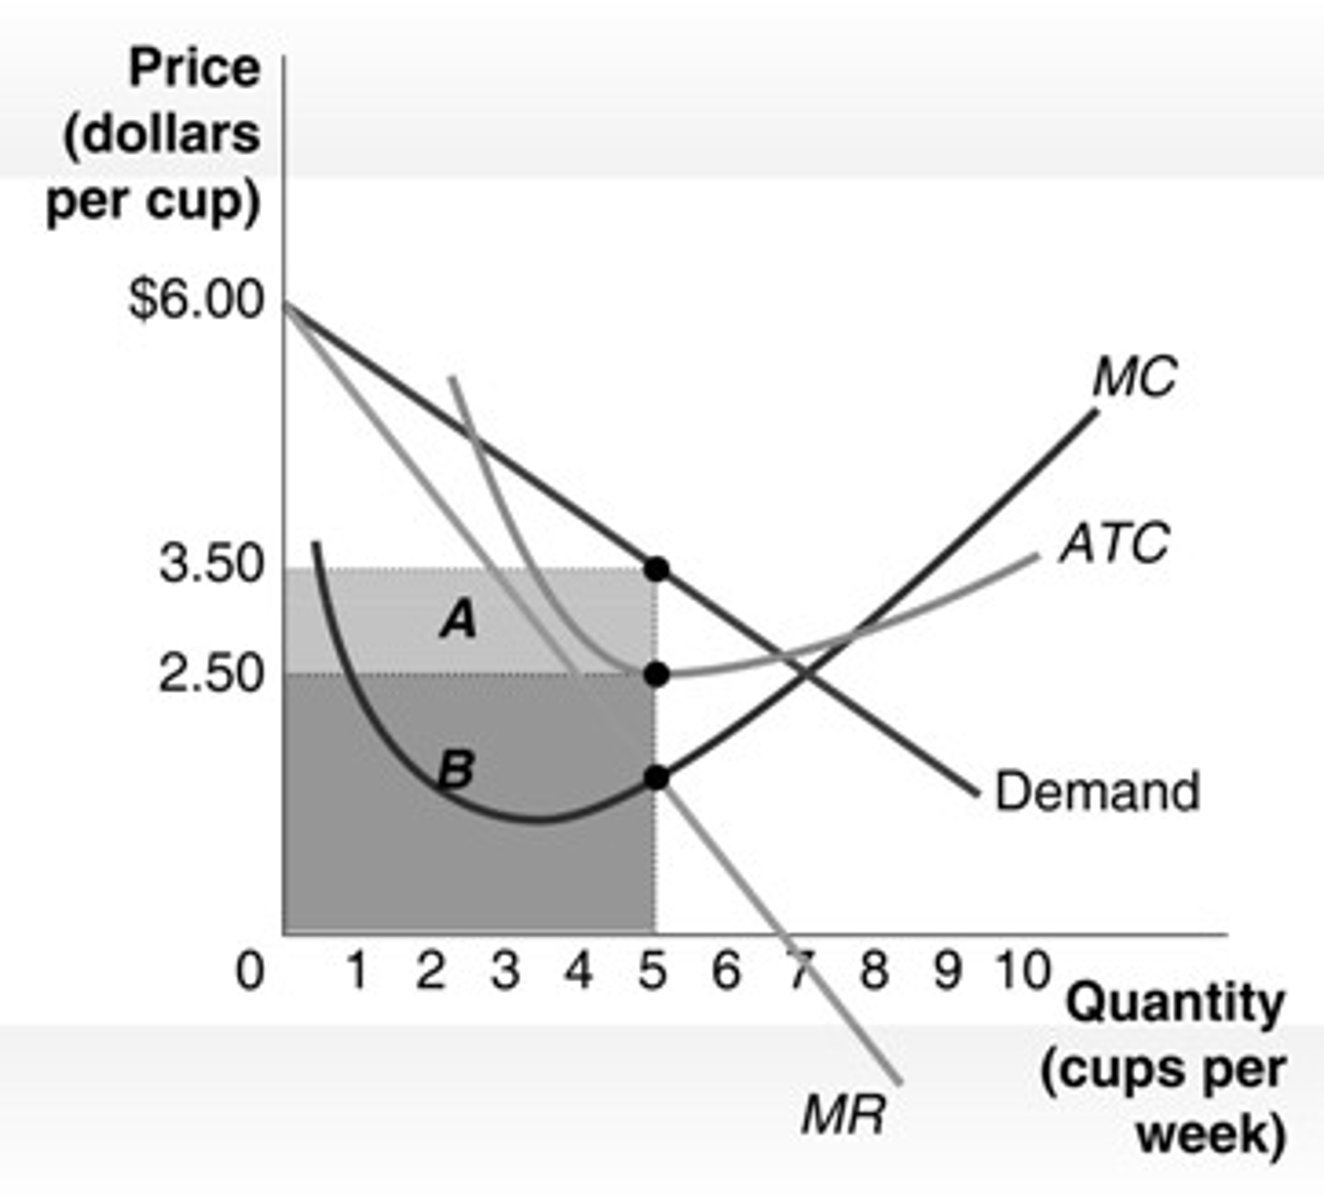
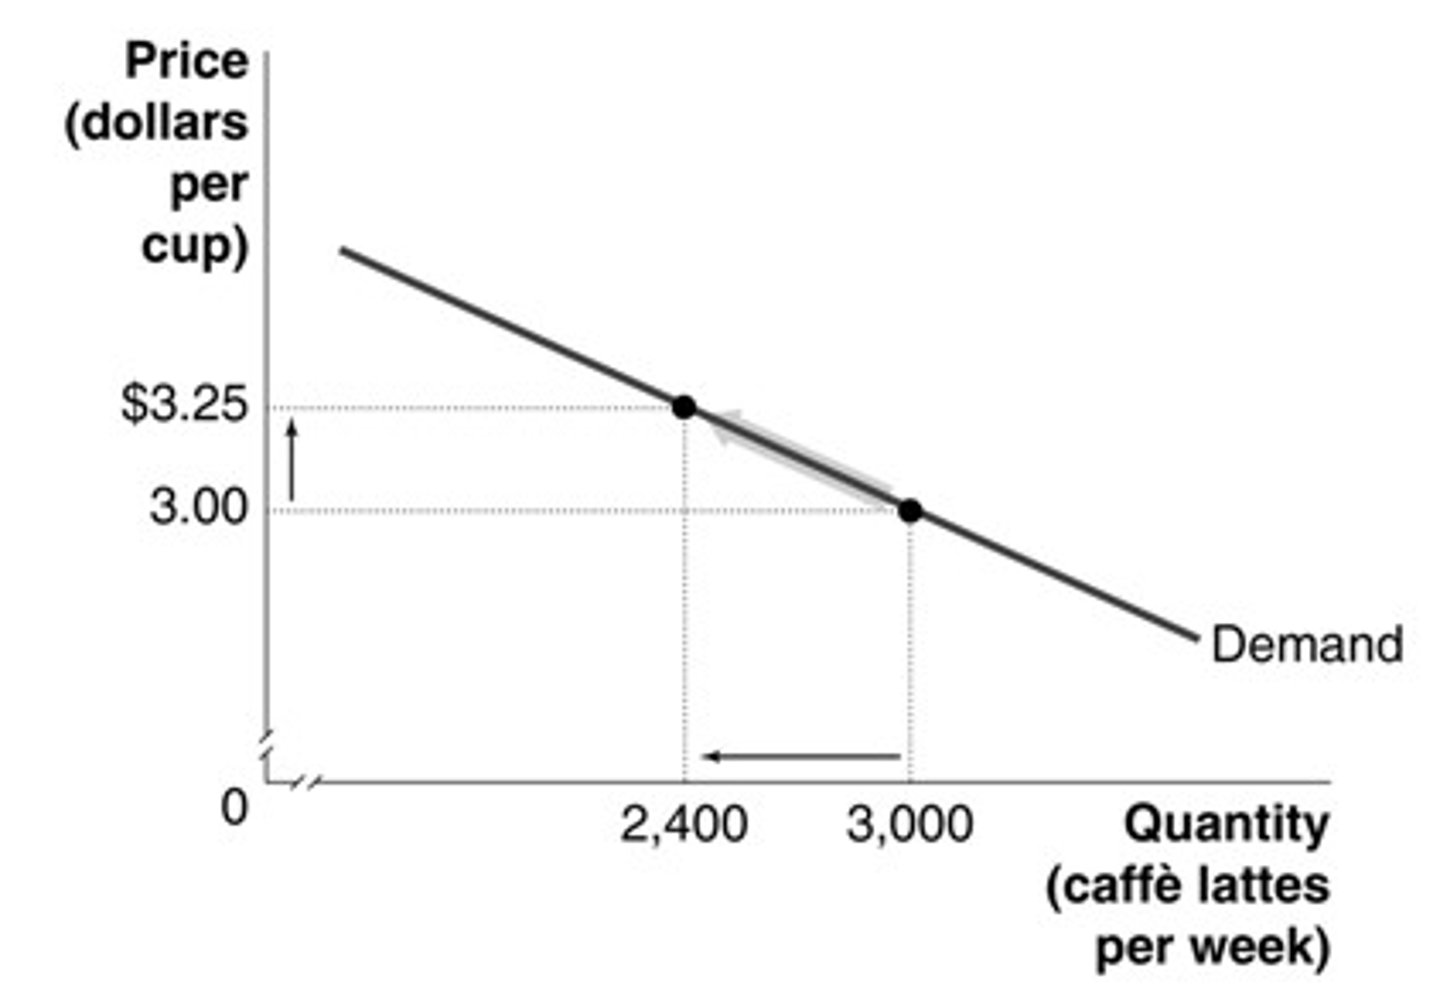
Refer to the graph below. A decrease in price from $3.50 to $3.00 per cup results in a gain and a loss of revenue. Which area represents the loss of revenue?
a. area A
b. area B
c. Areas A and B both represent revenue losses.
d. an area not shown
a. area A
Refer to the graph below. The loss in revenue from decreasing price is greater than the gain in revenue from increasing price whenever:
a. marginal revenue is positive.
b. marginal revenue is negative.
c. marginal revenue equals demand.
d. demand has a negative slope.
b. marginal revenue is negative.
Which of the following are characteristics of monopolistic competition?
a. high barriers to entry
b. few firms compete
c. firms sell similar, but not identical, products
d. all of the above
c. firms sell similar, but not identical, products
How does the entry of new coffeehouses affect the profits of existing coffeehouses?
a. Entry will increase the profits of existing coffeehouses by shifting the market demand curve for coffee to the right.
b. Entry will increase the profits of existing coffeehouses by shifting each of their individual demand curves to the right.
c. Entry will decrease the profits of existing coffeehouses by shifting each of their individual demand curves to the left and making the demand curves more elastic.
d. Entry will not affect the profits of existing coffeehouses.
c. Entry will decrease the profits of existing coffeehouses by shifting each of their individual demand curves to the left and making the demand curves more elastic.
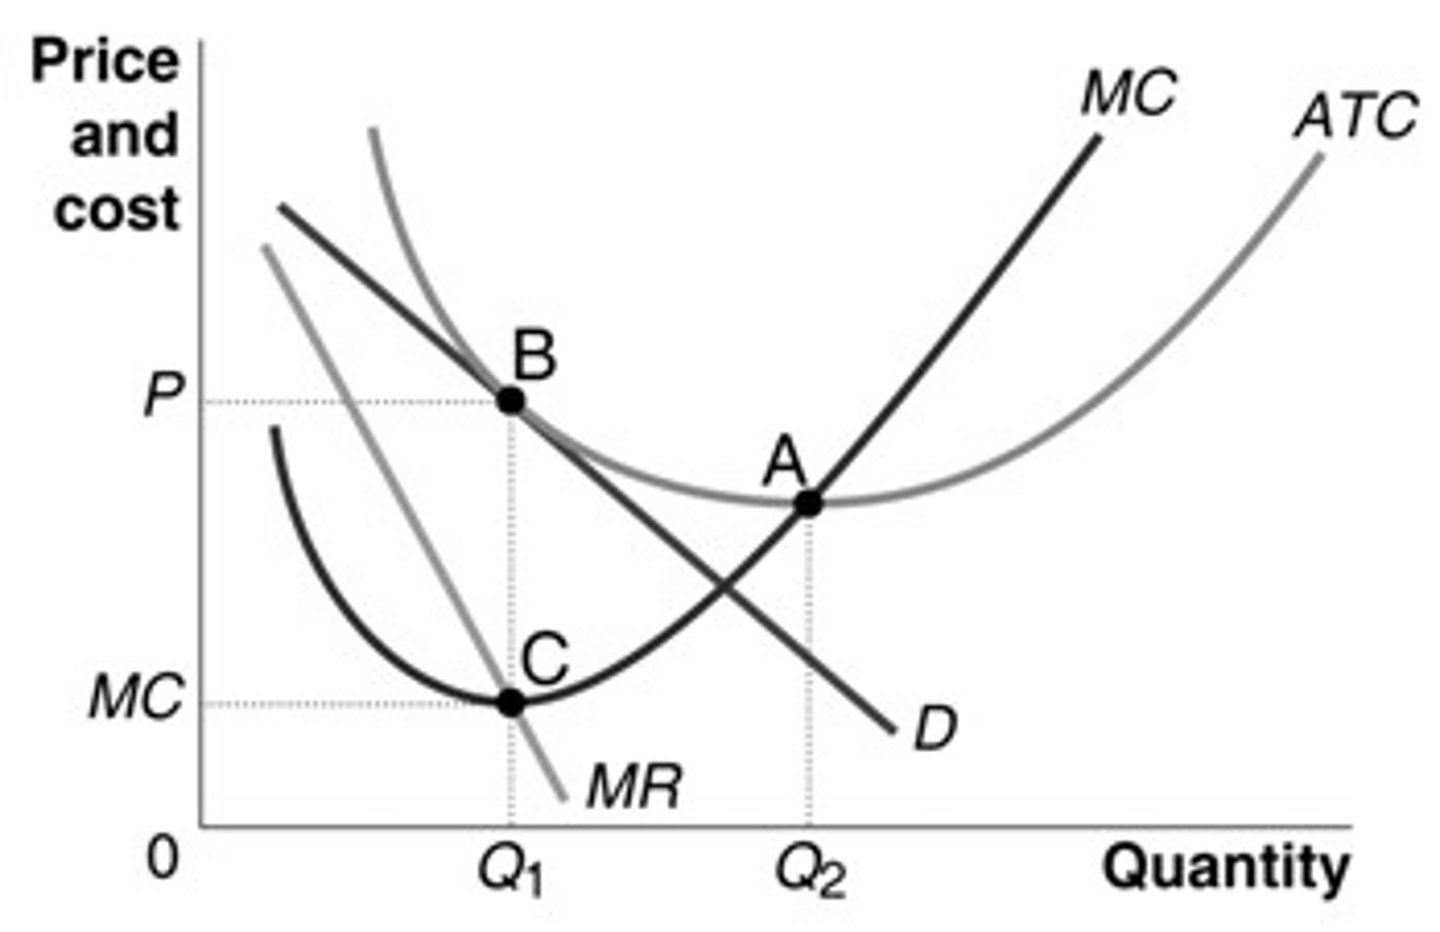
Refer to the graph below. Which level of output indicates excess capacity?
a. Q1
b. Q2
c. both Q1 and Q2
d. neither Q1 nor Q2
a. Q1
When a monopolistically competitive firm decreases price, good and bad things happen. Which of the following is considered a good thing for the firm?
a. the price effect
b. the output effect
c. the revenue effect
d. all of the above
b. the output effect
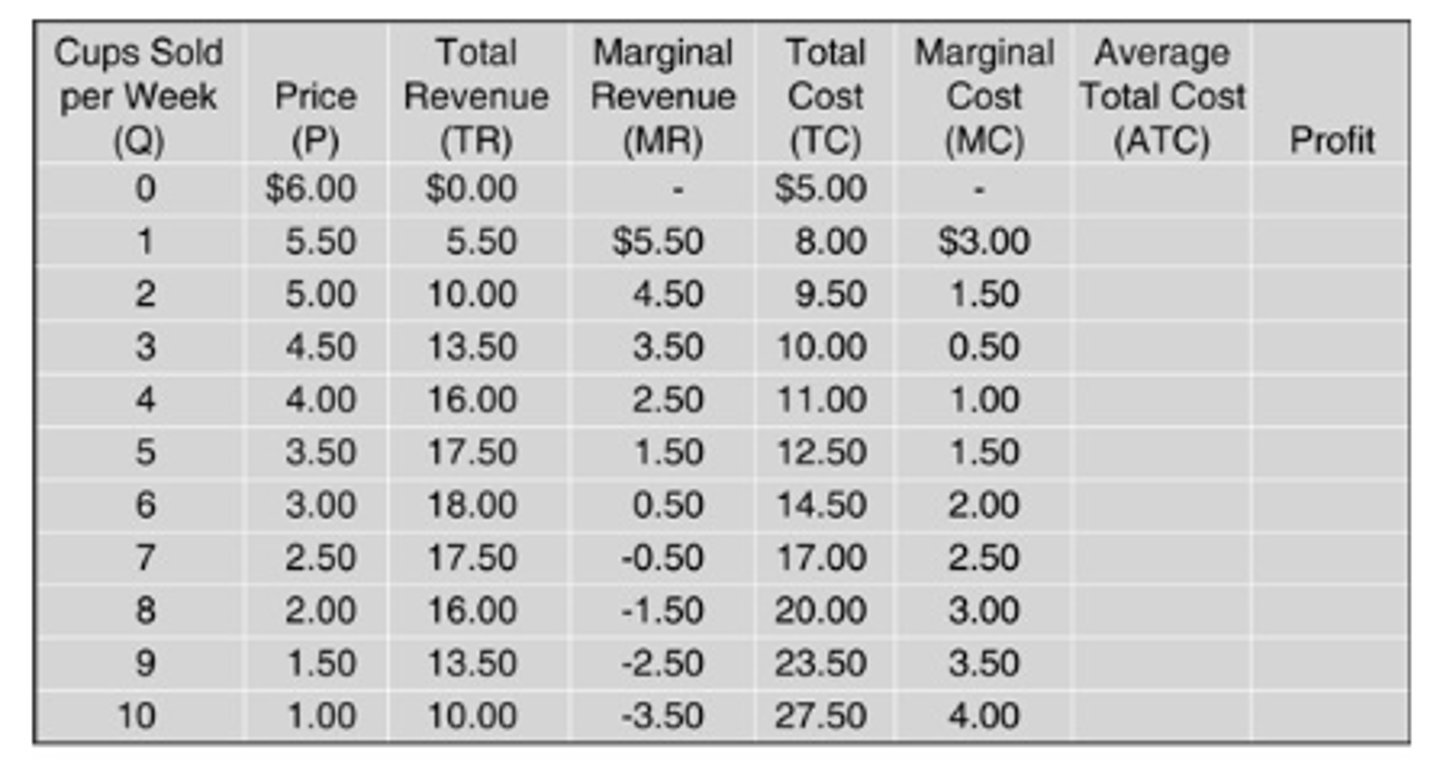
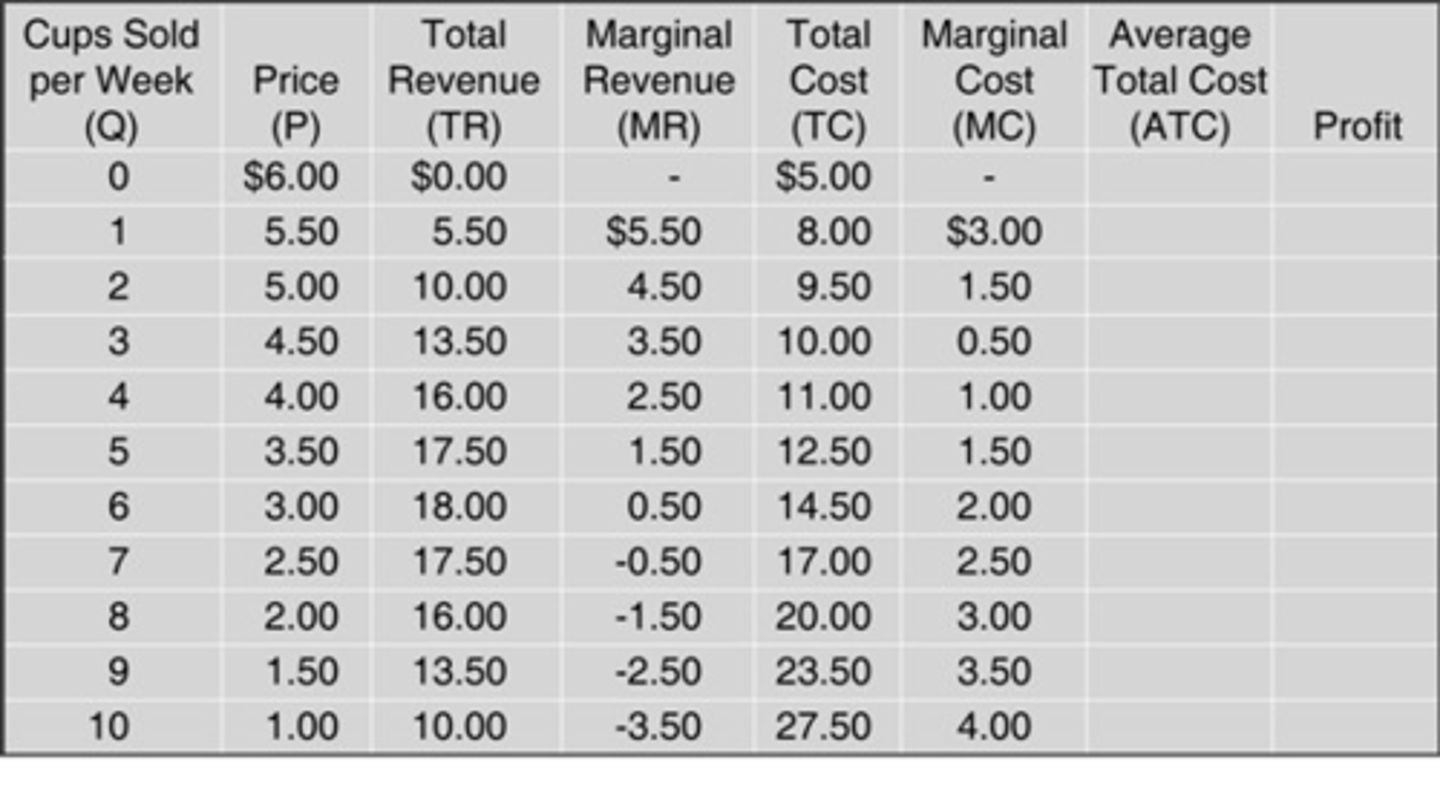
Refer to the table below. What is the marginal revenue associated with the sixth unit of output produced and sold?
a. $3.00
b. $2.00
c. $0.50
d. none of the above
c. $0.50
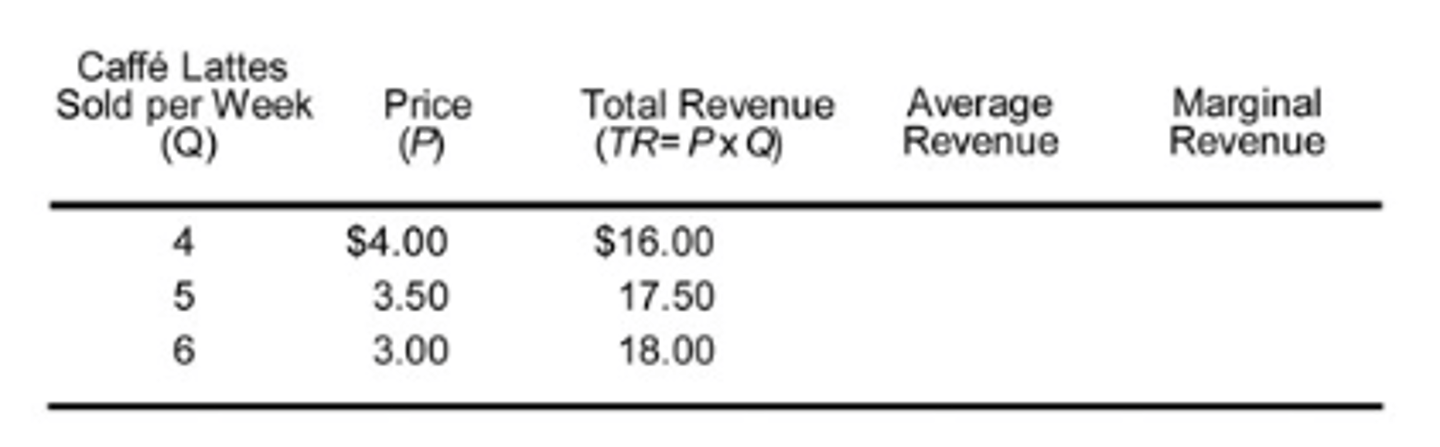
Refer to the table below. What is the average revenue associated with the sixth unit of output produced and sold?
a. $3.00
b. $2.00
c. $0.50
d. None of the above; there is insufficient information to answer the question.
a. $3.00

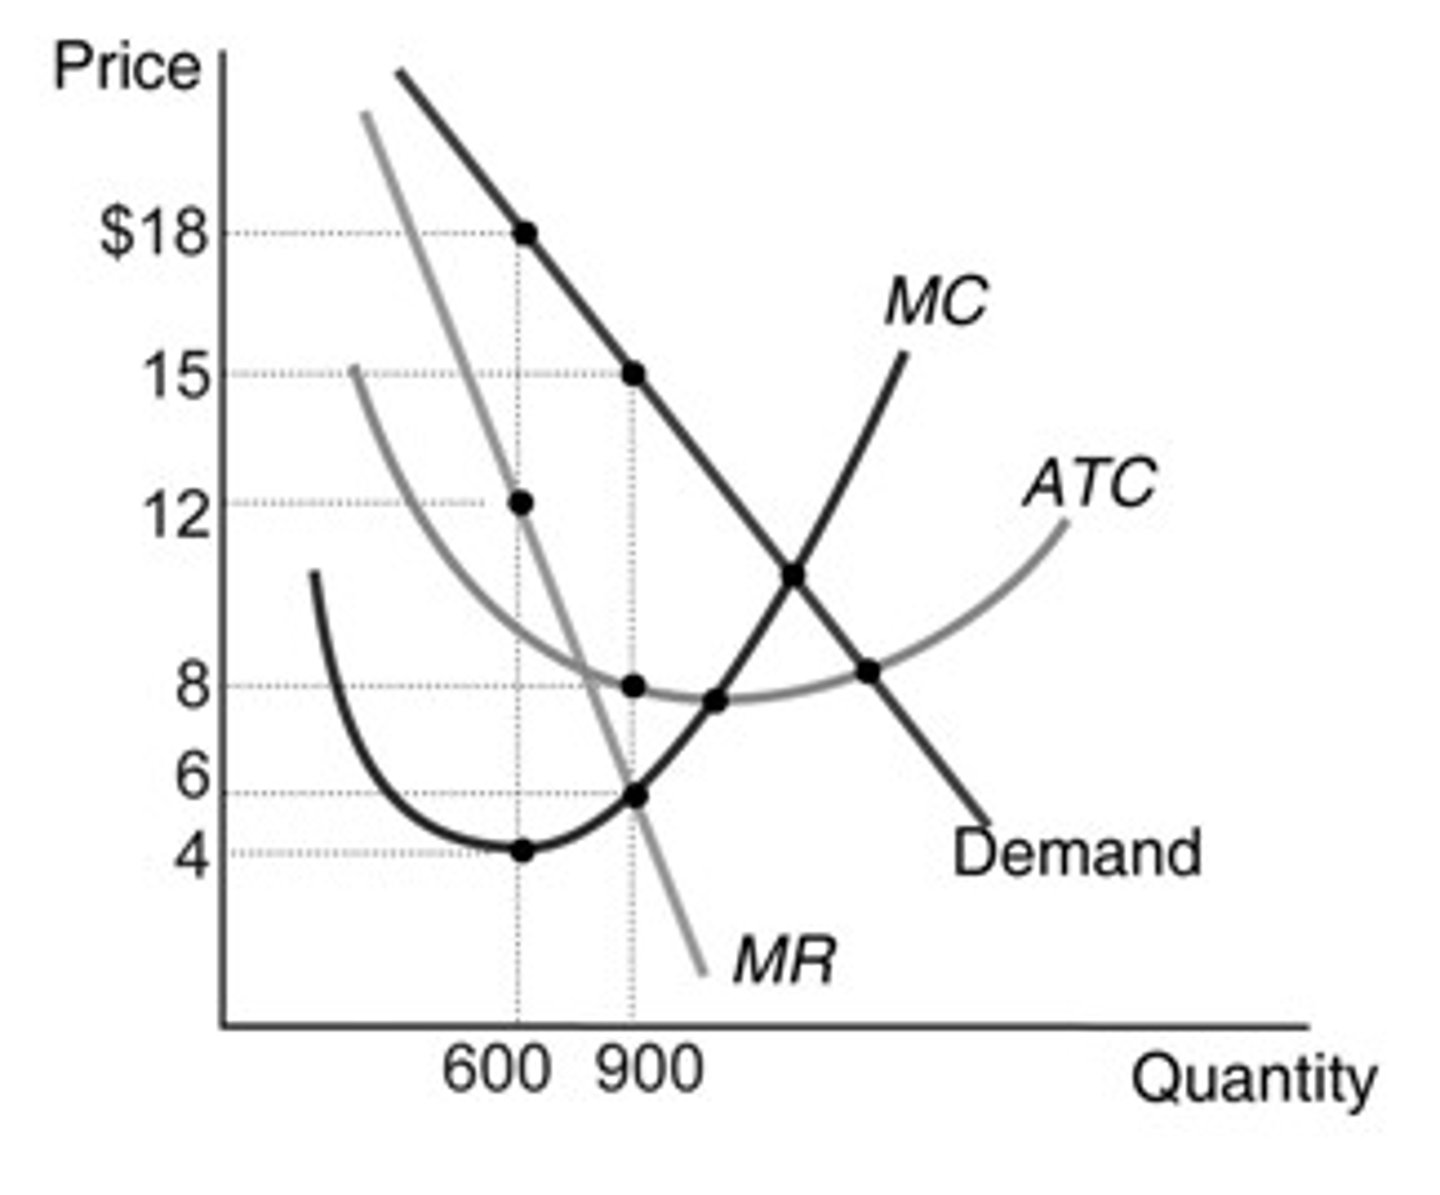
Refer to the graph below. In order to maximize profit, what price should the firm charge?
a. $18
b. $15
c. $8
d. $4
b. $15

Refer to the graph below. Assume that the firm is producing 600 units. What should the firm do in order to maximize profit?
a. The firm should increase output, because at 600 units, price is above marginal cost.
b. The firm should maintain output at 600 units, because at this output level, marginal revenue is greater than marginal cost, marginal cost is minimized, and price is the highest.
c. The firm should increase the level of output, because at 600 units, marginal revenue is greater than marginal cost.
d. The firm should increase the level of output until it reaches the minimum average total cost.
c. The firm should increase the level of output, because at 600 units, marginal revenue is greater than marginal cost.
Is zero economic profit inevitable in the long run for a monopolistically competitive firm?
a, Yes; there is nothing the firm can do to avoid zero economic profit in the long run.
b. No; a firm could try to continue making a profit in the long run by producing a product identical to those of competing firms.
c. No; a firm could try to continue making a profit in the long run by reducing production costs and improving its products.
d. No; a firm could try to continue making a profit in the long run by simply offering goods that are cheaper to produce, even if they have less value than those offered by competing firms.
c. No; a firm could try to continue making a profit in the long run by reducing production costs and improving its products.
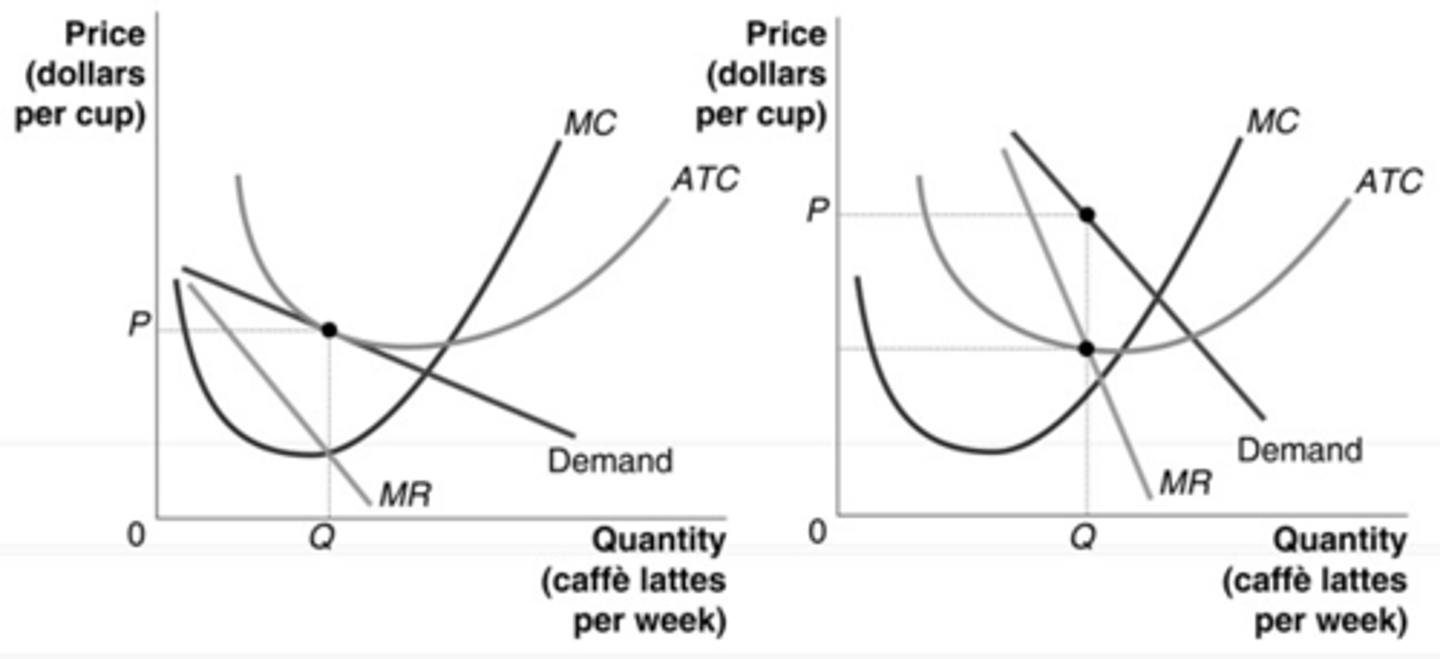
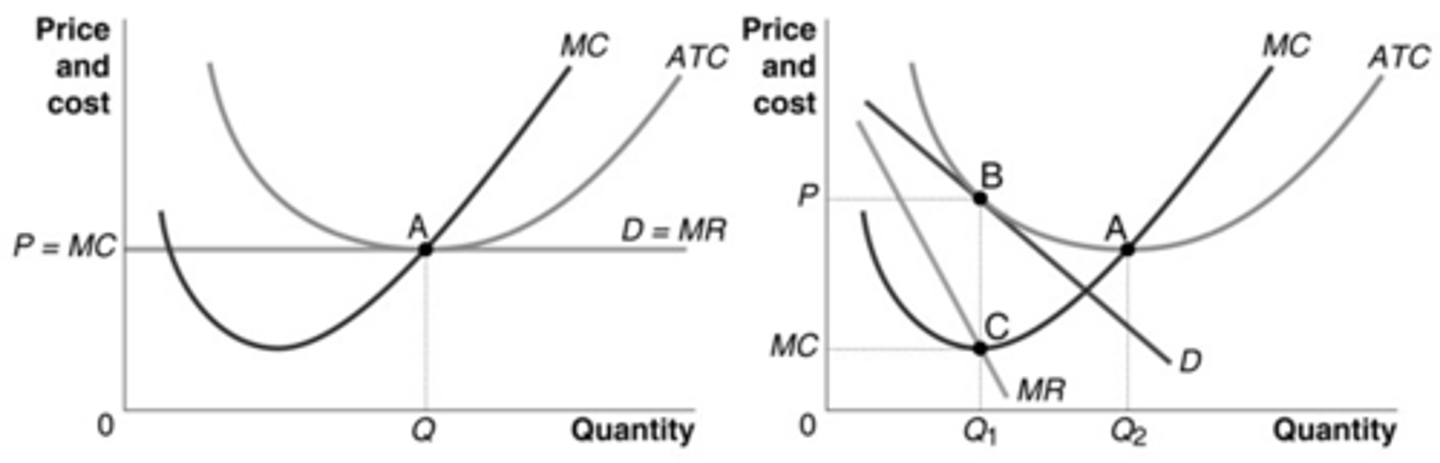
Refer to the graphs below. Assuming both firms are producing 5 cups per week, which firm is maximizing profits?
a. the firm on the left
b. the firm on the right
c. both firms
d. neither firm
c. both firms
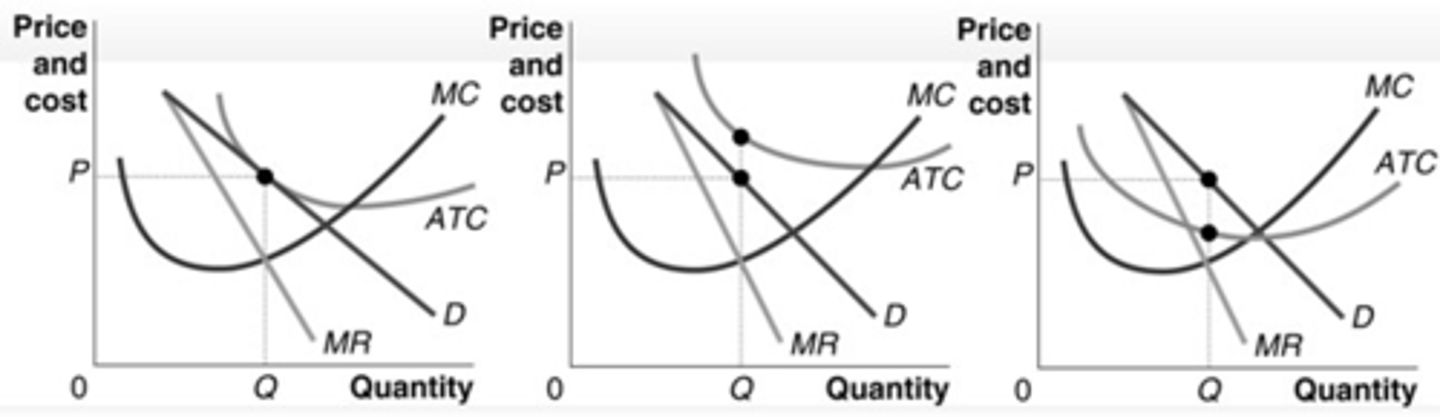
Refer to the graphs below. Which graph depicts a situation in which some firms will exit the industry?
a. the graph on the left
b. the graph in the middle
c. the graph on the right
d. none of the above
b. the graph in the middle
Refer to the table below. When is average total cost minimized?
a. at 1 unit of output
b. at 5 units of output
c. at 6 units of output
d. at 10 units of output
c. at 6 units of output
For what type of market structure is demand curve the same as marginal revenue?
a. monopolistic competition
b. perfect competition
c. both monopolistic and perfect competition
d. neither monopolistic nor perfect competition
b. perfect competition
If marginal revenue slopes downward, which of the following is true?
a. The firm must decrease its price to sell a larger quantity.
b. The firm must increase its price to sell a larger quantity.
c. The firm must decrease its price if it wants to continue selling the same quantity.
d. The firm is unable to adjust price when the quantity sold changes.
a. The firm must decrease its price to sell a larger quantity.
Refer to the graph below. A decrease in price from $3.50 to $3.00 per cup results in a gain and a loss of revenue. Which area represents the revenue gain?
a. area A
b. area B
c. Both shaded areas represent revenue gains.
d. an area not shown
b. area B

Refer to the graph below. Assume that the firm represented by the cost and demand curves below is maximizing profit. Which area represents the formula: (P – ATC) × Q?
a. area A
b. area B
c. area A + area B
d. area B – area A
a. area A
Which of the following terms best describes the additional revenue associated with selling an additional unit of output?
a. price
b. average revenue
c. marginal revenue
d. total revenue
c. marginal revenue
Which type of efficiency is achieved by a monopolistically competitive firm in the long run?
a. allocative efficiency
b. productive efficiency
c. both allocative and productive efficiency
d. neither allocative nor productive efficiency
d. neither allocative nor productive efficiency
If a firm has the ability to affect the price of the good or service it sells, what is the relationship between its marginal revenue curve and its demand curve?
a. The firm will have a marginal revenue curve that is above its demand curve.
b. The firm will have a marginal revenue curve that is below its demand curve.
c. The firm will have a marginal revenue curve that is the same as its demand curve.
d. The firm will have an upward-sloping marginal revenue curve and a downward-sloping demand curve.
b. The firm will have a marginal revenue curve that is below its demand curve.
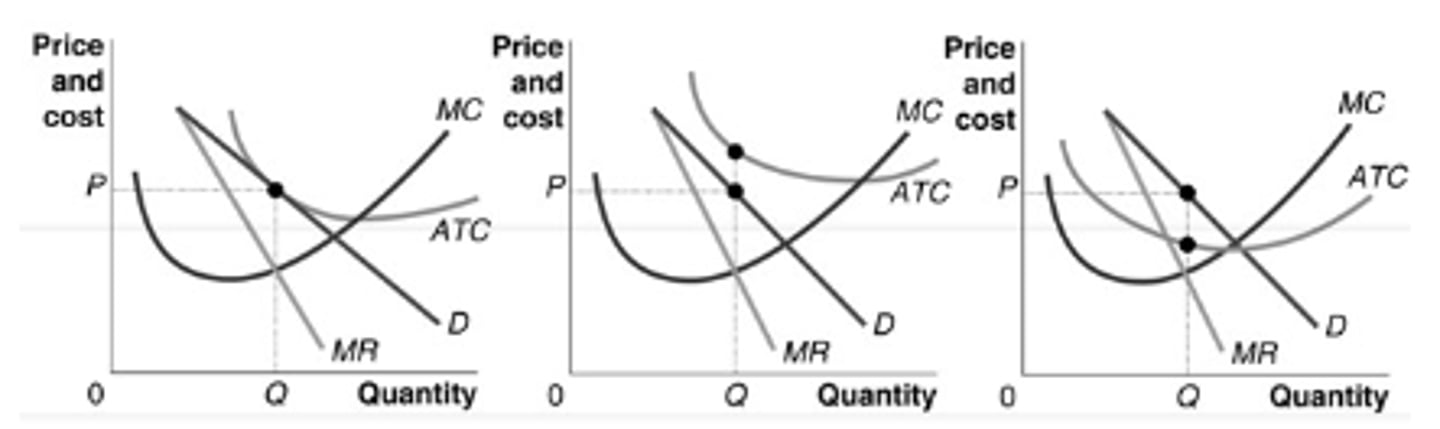
Refer to the graphs below. Which graph best depicts the relationship between price and average total cost in the long run for a monopolistically competitive firm?
a. the graph on the left
b. the graph in the middle
c. the graph on the right
d. none of the above
a. the graph on the left
Why does a monopolistically competitive firm have a downward-sloping demand curve?
a. because its customers only buy goods that are being discounted from their original prices
b. because changing the price will affect the quantity sold
c. because the firm is a price taker, like a wheat farmer
d. because the firm’s level of output produced depends on its cost structure
b. because changing the price will affect the quantity sold
Refer to the graphs below. Which firm is a monopolistic competitor operating in the long run?
a. the firm on the left
b. the firm on the right
c. both firms
d. neither firm
a. the firm on the left
Suppose you invest $200,000 in a business. The return you could earn each year on a similar investment using that money is 10 percent, or $20,000. In an economic sense, the $20,000 is:
a. an economic cost.
b. economic profit.
c. an accounting cost.
d. both economic profit and accounting profit.
a. an economic cost.
Which of the following types of firms use the marginal revenue equals marginal cost approach to maximize profits?
a. perfectly competitive firms
b. monopolistically competitive firms
c. both perfectly competitive and monopolistically competitive firms
d. neither perfectly competitive nor monopolistically competitive firms
c. both perfectly competitive and monopolistically competitive firms
What trade-offs do consumers face when buying a product from a monopolistically competitive firm?
a. Consumers pay a lower price but also have fewer choices.
b. Consumers pay a price greater than marginal cost but also have choices more suited to their tastes.
c. Consumers pay a higher price but are happy knowing that the industry is highly efficient.
d. Consumers pay a price as low as the competitive price but have difficulty finding and buying the product.
b. Consumers pay a price greater than marginal cost but also have choices more suited to their tastes.
Refer to the graphs below. Which graph best depicts a firm in a monopolistically competitive industry that has an incentive to exit the industry in the long run?
a. the graph on the left
b. the graph in the middle
c. the graph on the right
d. none of the above
a. the graph on the left
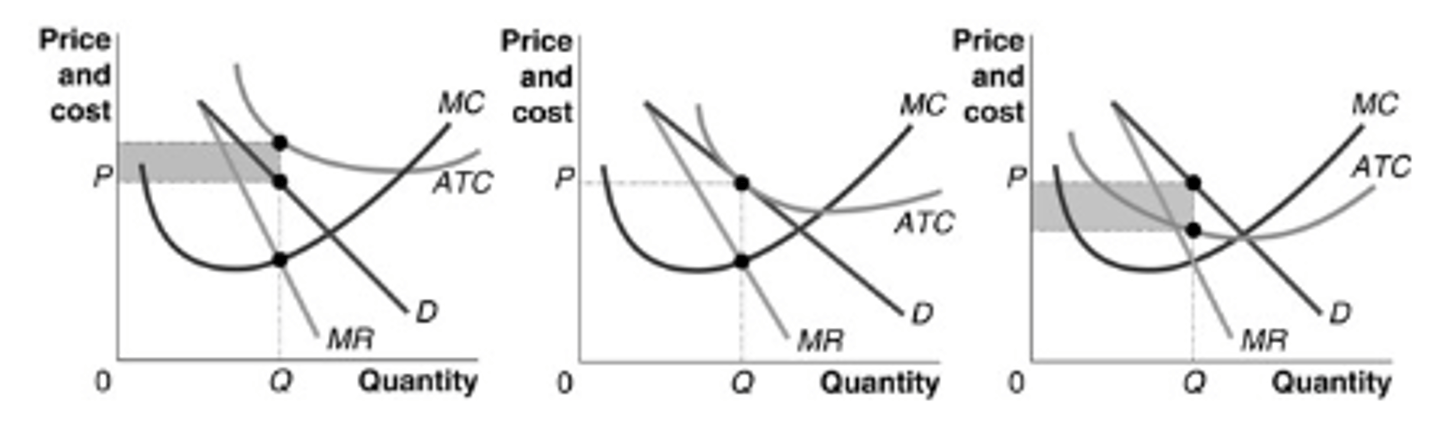
Refer to the graphs below, which represent the situations facing typical firms in three different monopolistically competitive industries. Which graph best represents the situation where new firms are likely to enter the industry?
a. the graph on the left
b. the graph in the middle
c. the graph on the right
d. none of the above
c. the graph on the right

Which of the following measures is conceptually the same as price?
a. marginal revenue
b. total revenue
c. average revenue
d. none of the above
c. average revenue
What is marginal cost?
a. the cost per unit of output produced
b. the increase in total cost resulting from producing one more unit of output
c. the impact of additional output on total fixed cost
d. the cost of production that is independent of the level of output produced
b. the increase in total cost resulting from producing one more unit of output
Refer to the graphs below. Which points on the graph coincide with productive efficiency?
a. point A on both graphs
b. point B on the graph on the right
c. point C on the graph on the right
d. points A, B, and C on the graph on the right
a. point A on both graphs
When a monopolistically competitive firm decreases price, good and bad things happen. Which of the following is considered a bad thing for the firm?
a. the price effect
b. the output effect
c. the revenue effect
d. all of the above
a. the price effect
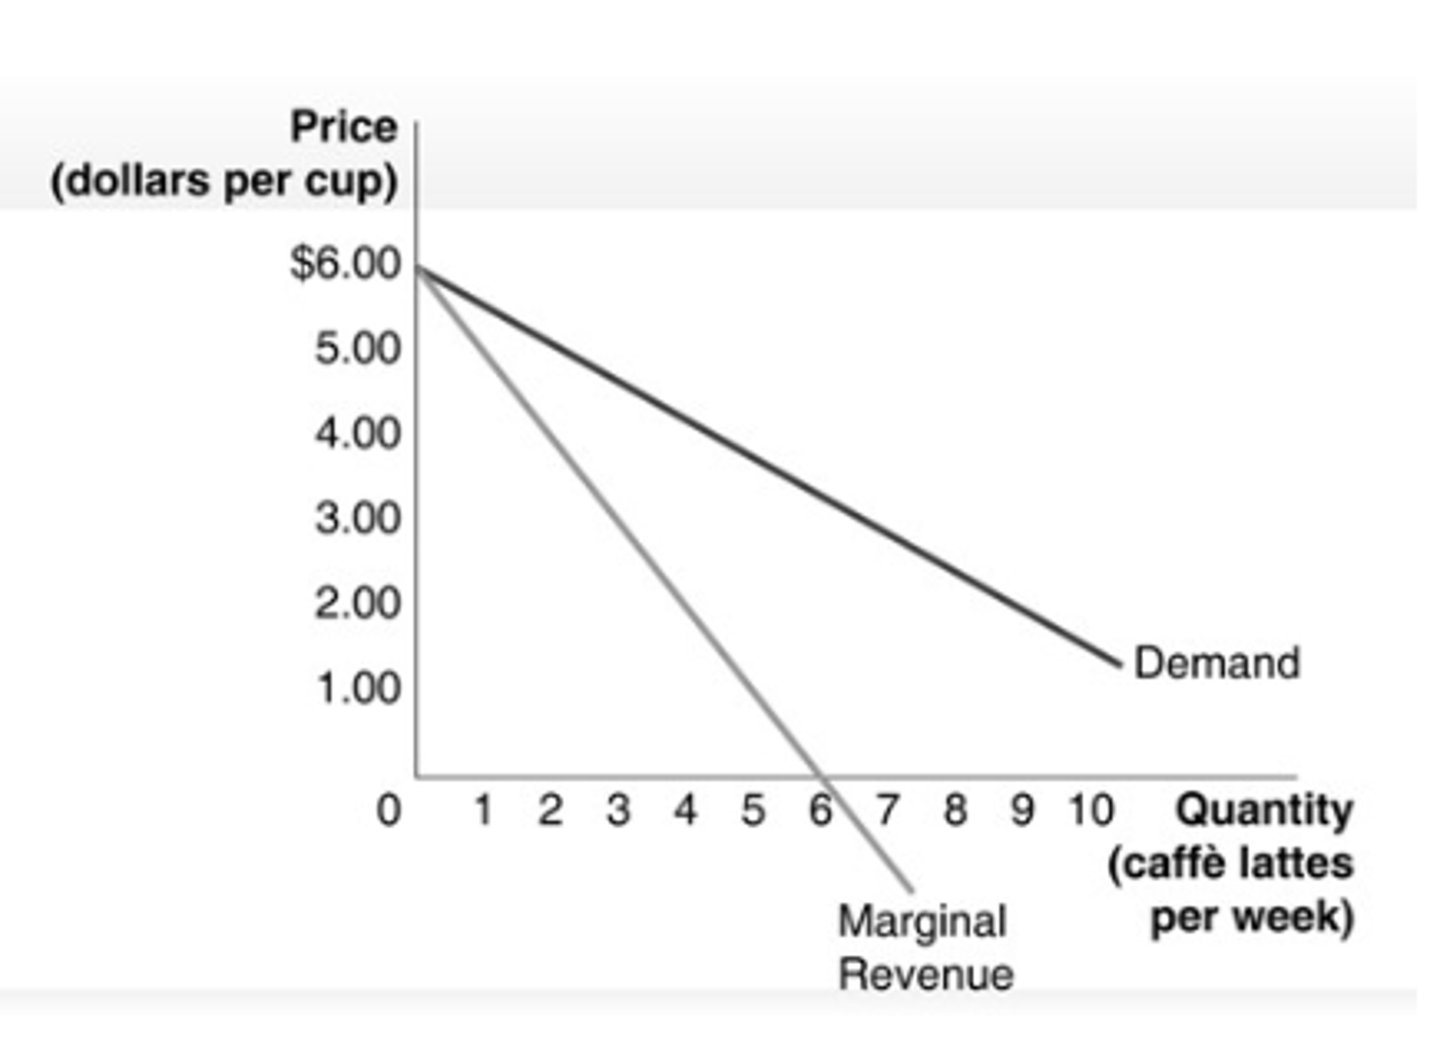
Refer to the graph below. According to this graph, what will happen if Starbucks increases the price of caffè lattes?
a. It will not lose any customers.
b. It will lose all of its customers.
c. It will lose some, but not all, of its customers.
d. It will gain customers.
c. It will lose some, but not all, of its customers.
Refer to the graphs below. Which graph best depicts the profit or loss situation for a monopolistically competitive firm in the long run?
a. the graph on the left
b. the graph in the middle
c. the graph on the right
d. none of the above
b. the graph in the middle

Refer to the table below. What level of output should be produced in order to maximize profit?
a. 1 unit of output
b. 5 units of output
c. 6 units of output
d. 10 units of output
b. 5 units of output
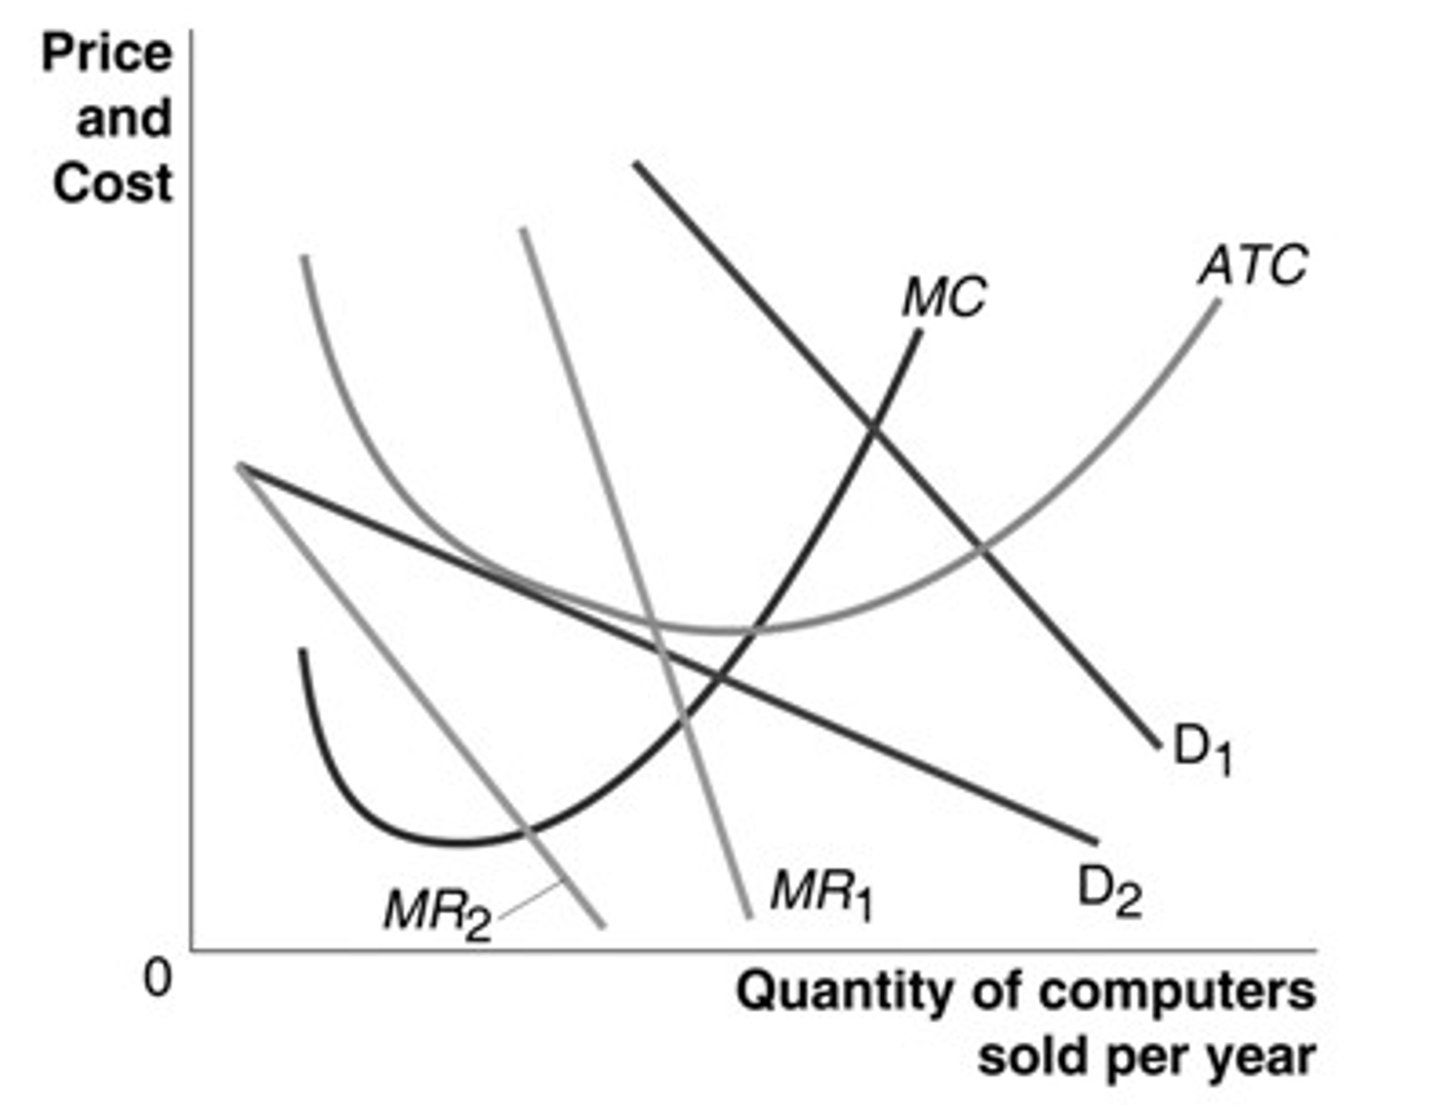
Refer to the graph below. Assuming the computer industry is monopolistically competitive, which set of demand and marginal revenue curves for a typical firm is more consistent with long-run equilibrium in the computer industry?
a. D1 and MR1
b. D2 and MR2
c. D1 and MR2
d. D2 and MR1
b. D2 and MR2